Value stream mapping tool
Transform your workflows with our value stream mapping tool. Simplify, visualize, and optimize your processes effortlessly.
Why Use EdrawMax Value stream mapping tool?
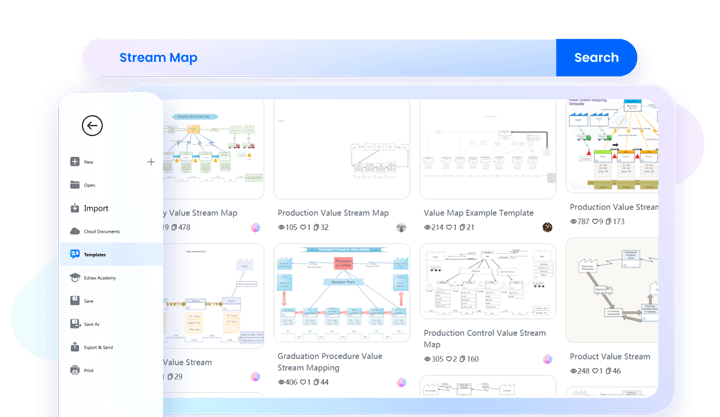
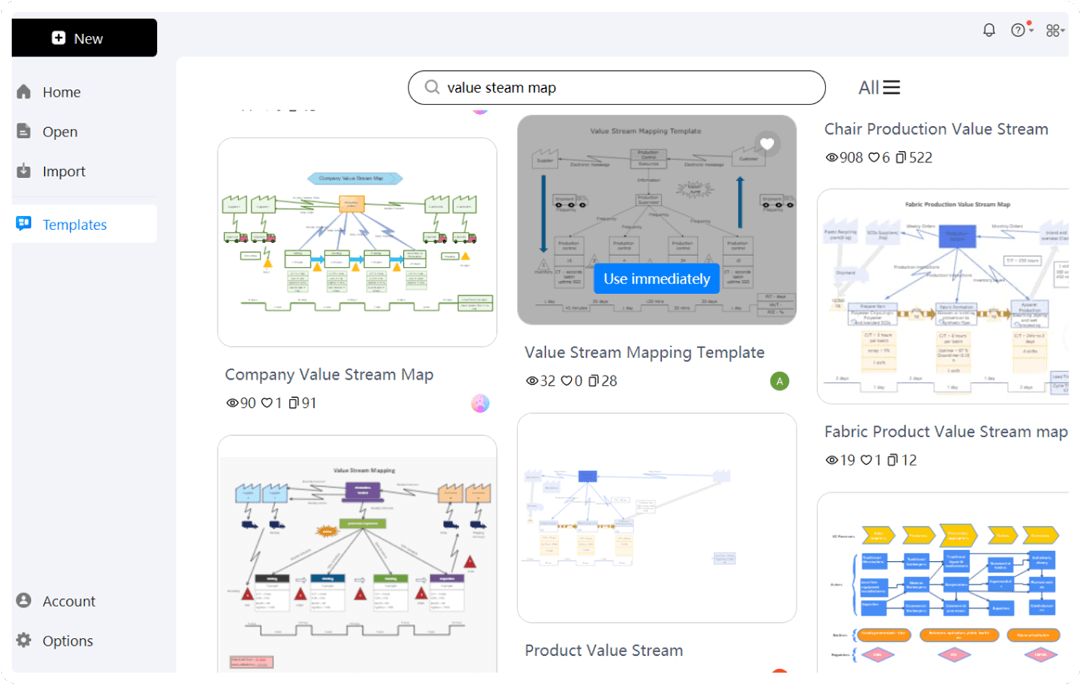
EdrawMax provides an extensive library of templates to kickstart your value stream mapping process. These templates are designed for various industries and scenarios, like manufacturing, ensuring you have a solid foundation to build upon. You can easily modify these templates to meet specific needs, making EdrawMax a versatile VSM tool.
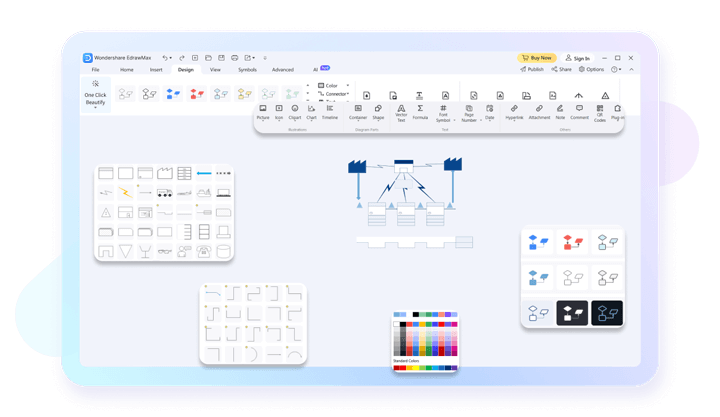
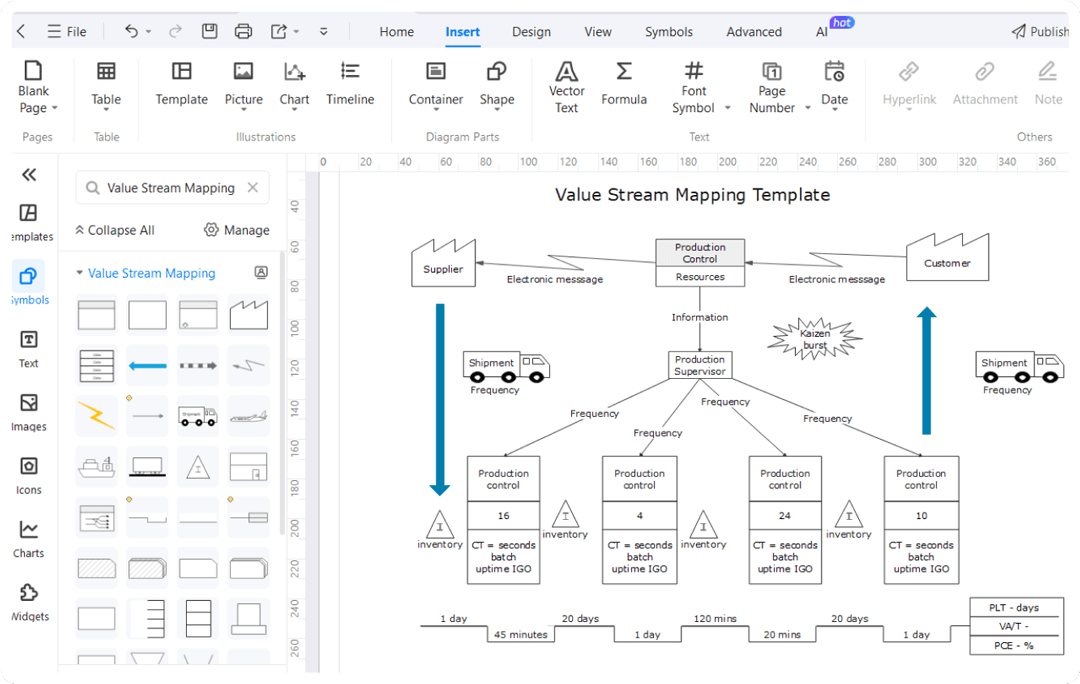
The user-friendly interface of EdrawMax makes VSM mapping straightforward and accessible, even for beginners. The intuitive drag-and-drop functionality simplifies the diagramming process, while interactive tools and a well-organized layout help users create detailed and accurate value stream mapping diagrams with ease.
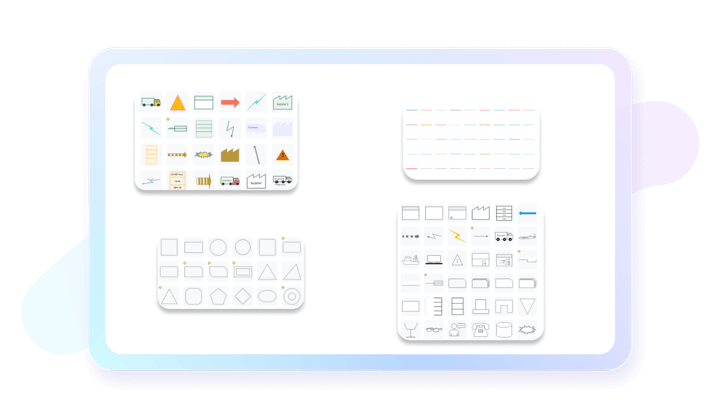
EdrawMax offers a comprehensive library of symbols specific to value stream mapping and other diagramming needs. This extensive collection includes VSM-specific symbols like process boxes and inventory triangles, which ensure your diagrams adhere to industry standards. The flexibility to customize symbols further enhances the tool's utility.
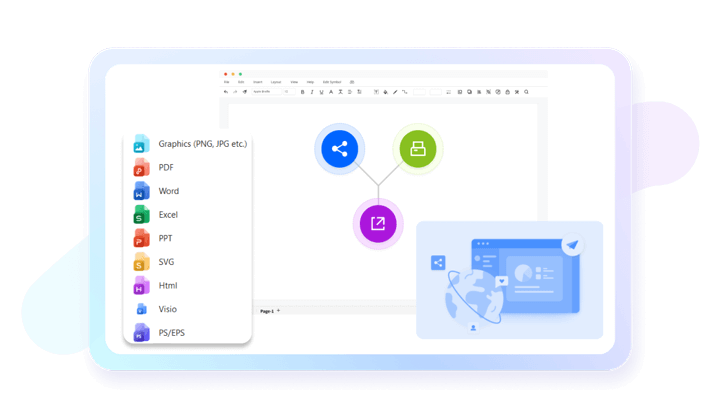
Collaboration is crucial in process improvement, and EdrawMax excels in this area with its robust sharing capabilities. You can work with team members in real-time, export diagrams in various formats such as VSDX and SVG, and store them securely in the cloud. This helps in your value stream mapping diagrams are easily accessible and shareable.

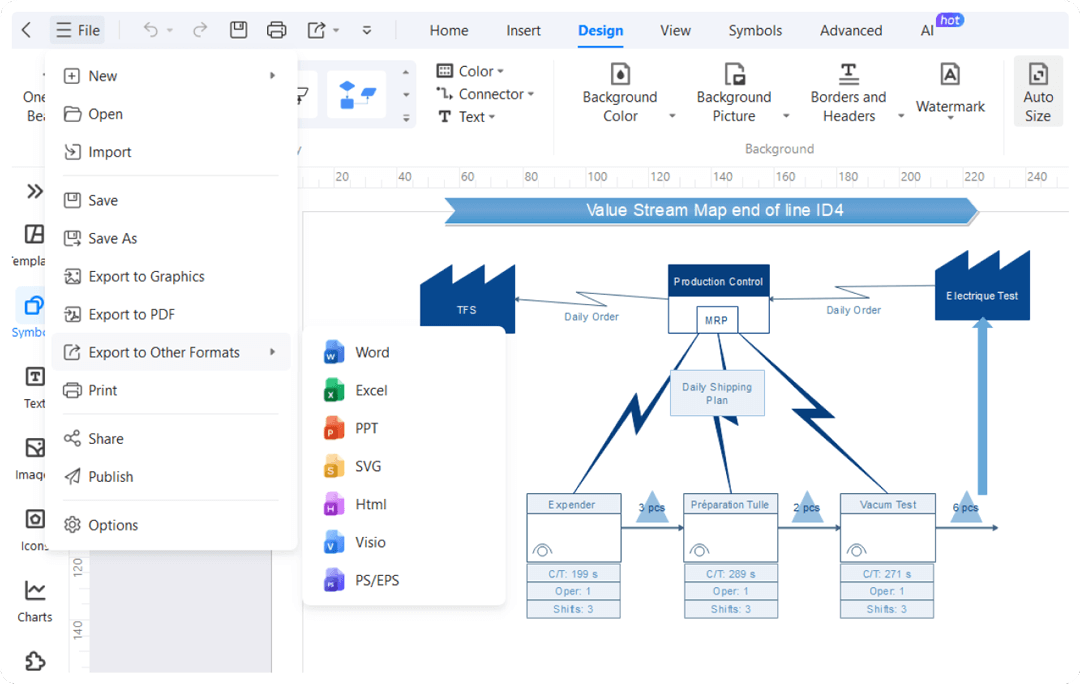
Integration with other software is easy with EdrawMax that supports multiple formats. You can export diagrams in different formats, including VSDX, PPTX, and SVG. This versatility ensures compatibility with various other tools and platforms, making it easy to share and present your value stream mapping diagrams.
How to Make a Value stream map in 3 Simple Steps
What our users say
More Value Stream Map Tools
Discover more AI-powered diagram makers to boost your productivity.
FAQs About EdrawMax Value stream map Tools
-
What is a Value Stream Map?A Value Stream Map is a visual tool used to illustrate the flow of materials and information required to bring a product or service to a customer. It identifies every step in a process, highlighting both value-adding activities and non-value-adding waste to help organizations improve their overall efficiency.
-
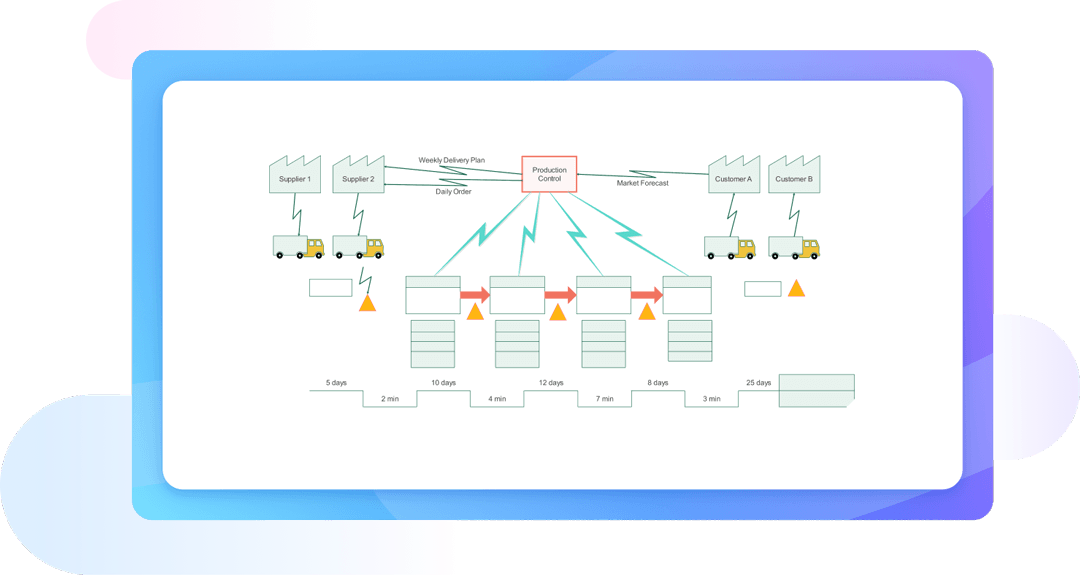
What are the key components of a Value Stream Map?A standard map includes three main sections: information flow, product flow, and a time ladder. It uses specific symbols to represent customers, suppliers, processes, inventory levels, and data boxes. These elements work together to provide a comprehensive snapshot of how work moves through the system from start to finish.
-
What is the difference between a Current State and a Future State map?A Current State map depicts how a process actually functions today, revealing existing inefficiencies and waste. In contrast, a Future State map represents the idealized version of that process after improvements are implemented. Comparing the two helps teams create a clear roadmap for transitioning toward a leaner, more efficient operation.
-
How does Value Stream Mapping relate to Lean methodology?Value Stream Mapping is a fundamental pillar of Lean management. It serves as a diagnostic tool to identify the eight types of waste, such as overproduction and waiting. By visualizing the flow, Lean practitioners can focus on creating continuous flow and "pull" systems, ultimately delivering maximum value to the customer.
-
How to create a Value Stream Map?To create a map, first define the product family and scope. Next, walk the actual process to gather data for the Current State map. Analyze this data to identify waste, then design a Future State map. Finally, develop and execute an implementation plan to bridge the gap between them.
Learn about Value Stream Map
Stop drawing. Start describing.
AI diagramming isn't just text-to-diagram.
AI now understands any input, fetches live data, adapts through dialogue, and works everywhere.
Free Value stream map templates from EdrawMax