About this class diagram for online weather forecasting template
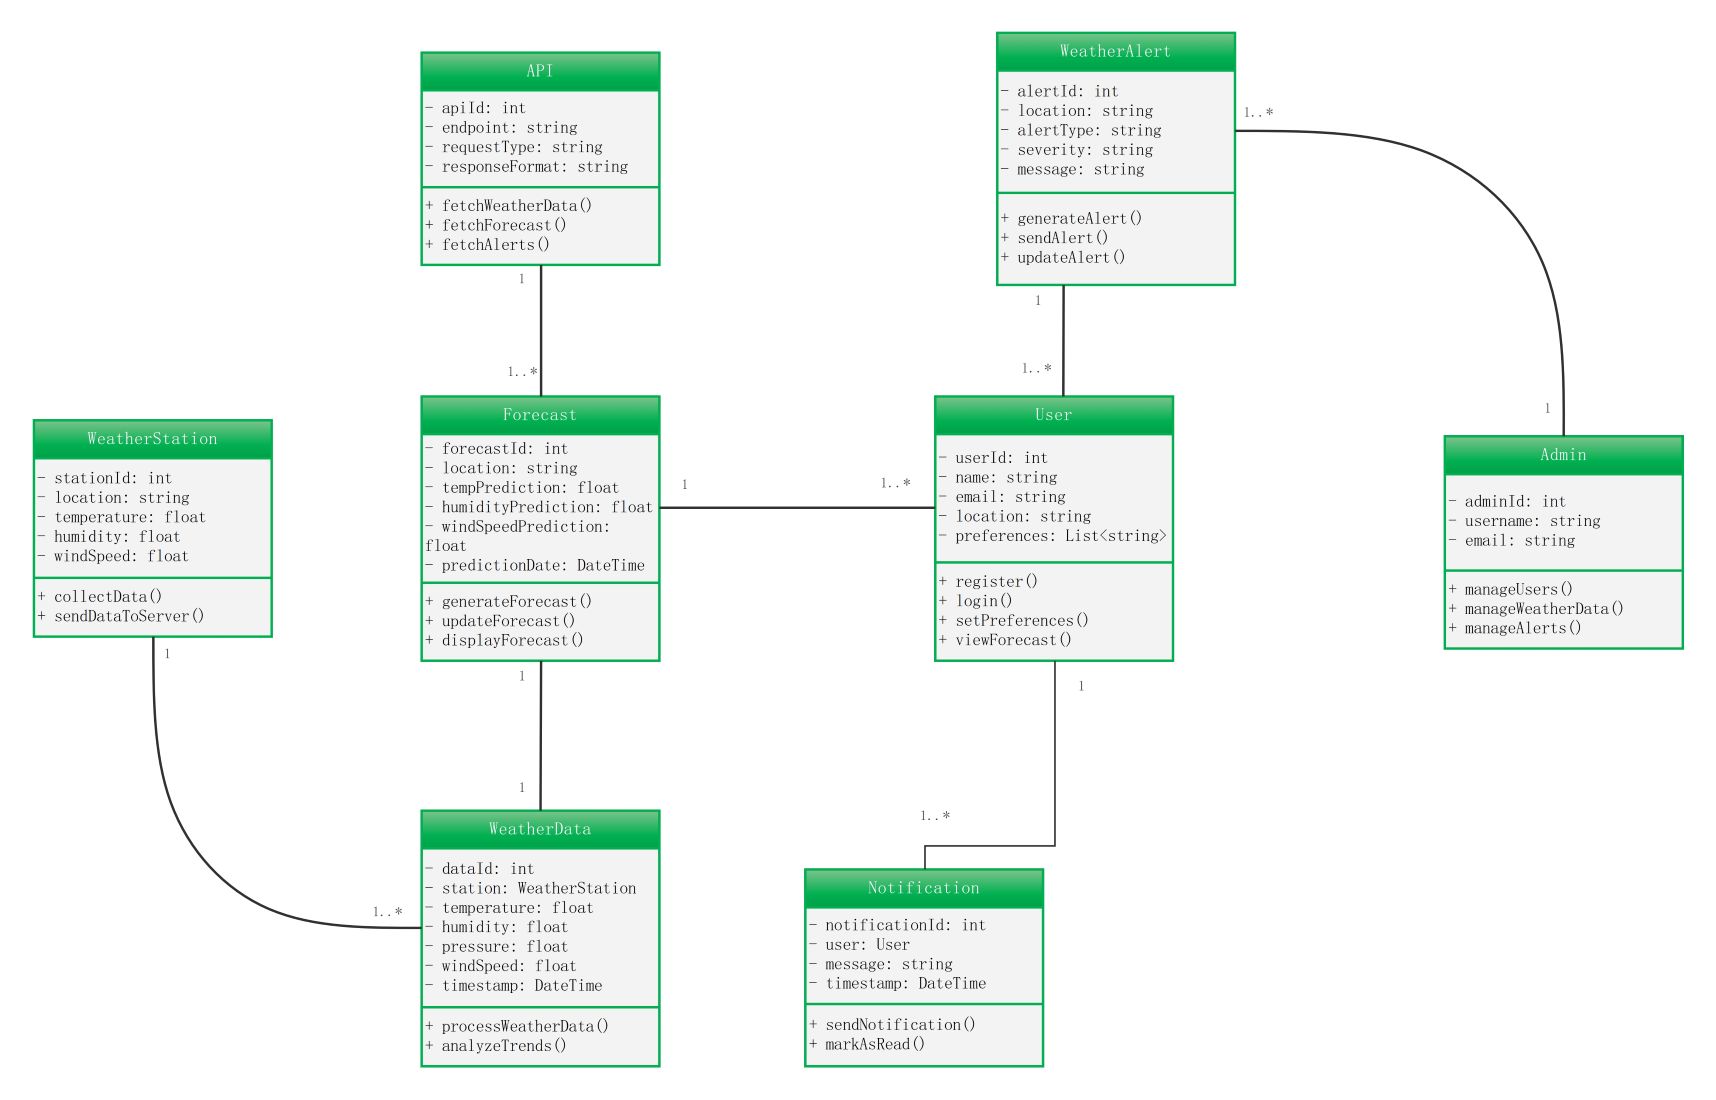
This template provides a clear visual map of how a weather forecasting system functions. It outlines the relationships between users, weather stations, and data processing units. It is perfect for developers planning software architecture.
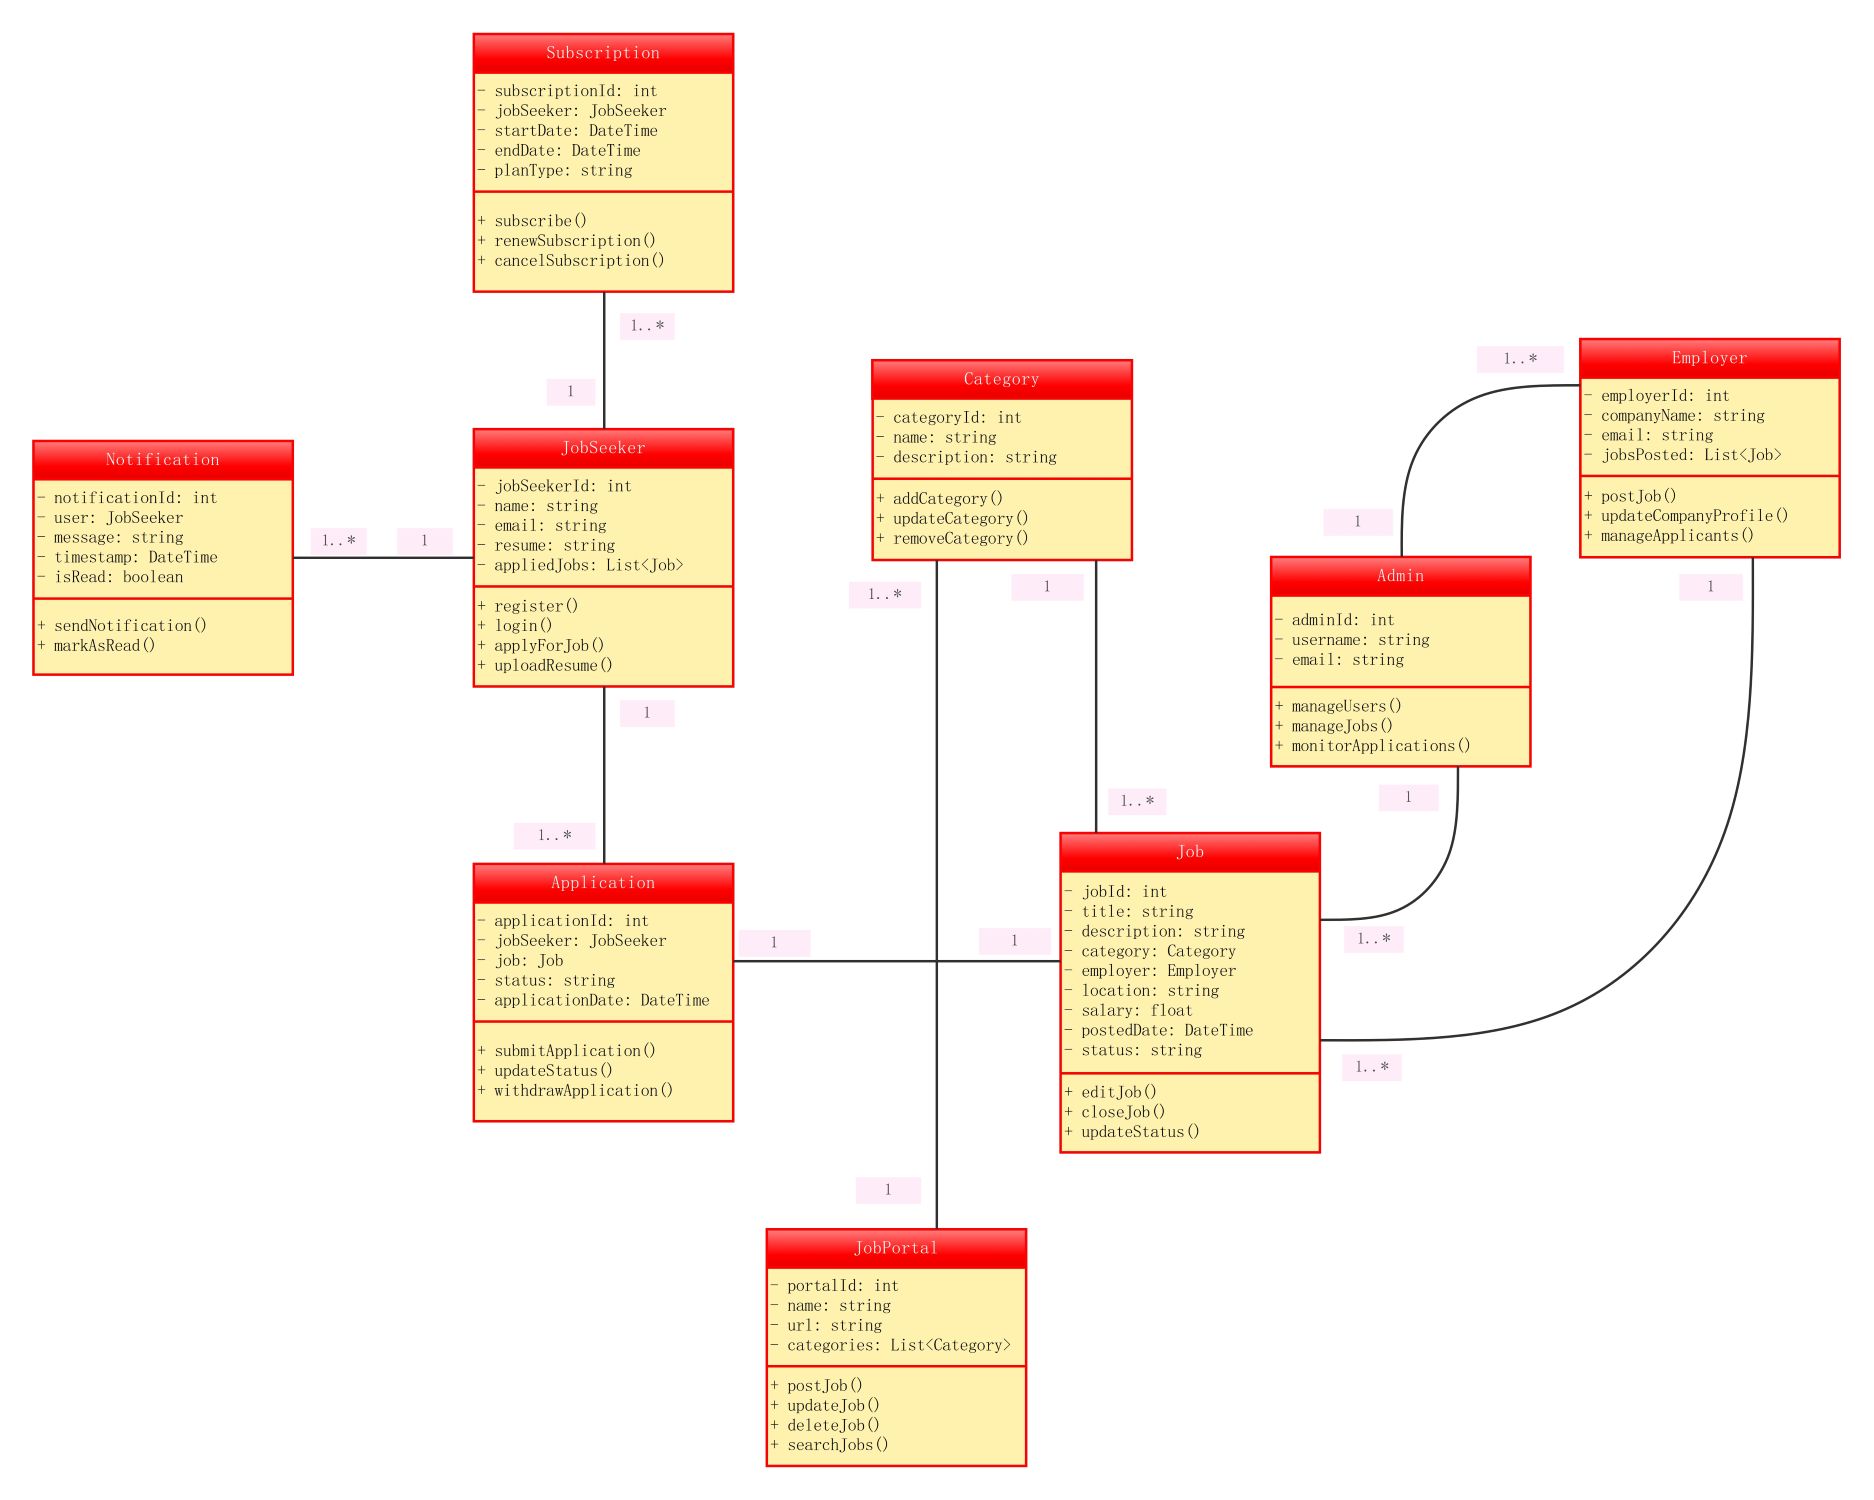
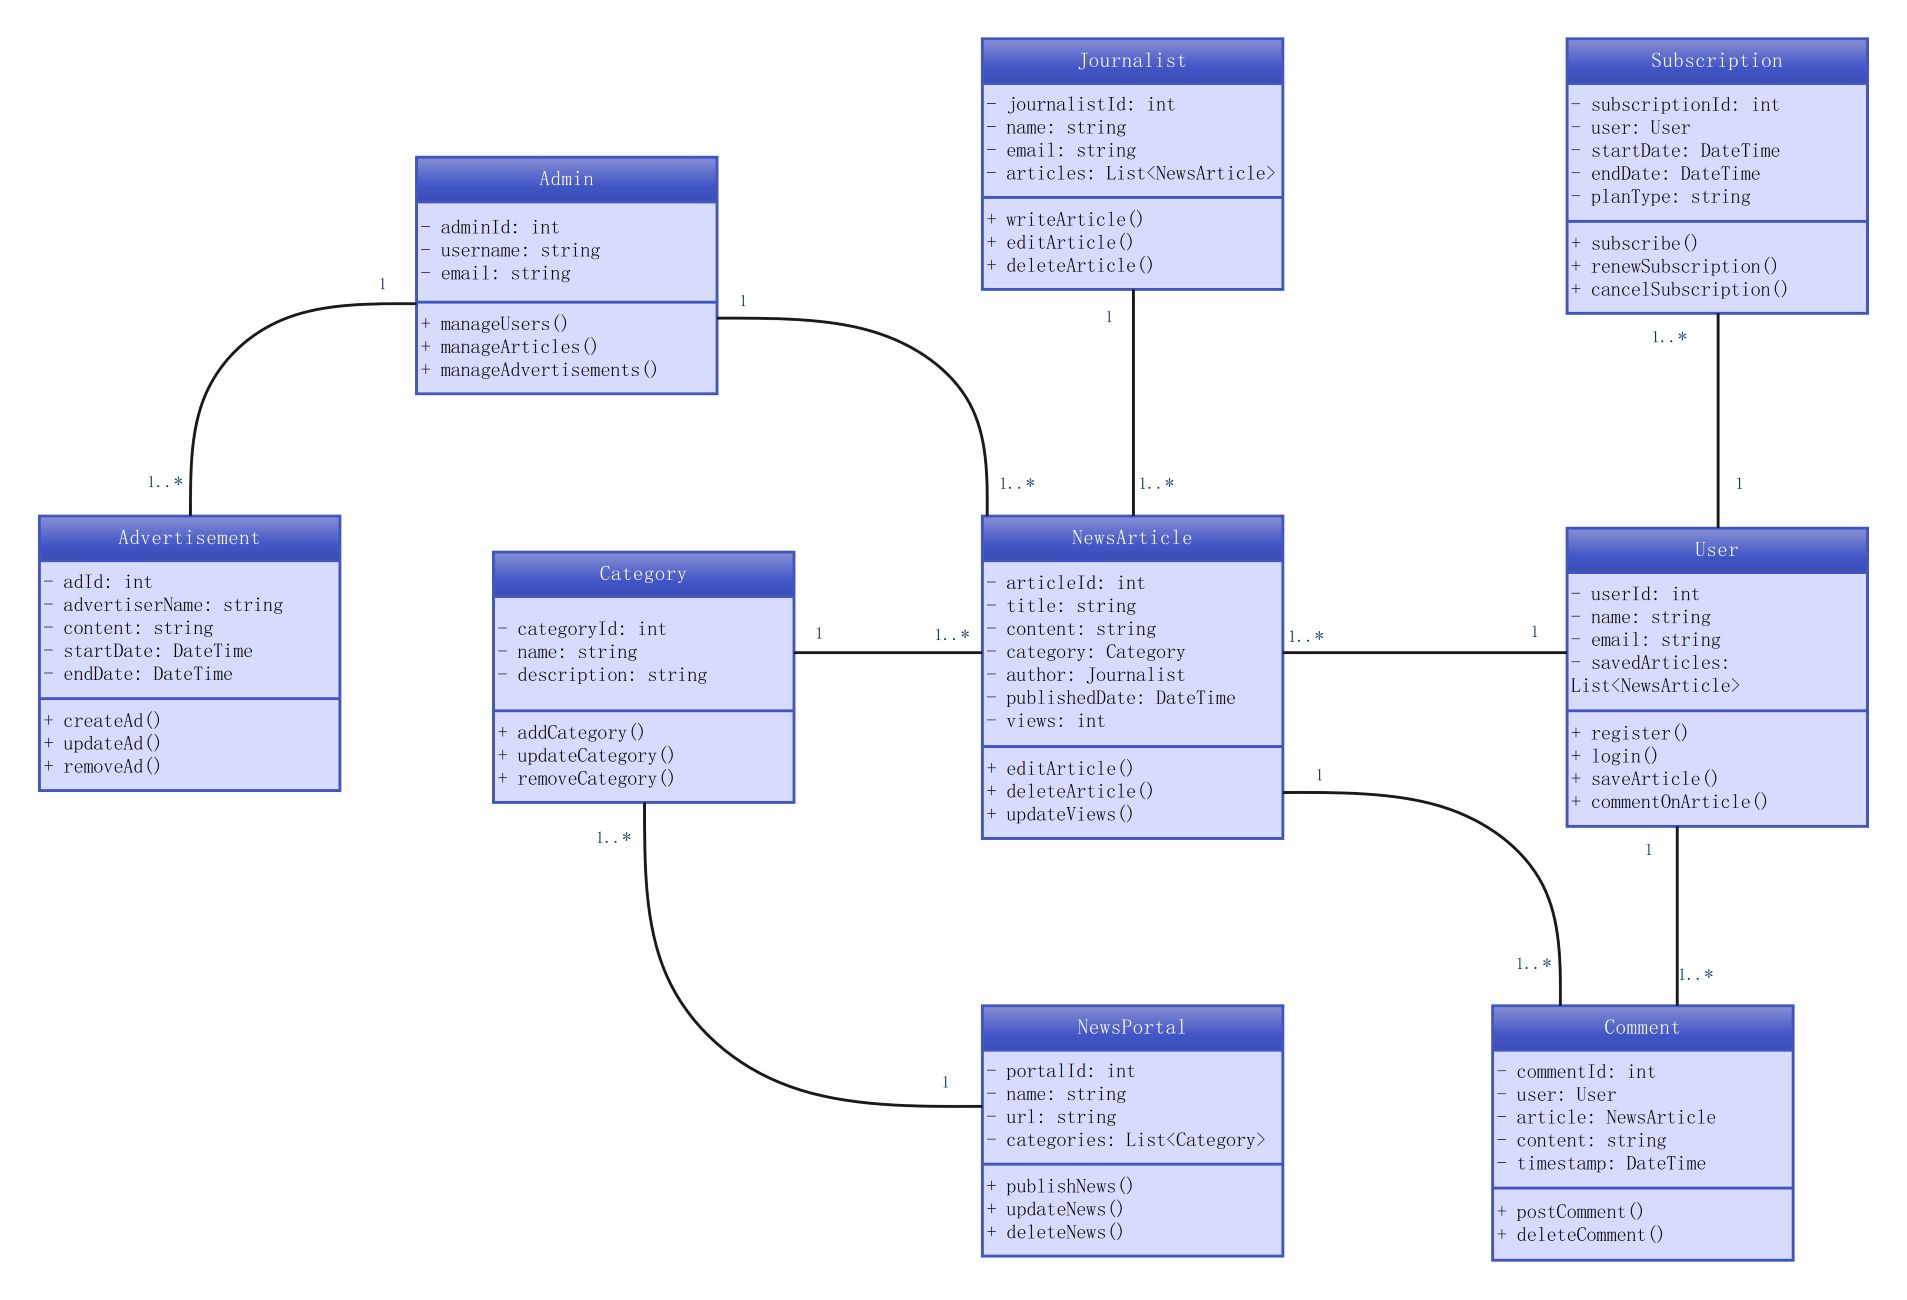
API and Forecast Management
The API class handles data retrieval from external sources or internal databases. The Forecast class uses this data to predict future conditions like wind speed and humidity levels for specific locations.
- apiId
- fetchWeatherData()
- forecastId
- generateForecast()
Data Collection and Processing
The WeatherStation class represents physical hardware that collects real-time atmospheric data. This information is passed to the WeatherData class, which processes trends and stores specific measurements like pressure and temperature.
- stationId
- collectData()
- temperature
- processWeatherData()
User and Administrator Roles
The User class manages registration and personal preferences for viewing forecasts. The Admin class has higher privileges, allowing for the management of users, weather data updates, and the creation of critical alerts.
- userId
- register()
- adminId
- manageUsers()
Weather Alerts and Notifications
The WeatherAlert class creates urgent messages based on severity levels. These alerts are sent to users through the Notification class, which tracks message delivery and allows users to mark them as read.
- alertId
- sendAlert()
- notificationId
- sendNotification()
FAQs about this Template
-
What is the purpose of a class diagram for online weather forecasting?
A class diagram for online weather forecasting serves as a blueprint for the software. It defines the system's objects, such as weather stations and user accounts. By showing how these parts interact, developers can build a stable and efficient platform. This visualization helps team members understand the data flow and the specific functions required for accurate weather reporting.
-
How does the system handle weather alerts for users?
The system uses a specific WeatherAlert class to identify dangerous weather conditions like storms or high winds. Once an alert is generated, the Notification class takes over to deliver this message to the relevant users. This ensures that people receive timely information based on their location. This structured approach helps maintain safety and keeps the community informed during weather events.
-
Why is the WeatherStation class important in this model?
The WeatherStation class is vital because it represents the primary source of raw environmental data. It tracks metrics like temperature, humidity, and wind speed at a physical location. Without this class, the system would lack the real-time inputs needed to generate forecasts. It acts as the foundation for the entire data processing pipeline, making sure predictions are based on facts.