


Metlab is a tool used by many people. However, creating some charts like bar charts in Metlab can be difficult for some. If you have difficulty doing it, this guide is exactly what need.
In case you might need to create professional bar charts, consider a dedicated diagram app such as Wondershare EdrawMax is an excellent alternative for many. Explore the article below to create a bar chart in Metlab or with a dedicated diagram tool.
In this article
Part I. How To Create a Bar Chart in Metlab
Creating a bar chart in MATLAB is super easy through the inbuilt Bar() function. The function requires one mandatory parameter as an input to create a bar chart from your data instantly. You can create different types and styles of bar charts by mentioning optional parameters in the Bar() function. Here are the steps to create a bar chart in MATLAB.
Syntax:
- 1. bar(y) - where y is a set of data represented in bars along the y-axis.
- 2. bar(x,y) - where x is a set of data corresponding to the bars in the x-axis.
- 3. bar(y,w) - where w is the width between the bars represented in percentage.
Steps:
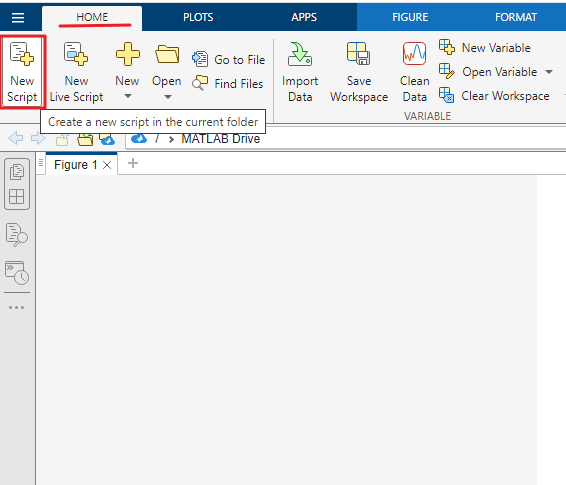
1. Open MATLAB on your computer. Go to the Home tab. Click on the New Script button to get started.
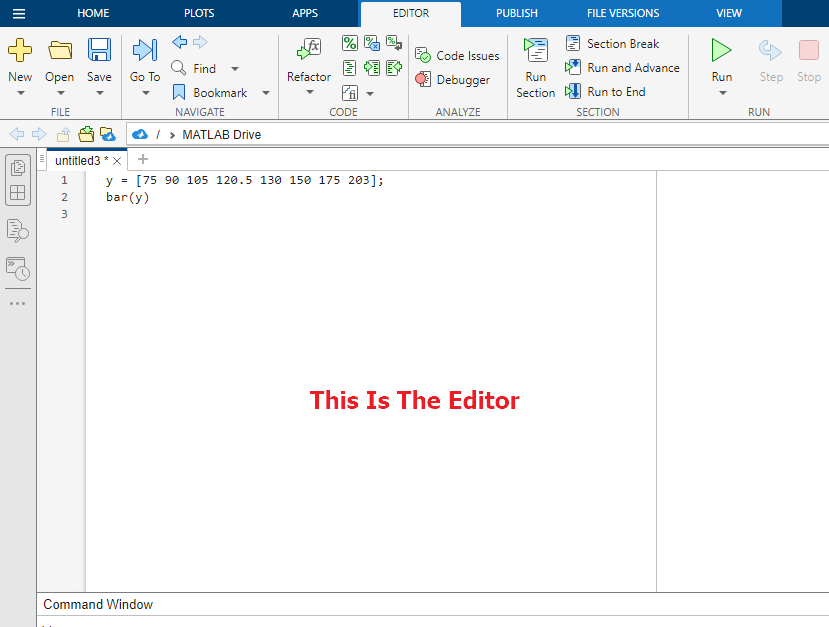
2. You will see the editor on your screen where you must write the code to create a bar chart. To create a basic bar chart from random data, write the following code.
- y = [75 90 105 120.5 130 150 175 203];
- bar(y)
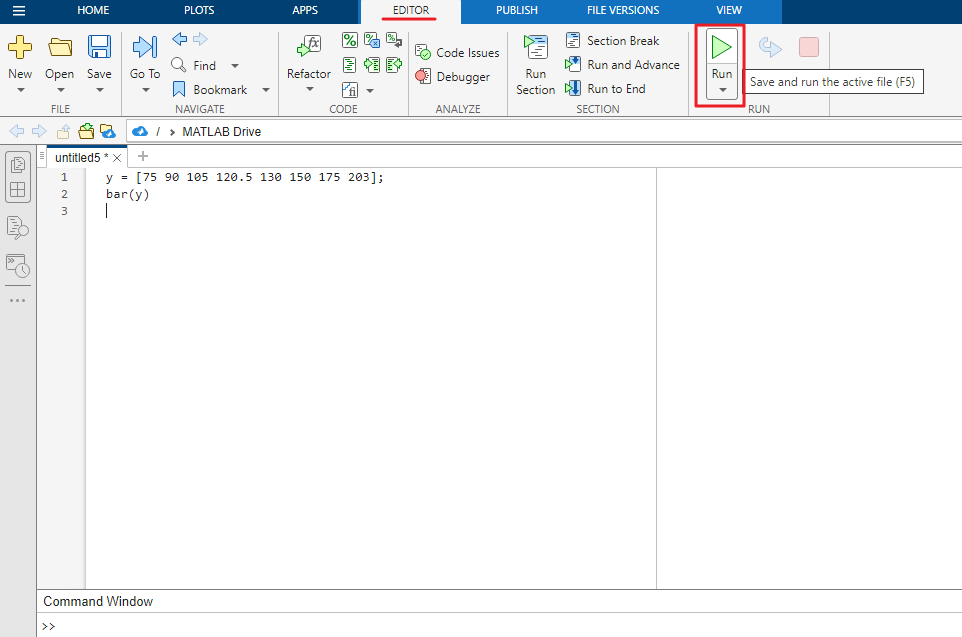
3. Click on the Run option under the Editor section to run the code and plot the bar chart based on these data.
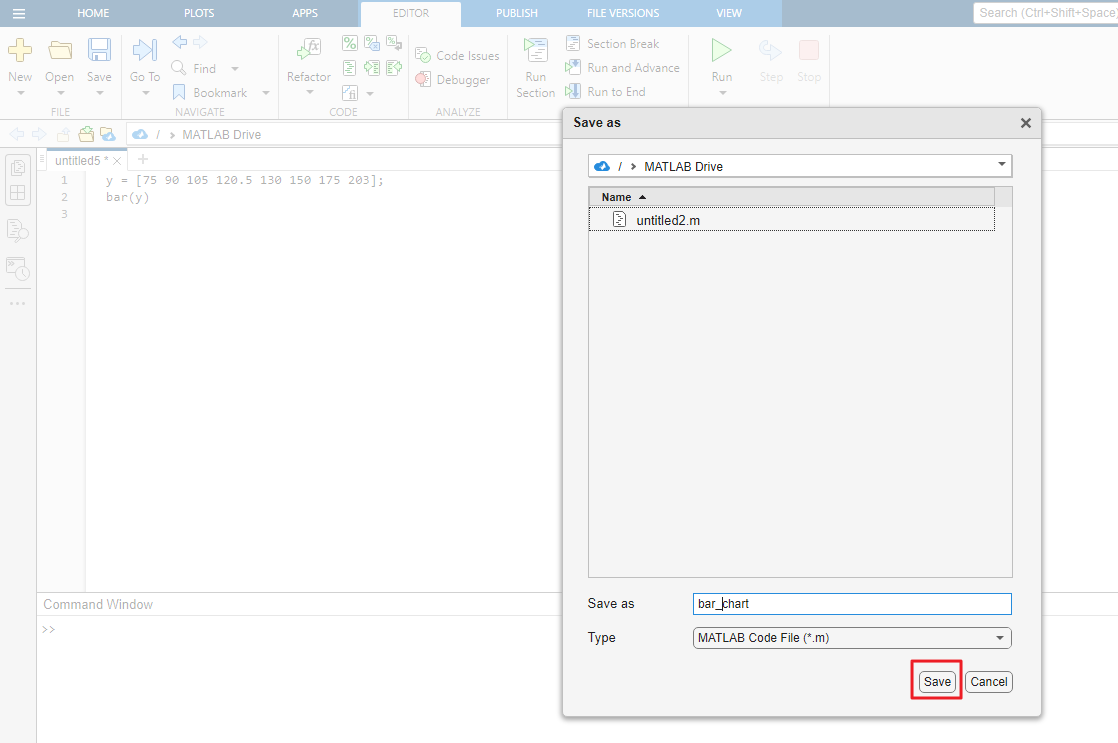
4. You will be asked to save your code in a MATLAB file before executing your code. Mention a file name and click on the Save option.
5. MATLAB will run your code and plot the corresponding bar chart in the Figure window.
You can change the data and click the Run button to refresh the bar chart with the modified data.
Part II. Make Easier and Faster Bar Charts With Wondershare EdrawMax
Wondershare EdrawMax is a powerful alternative to Metlab when creating bar charts and other diagrams. This versatile software offers a seamless interface with drag-and-drop functionality. The platform's features and advantages empower you to easily craft stunning visuals.
Key Features
With EdrawMax, you simplify the process of creating bar charts and unlock a world of possibilities for diagramming and data visualization. Below are its key highlights.
- Edraw AI. With the innovative Edraw AI feature, you can analyze various kinds of charts like bar charts with a single click or generate a flowchart or a mind map in no time.
- Ready-Made Templates. EdrawMax provides an extensive collection of ready-made templates. Whether you're looking for bar charts, doughnut charts, org charts, or other diagrams, EdrawMax has it all.
- 280+ Types of Diagrams. EdrawMax is not limited to just basic charts. It offers over 280 types of diagrams, making it an all-in-one diagramming solution.
- Multi-Format Compatibility. EdrawMax allows you to export your creations in various formats. You can export to PDF, Word, Excel, and more. EdrawMax ensures seamless integration with your existing documents and presentations.
Main Advantages of Using a Dedicated Diagramming Tool
If you're still on the fence about using Matlab for charts or an app, here are some advantages of using a dedicated diagramming tool.
Available Online and Offline
EdrawMax offers the flexibility of both online and offline usage. You can access the platform online through a web browser. It allows collaborative work and access from anywhere with an internet connection. The tool also provides an offline desktop version. This dual accessibility caters to different connectivity situations.
Available for Free
EdrawMax offers a free version. The tool is accessible to students, small businesses, and individuals looking to create professional diagrams and charts without a significant financial commitment. The free version doesn't compromise on essential features. It's a great starting point for users exploring the platform's capabilities.
IconFont and Pixabay Integration
EdrawMax's integration with IconFont and Pixabay significantly enhances its capabilities. You can access a vast library of icons and images to incorporate into their diagrams and charts. The integration simplifies the process of finding relevant visuals. It also enhances the visual appeal and informativeness of the diagrams.
How To Create a Bar Chart Using EdrawMax
To show you how simple creating a bar chart with EdrawMax is, follow the step-by-step instructions below.
Step1A
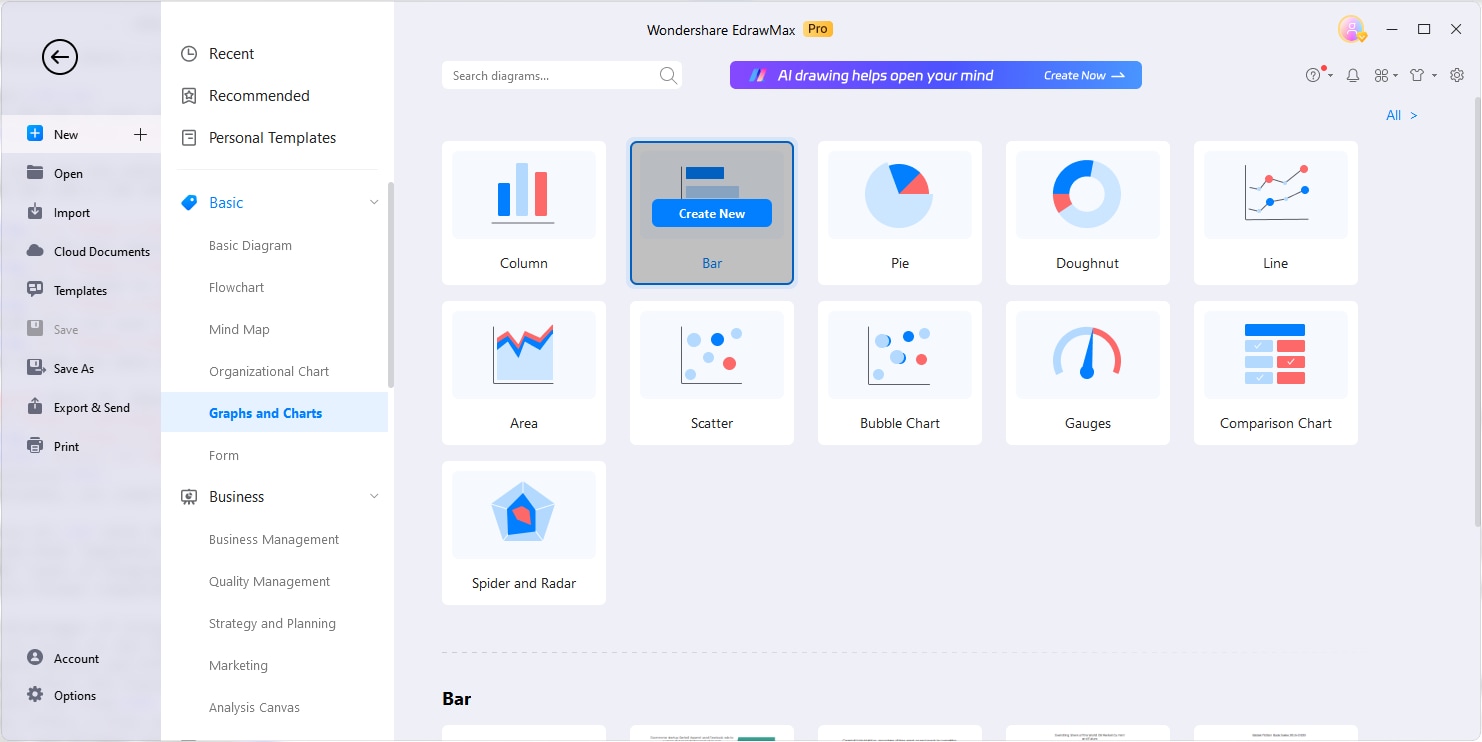
Download and Install EdrawMax on your computer and launch the app. Click New > Graphs and Charts > Bar to create a bar chart from scratch.
Step1B
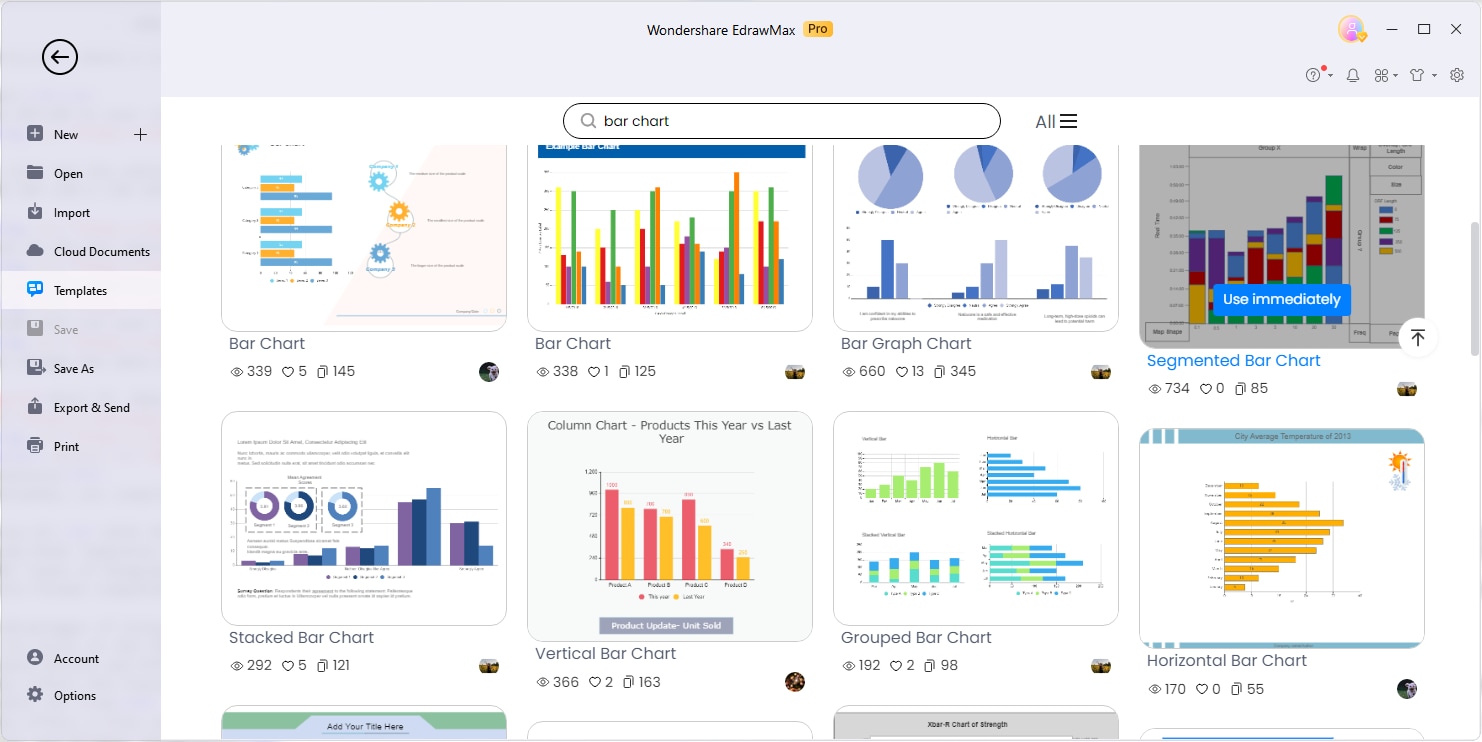
You can start with a pre-made template to generate a bar chart in one click. Click Templates and use the Search Bar to look for templates that suit your preferences.
Step2
Use the drag-and-drop interface to add and customize your bar chart elements. Adjust the size, labels, colors, and values to represent your data. EdrawMax offers various formatting options to make your chart visually appealing and informative.

Step3
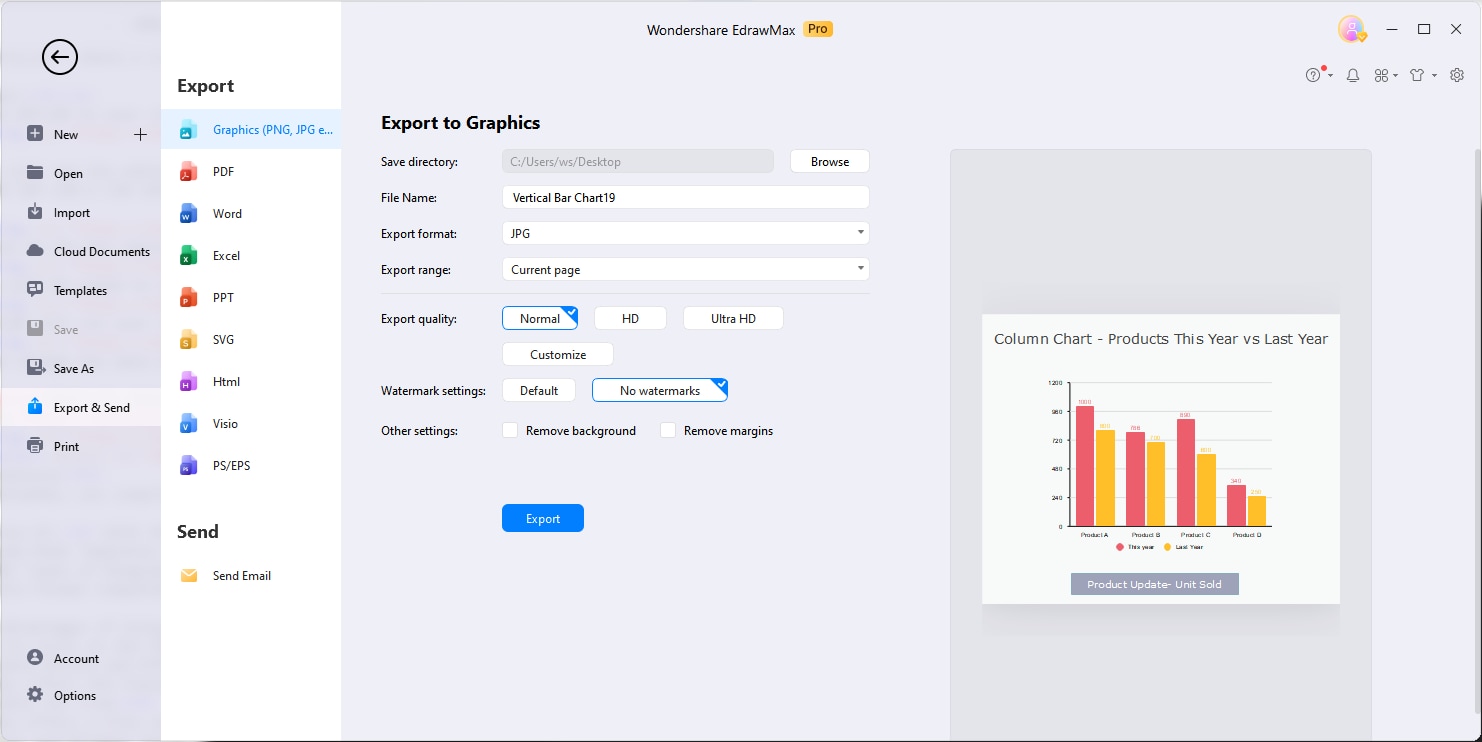
Once your bar chart is ready, save your work to your preferred location on your computer. Depending on your presentation or sharing needs, you can also export it in different formats like PNG, JPG, or PDF.
Conclusion
Creating bar charts in Metlab is an efficient way to visualize data. However, using Metlab as your diagram maker poses its limitations. Using EdrawMax as an alternative can benefit those seeking flexibility and ease of use.
The diagram diagramming tool empowers you to create stunning charts in one click. It offers a seamless experience for chart creation. So, take your data presentations to the next level and give it a try today.

