


Gantt charts are the perfect tools to track and monitor the progress of a project. It turns text and data into charts for a visual timeline.
By simply looking at the Gantt chart, we can easily analyze the progress and potential risks of the project in seconds. Meanwhile, we can add new tasks to the chart and inform everybody in the team of the update.
In today's article, let's go through everything about the Gantt chart. We will start by defining the Gantt chart, and then proceed with its history and benefits. For those who want to create a project schedule, we will learn how to make a Gantt chart and do a Gantt analysis.
In this article
- What Is Gantt Chart
- Gantt Chart Description: Enhancing Understanding and Communication
- Gantt Chart Detection: Ensuring Accuracy and Compliance
- Gantt Chart Optimization: Streamlining Project Planning and Execution
- Future Trends and Considerations
- The Application of AI in Gantt Chart Generation
- Conclusion
Part I. What Is Gantt Chart
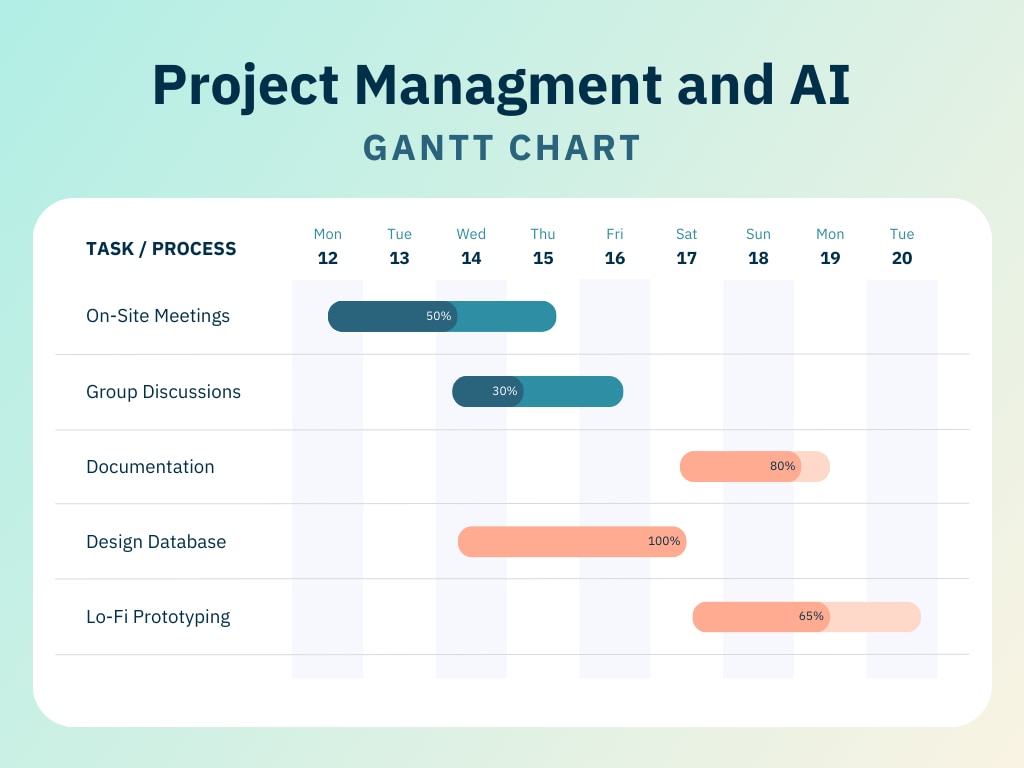
A Gantt chart is a kind of bar chart combined with other elements like timeline (start and end dates) and tasks.
Cases in point:
We use horizontal bars to represent the duration of each task. The length and position of each bar indicate the start date, duration, and end date of the task.
Gantt charts are widely used for scheduling, planning, and executing projects. Project managers and team leads use them to define goals, track progress, and visualize dependencies.
What Is Gantt Analysis and Why Do We Need It
Most people will confuse Gantt charts and Gantt chart analysis. They may think they're the same thing. Of course not, Gantt charts are the visual scheduling charts for project management. Gantt analysis is the process of evaluating the Gantt chart.
Define time and goals:
We need to know that a Gantt chart made by your team can be unreasonable. For instance, you need to consider holidays, weekends, and other vacations within the task duration. You'd better not just throw out a random time limit for a task that may not be achieved.
Track progress:
How's the project going? Nearly done and just beginning? The Gantt chart will tell you with the bars easily.
Visualize dependencies:
Also, when a project is in trouble, we need to know why it's getting on hold or delayed. Maybe there's a task slowing down the whole project, check on the Gantt chart and you will find out the answer.
The above three are included in one general process: Gantt chart analysis. By doing so, you can tell if a Gantt chart is properly set before the project is set. And also, the analysis helps us keep track of every detail of the project.
Part II. Gantt Chart Description: Enhancing Understanding and Communication
Interpreting a Gantt chart is as challenging as creating it manually. Even an average chart has numerous tasks, activities, and milestones that confuse the human mind. Thus, reading the project timeline in between the cluttered data becomes hard.
But intelligent systems like EdrawMax AI have made it much more efficient. It leverages NLP Natural Processing Language and deep learning to read the content of the Gantt charts. With this technology, you can even grasp extensive charts with valuable insights a human brain can easily skip.
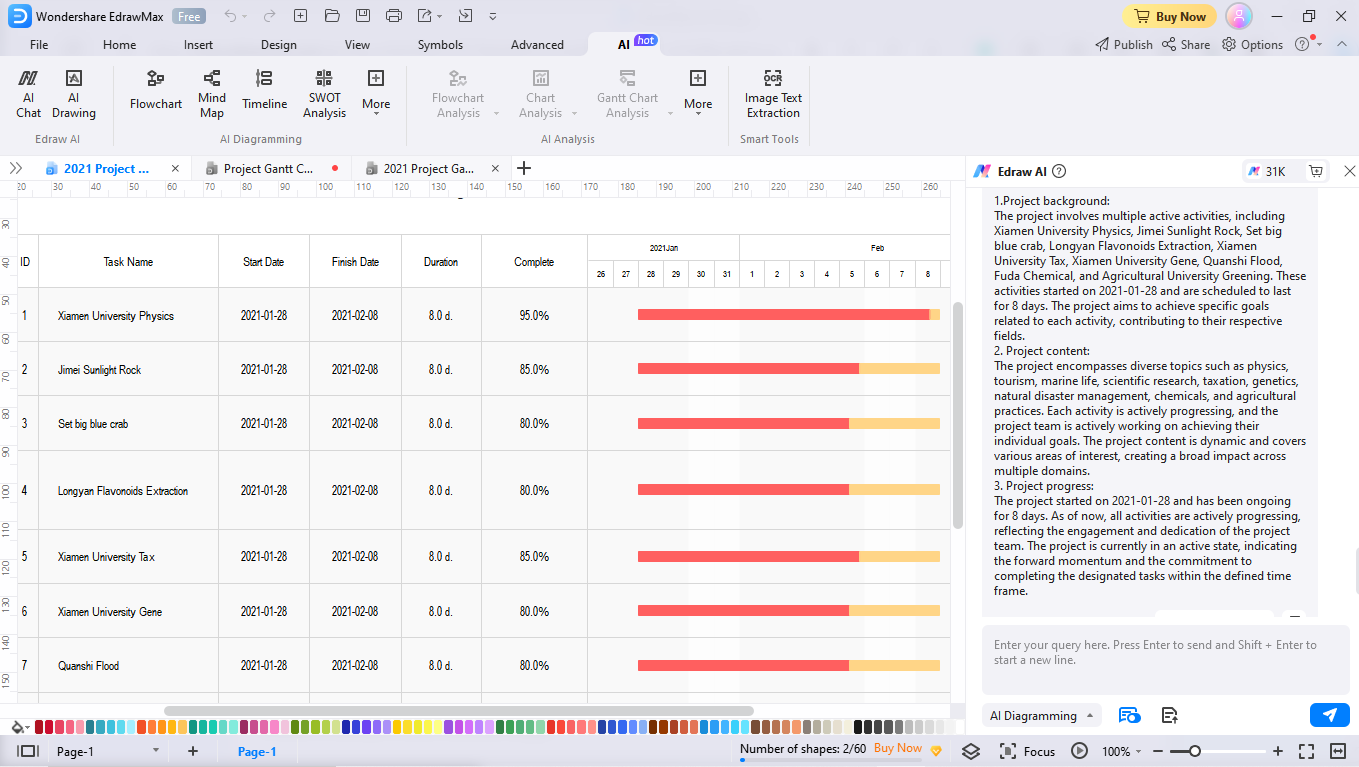
Let us see this example. This Gantt chart shows an inter-institutional project timeline. EdrawMax Gantt chart analysis provides an insight into the project's background, its contents, and progress.
- Project Background: It describes the duration of the chart and its starting and ending dates. You can also read the goals of each activity in the chart, giving you a clear idea about the project’s outlook.
- Project Content: It further digs deeper and explains the content of each activity. The progress recording algorithms further give information on how each team is progressing toward activity completion across multiple categories.
- Project Progress: It records the progress made up until the last modification in the chart. This provides us with a rough time frame expectation to meet the deadlines.
Advantages
Following are some advantages of using intelligent systems for reading Gantt Charts.
- Clarity: AI interpretation of Gantt charts has incomparable accuracy. It gives us valuable insights into the topic contents, background, and intentions, so everything is clear from the get-go.
- Discussions: It records the project’s progress with every modification in the chart. This helps teams communicate realistic deadlines and adopt solution-oriented strategies.
Part III: Gantt Chart Detection: Ensuring Accuracy and Compliance
The sheer size of big commercial projects translates into difficulty for humans to identify bottlenecks. Having scattered data all over the horizontal bars makes it hard to identify critical paths, allocate the right resources, and complete the tasks within the due time.
Therefore successful companies use AI tools like EdrawMax Gantt Chart Analysis. Such tools are an excellent alternative to eliminate the extensive admin tasks. They use complex algorithms for risk identification and analyze multiple tasks, find critical paths, and recognize the potential challenges that may occur during implementation.
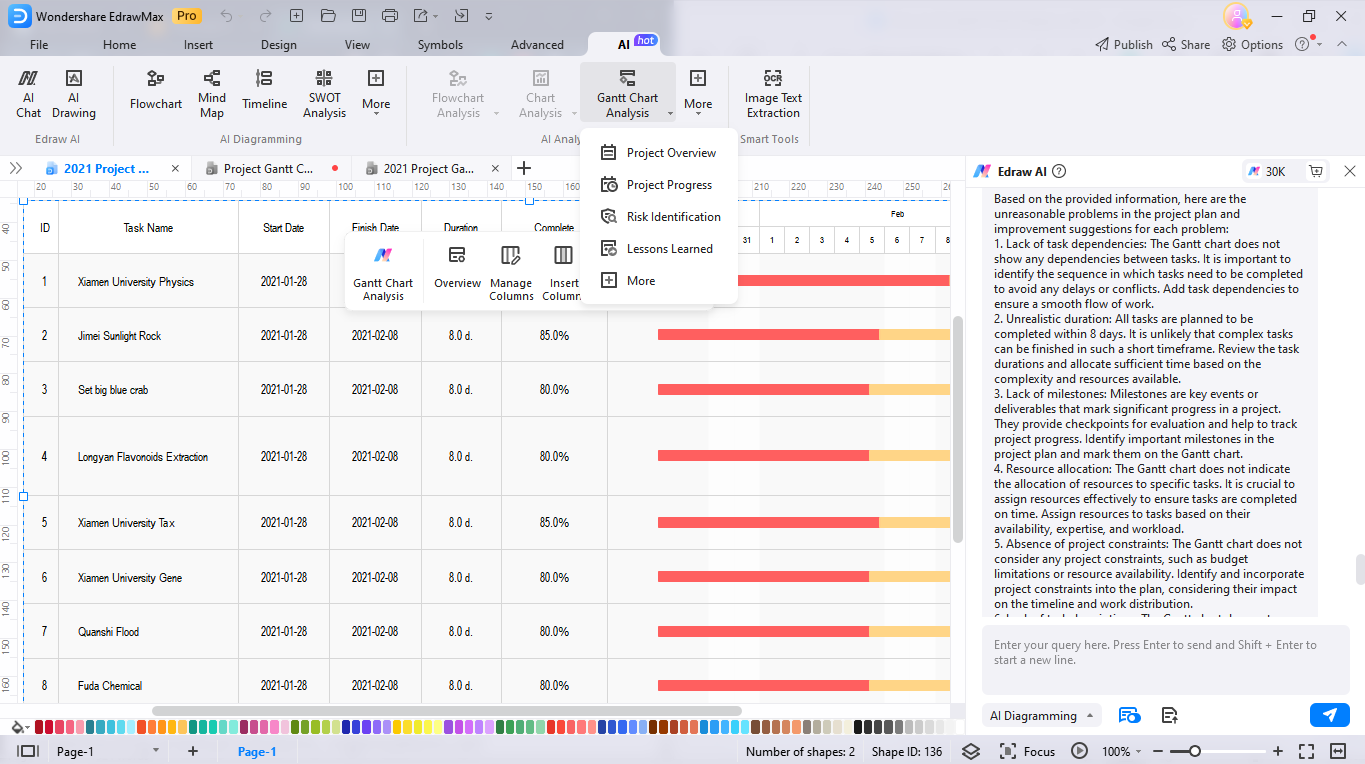
Let us further extend the example we discussed earlier. We will explore some bottlenecks in the edited Gantt chart using EdrawMax risk identification analytics algorithms.
- Lack of Dependencies: There are no detailed dependencies between the tasks. It can affect the workflow in the long term.
- Unrealistic Duration: According to the chart, the tasks need to be completed in eight days. However, it is not practical for complex tasks. It interrupts the execution and delays the defined durations.
- No Project Constraints: The following chart has no mention of constraints like budget, resources, and work distribution.
Advantages
Here are the benefits of using artificial intelligence in identifying risks within the project timeline.
- No Operational Errors: It identifies deeper risks and bottlenecks, preventing any operational mistakes during implementation.
- Better Resource Allocation: Using AI risk identification helps you better allocate resources in the right places. It helps teams find critical paths and completes the tasks in half the time.
Part IV. Gantt Chart Optimization: Streamlining Project Planning and Execution
Planning the tasks in the Gantt chart is even more painful than creating one. However, having a chart with defined goals and manageable tasks is critical for successful project planning.
Of all of the perks it has, AI systems like EdrawMax have made it faster to optimize Gantt chart planning and execution, which would otherwise take an eternity. Once the potential faults are traced in the timeline, it helps teams improve. They predict durations, define constraints, and find critical paths more effectively. It eventually makes the implementation of massive projects effective.
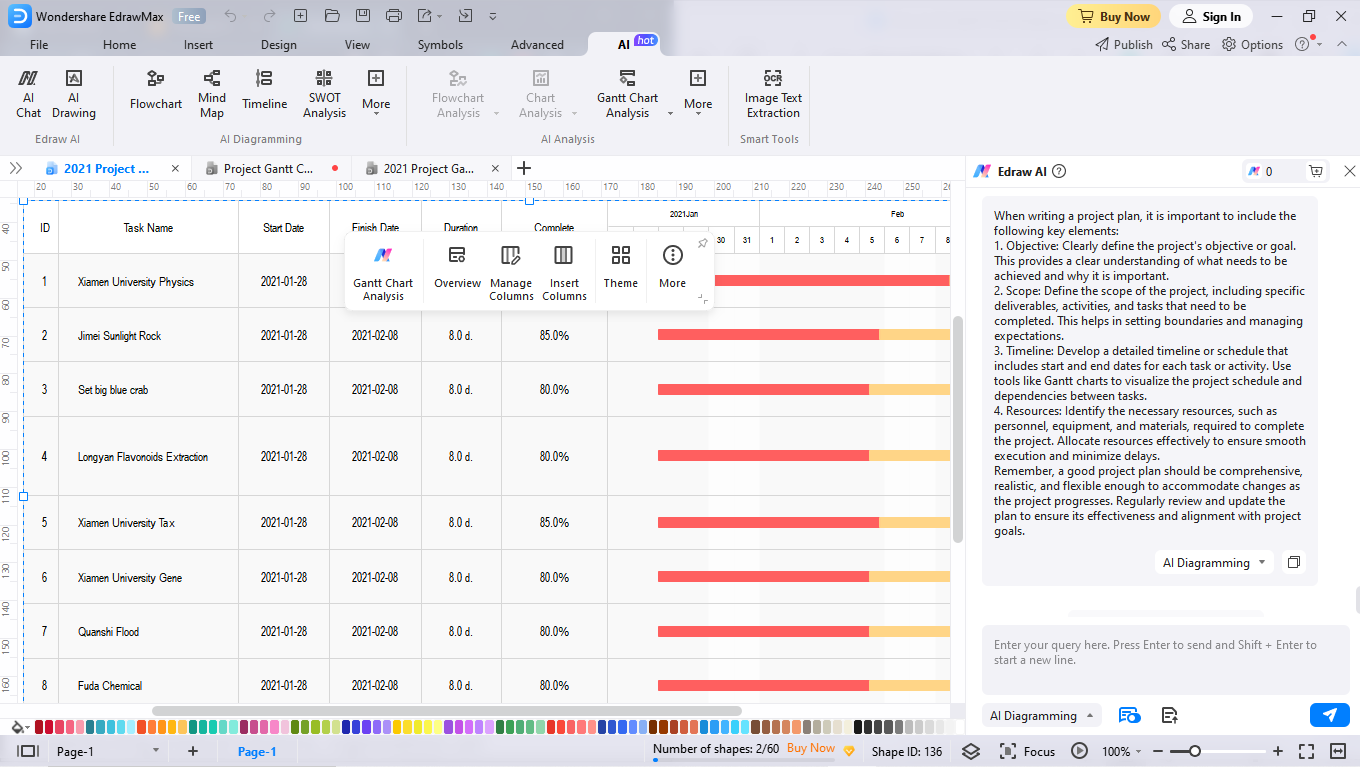
Let us extend the example through the EdrawMax Gantt Chart Lesson Learned algorithm. Here are some insights it offered to help streamline the execution.
- It evaluates each activity in the timeline against the defined deadlines.
- In the second activity, it advises the team to improve the research sector.
- It also gives insight into how to use the right resources during planning and execution.
Advantages
Here are some benefits you get with the EdrawMax AI Lesson Learned algorithm.
- Productivity: Proper Gantt chart planning allows teams to focus on solution-oriented techniques. This eliminates the need for labor-intensive tasks and streamline workflow effectively.
- Time Management: Once everything is ideally planned in the Gantt chart, the implementation goes smoothly. Teams can put more effort into high-priority, complex tasks, making the right use of time.
Part V. Future Trends and Considerations
AI has given a competitive advantage to companies specializing in project management. It improves team productivity, time management, and decision-making. Now, you can use natural learning processing technology to prepare and execute projects in no time. Here is a breakdown of future trends and limitations companies must consider for favorable gains.
Benefits
- AI tools make it quick to track project progress using milestones, time leads, and performance indicators.
- AI advances in interpreting and responding to natural queries that may arise during project planning.
- Modern AI tools analyze a large database of market trends on the Internet. It gives you an in-depth analysis of potential risks during project execution.
Limitations
- Handling confidential and private project data on AI tools can result in data security breaches. Thus, it calls for an appropriate system for data protection and privacy.
- AI is trained on limited languages and historical databases. This data may have some existing biases to interfere with decision-making.
- It lacks human intuition and creative ability to innovate and generate ideas. Hence, the wise way out is a collaboration between AI and team members.
Part VI. The Application of AI in Gantt Chart Generation
Project management starts with preparation and scheduling. Therefore, modern AI tools are focusing on the diagramming sector, like Gantt chart analysis, flow charts, and more. However, not all systems are intelligent and accurate enough to optimize the schedules and define project scope.
For the best results, try out the EdrawMax AI. It is the first choice of developers, educators, managers, and team leads due to its user-friendly interface.
The pre-scenario AI, chatbot, and OCR text extraction help you streamline Gantt charts and track progress. So, updating information, allocating resources, and tracking progress is a no-time job with this tool.
It also promotes team understanding through in-diagram comments and historical revisions. Moreover, you can say goodbye to the manual admin work by creating lengthy reports with image-to-text generation in no time.
Conclusion
AI has immense unexplored potential in project management. It streamlines your projects by boosting productivity, achieving milestones, and preventing risks. It generates data-driven insights to help you stay ahead of your project planning, scheduling, and execution game.
That said, it is still limited in the security and innovation sector. Therefore, it only makes sense when used intelligently and combined with human input and experience. So, while scouting for the right AI tool, you must look into the scope of your judgment.
AI Diagram Generator
Enter your prompt. Upload files if needed. Generate diagrams, charts, or slides instantly.


