


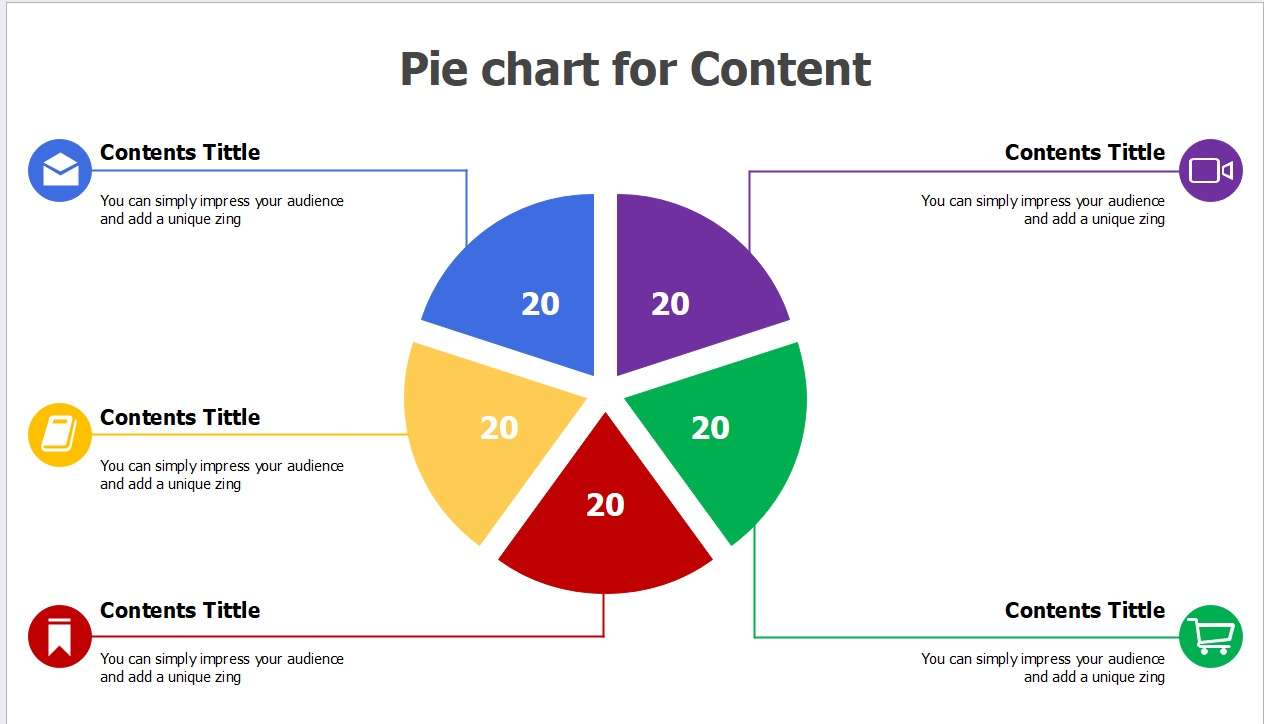
Excel is a popular tool used for pie charts due to its familiarity. Pie charts are essential visual tools used to represent data distribution in a circular format. They find applications across various fields, from business to education and more.
If you're looking for an alternative, a more powerful and professional diagram makers, consider giving a try for free. With over 15,000 templates in total, you can easily get started whether as a pro or a beginner;
In this article
Part 1. How To Use Excel To Create Pie Charts
In this section, you will learn how to make pie charts in Excel for clear data visualization. Follow the step-by-step procedure below for crafting informative pie charts.
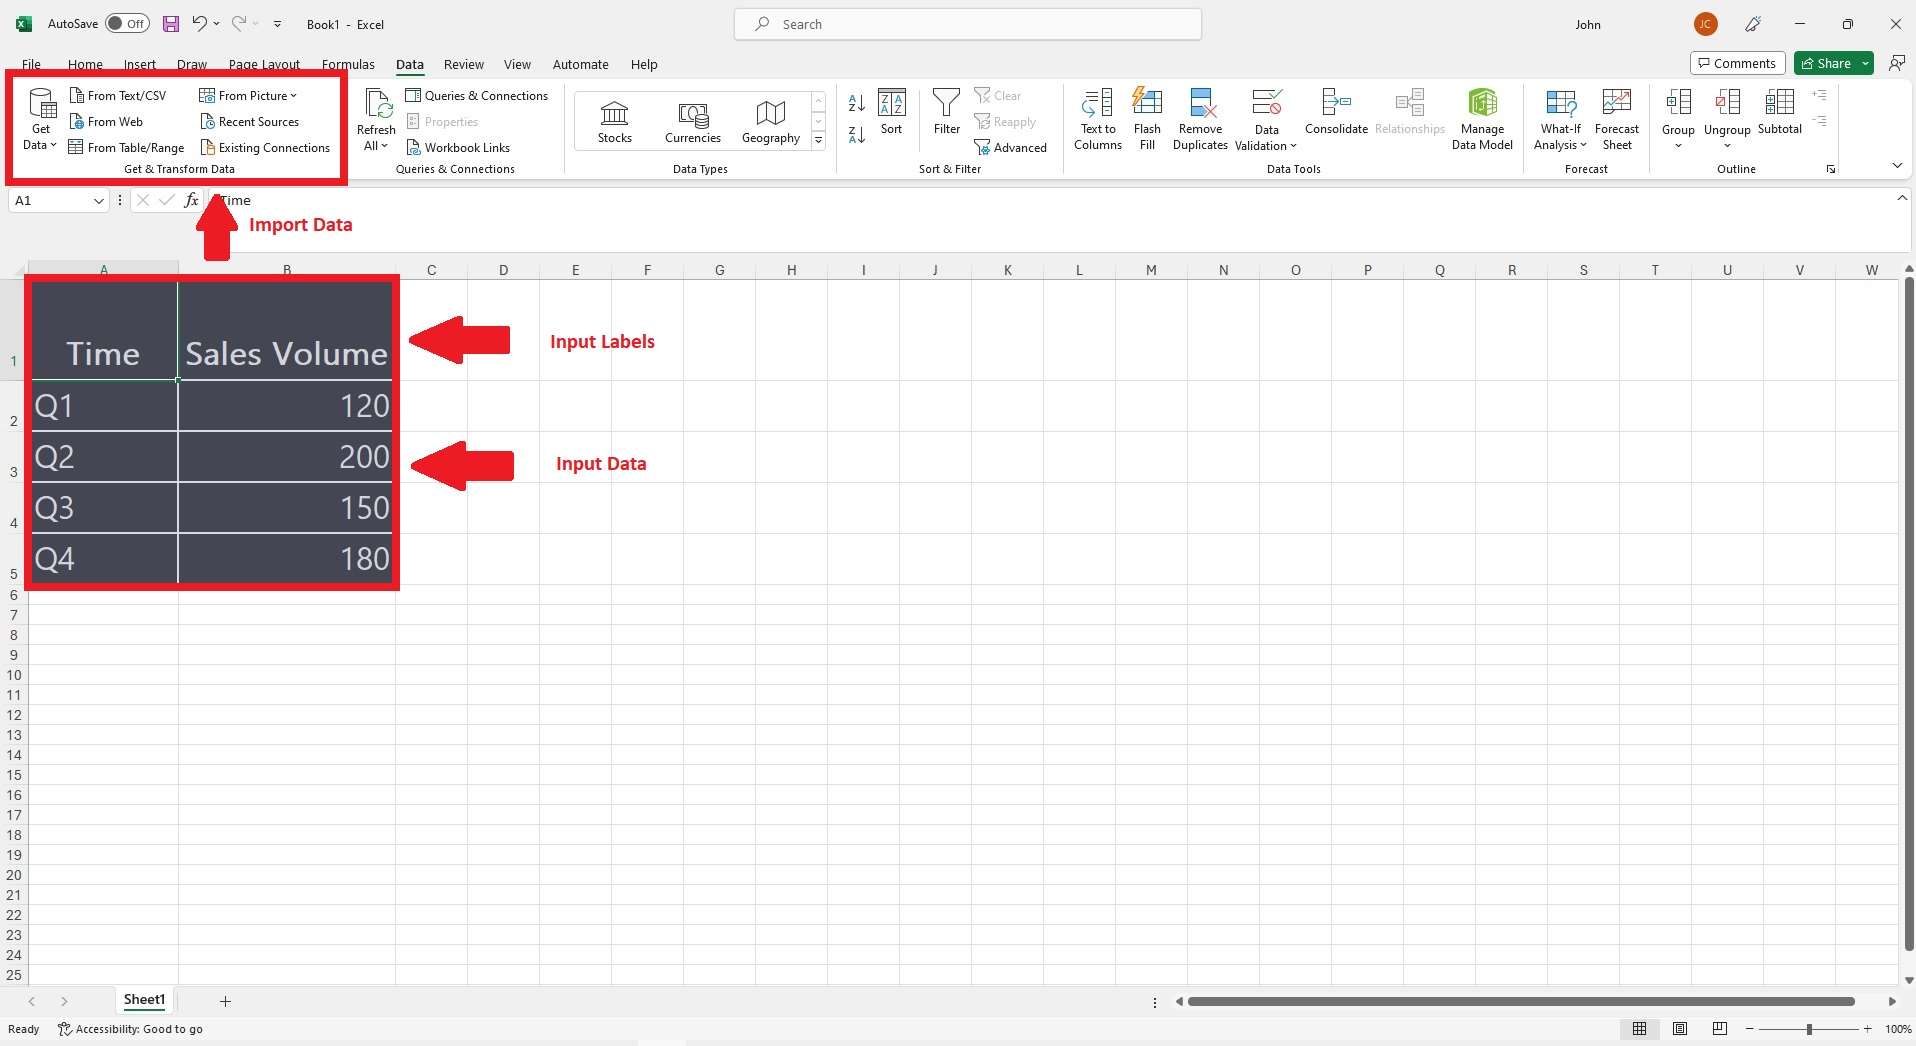
Step 1: To begin, launch Excel and open a fresh worksheet. Input labels and data pertinent to the upcoming pie chart. In the illustration below, we've entered time and sales volume data into the worksheet.
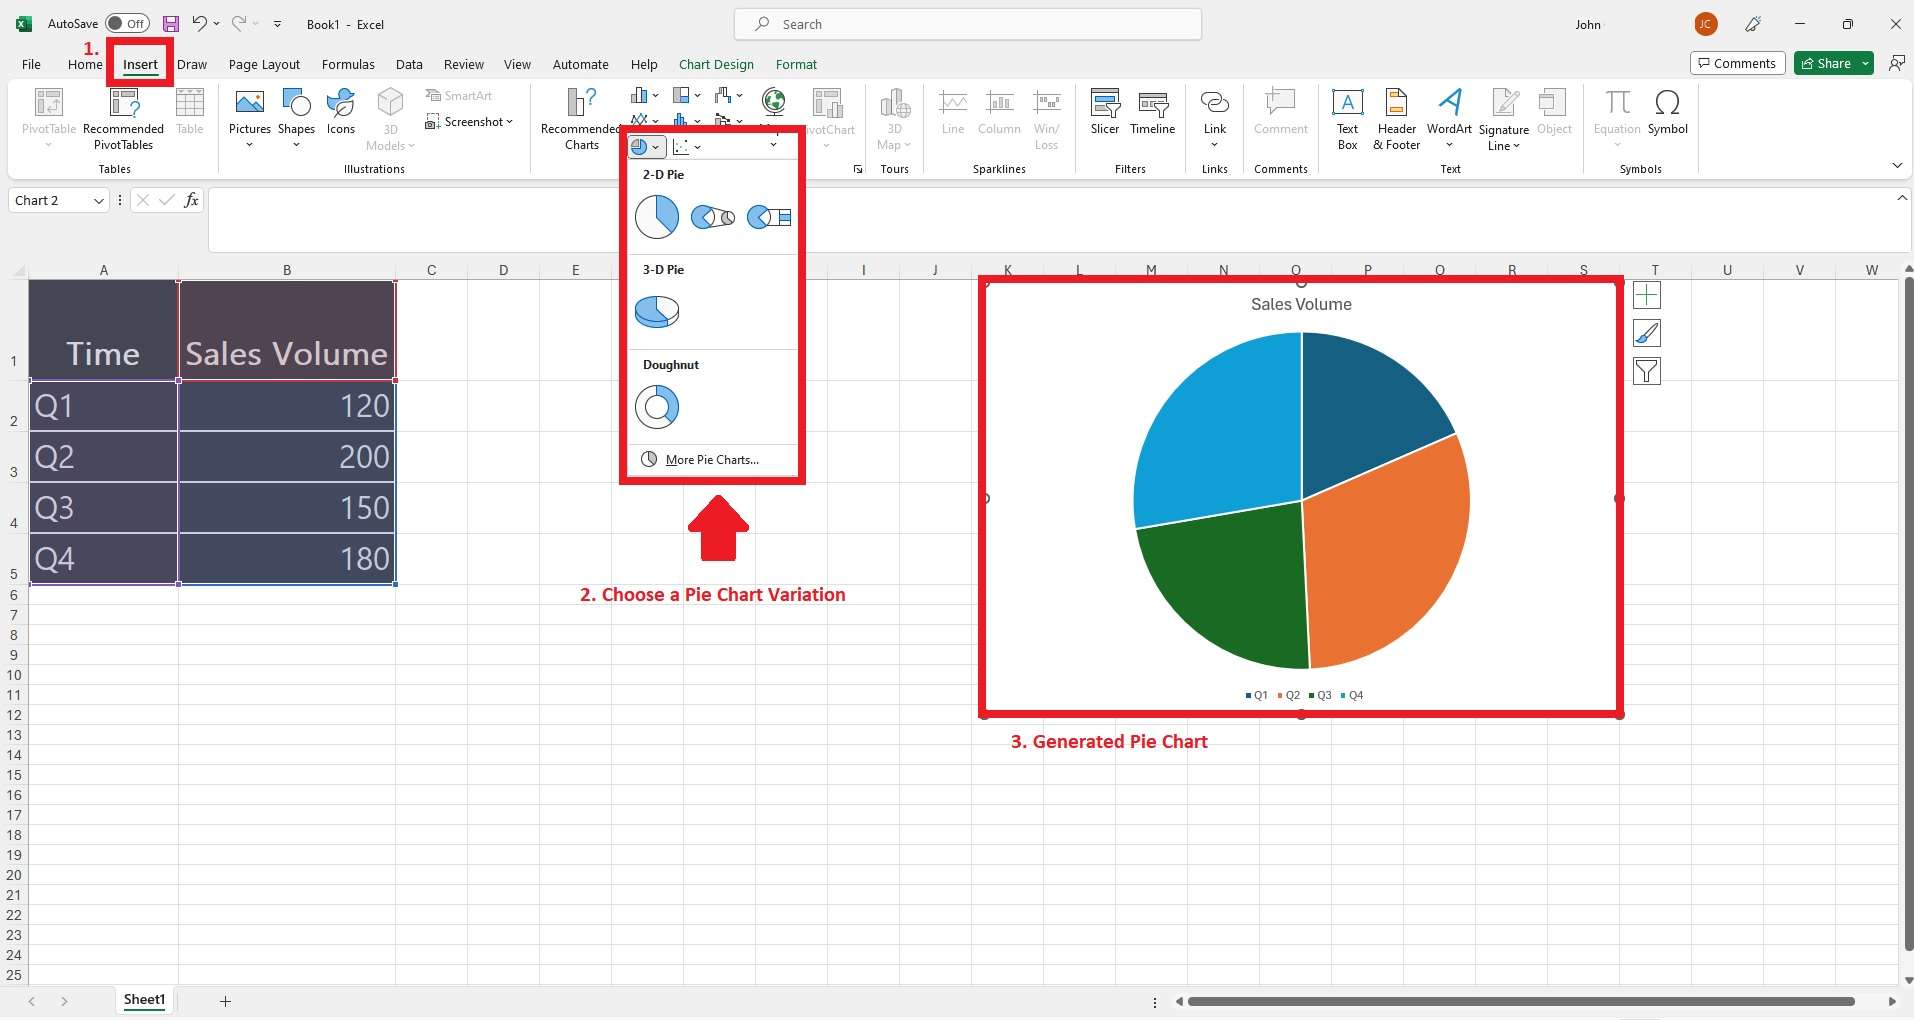
Step 2: Highlight the desired range on the worksheet.
- Move to the Insert tab, spot the Charts group on the ribbon, and click the pie icon. This will unveil a dropdown menu, granting access to various pie chart options.
- Hover over the chart thumbnails to preview diverse pie chart variations. Click the 2-D Pie Chart for basic pie charts, pie of pie, and bar of pie configurations. Choose 3-D Pie Charts and Doughnut Charts if you want other ways to visualize your data.
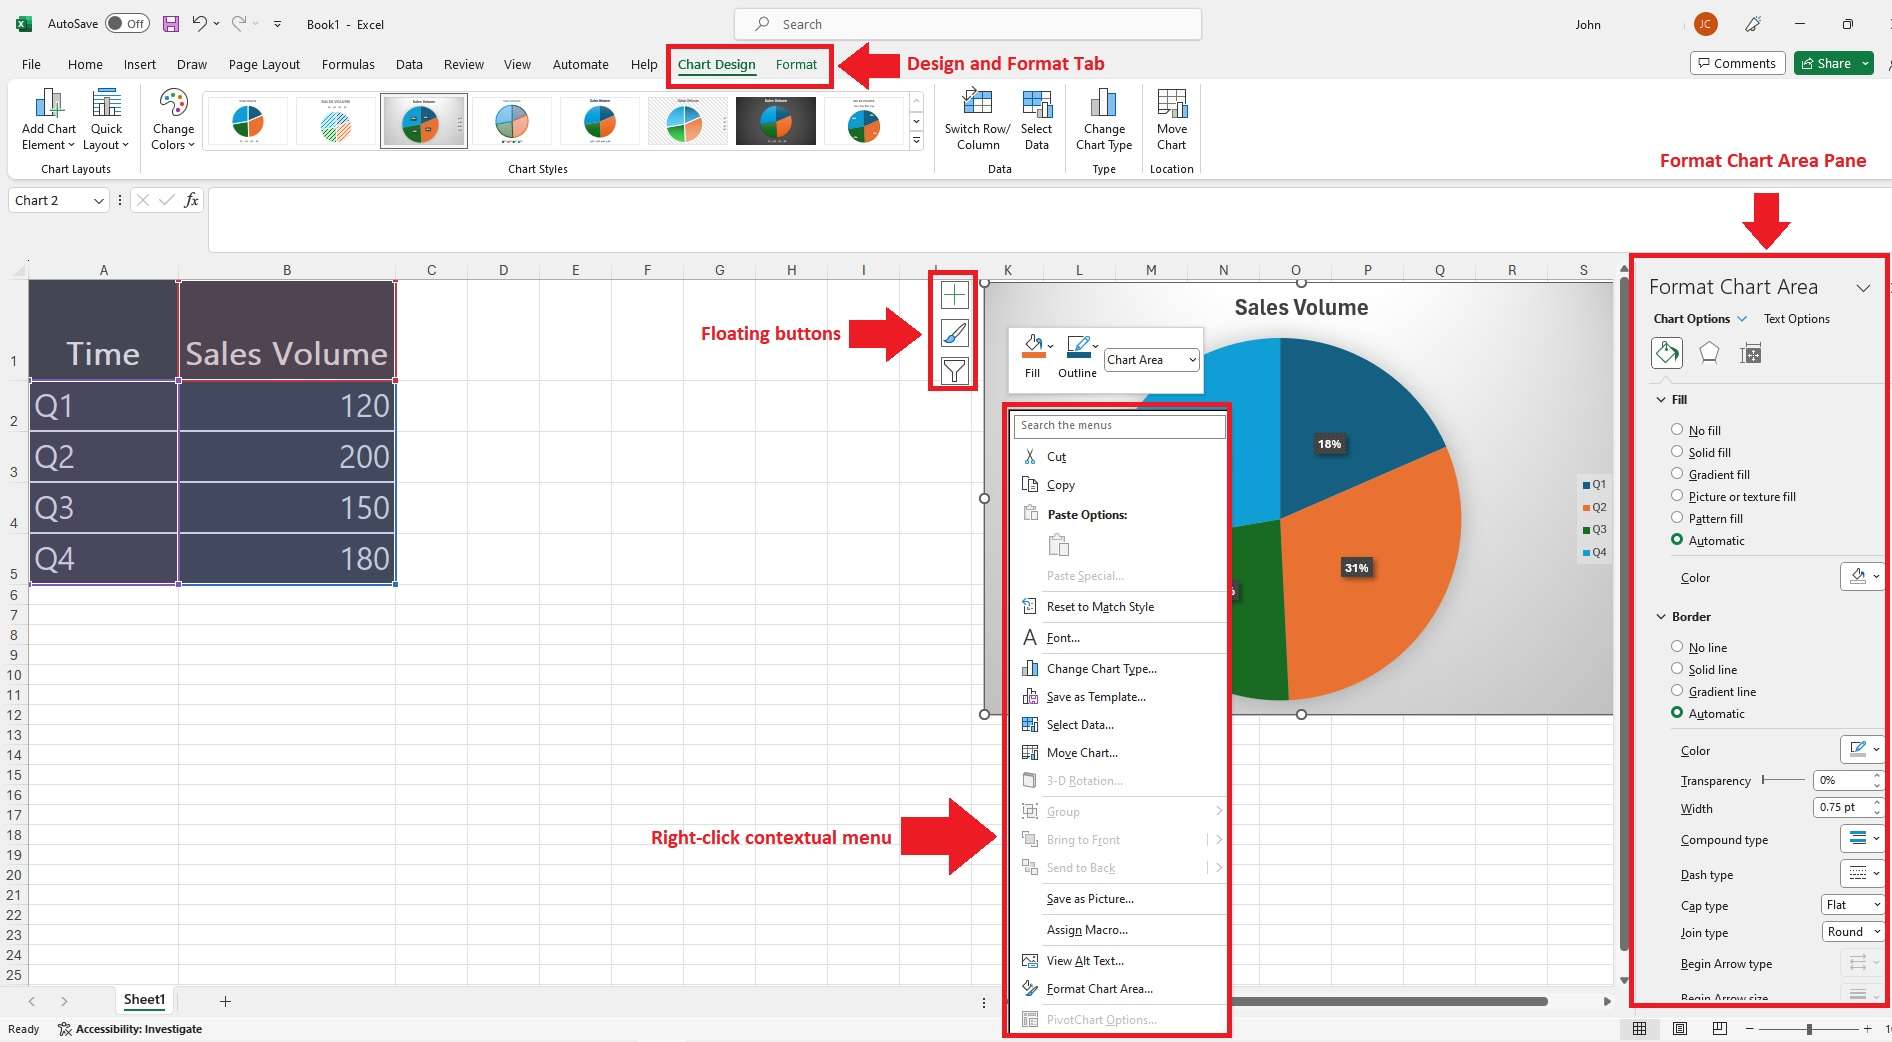
Step 3: Incorporate elements in your pie chart.
- Include axis titles, data labels, gridlines, or trendlines. Adjust the color schemes as well.
- Use an array of formatting tools in the Design tab, Format tab, Format Chart Area pane, floating buttons, and the right-click contextual menu.
Step 4: Click the pie chart if you want to move it someplace else.
- Utilize the Move Chart button found on the Design tab or by right-clicking the Chart Area.
- The Move Chart window will appear, prompting you to specify the new placement for your pie chart.
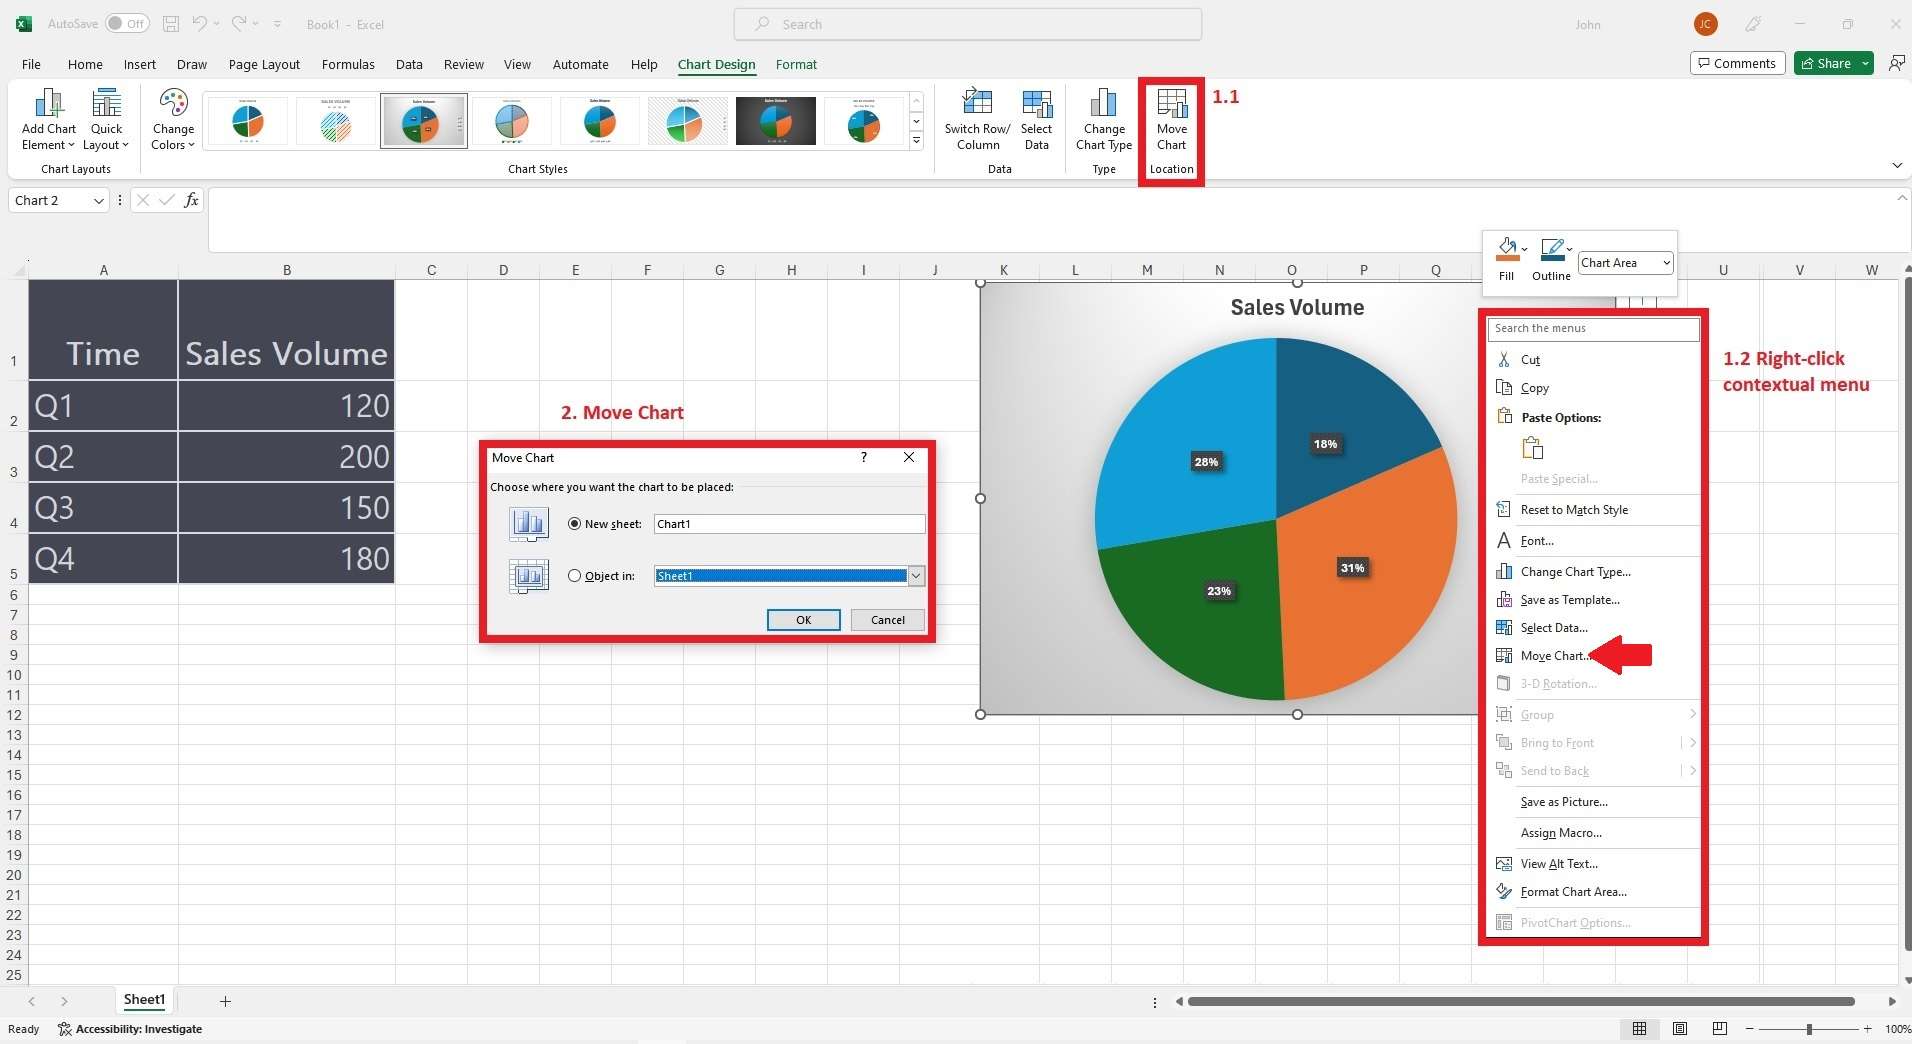
- Choosing New sheet relocates the pie chart to a fresh sheet.
- Choosing Object in enables the movement of the pie chart to a different worksheet of your choosing.
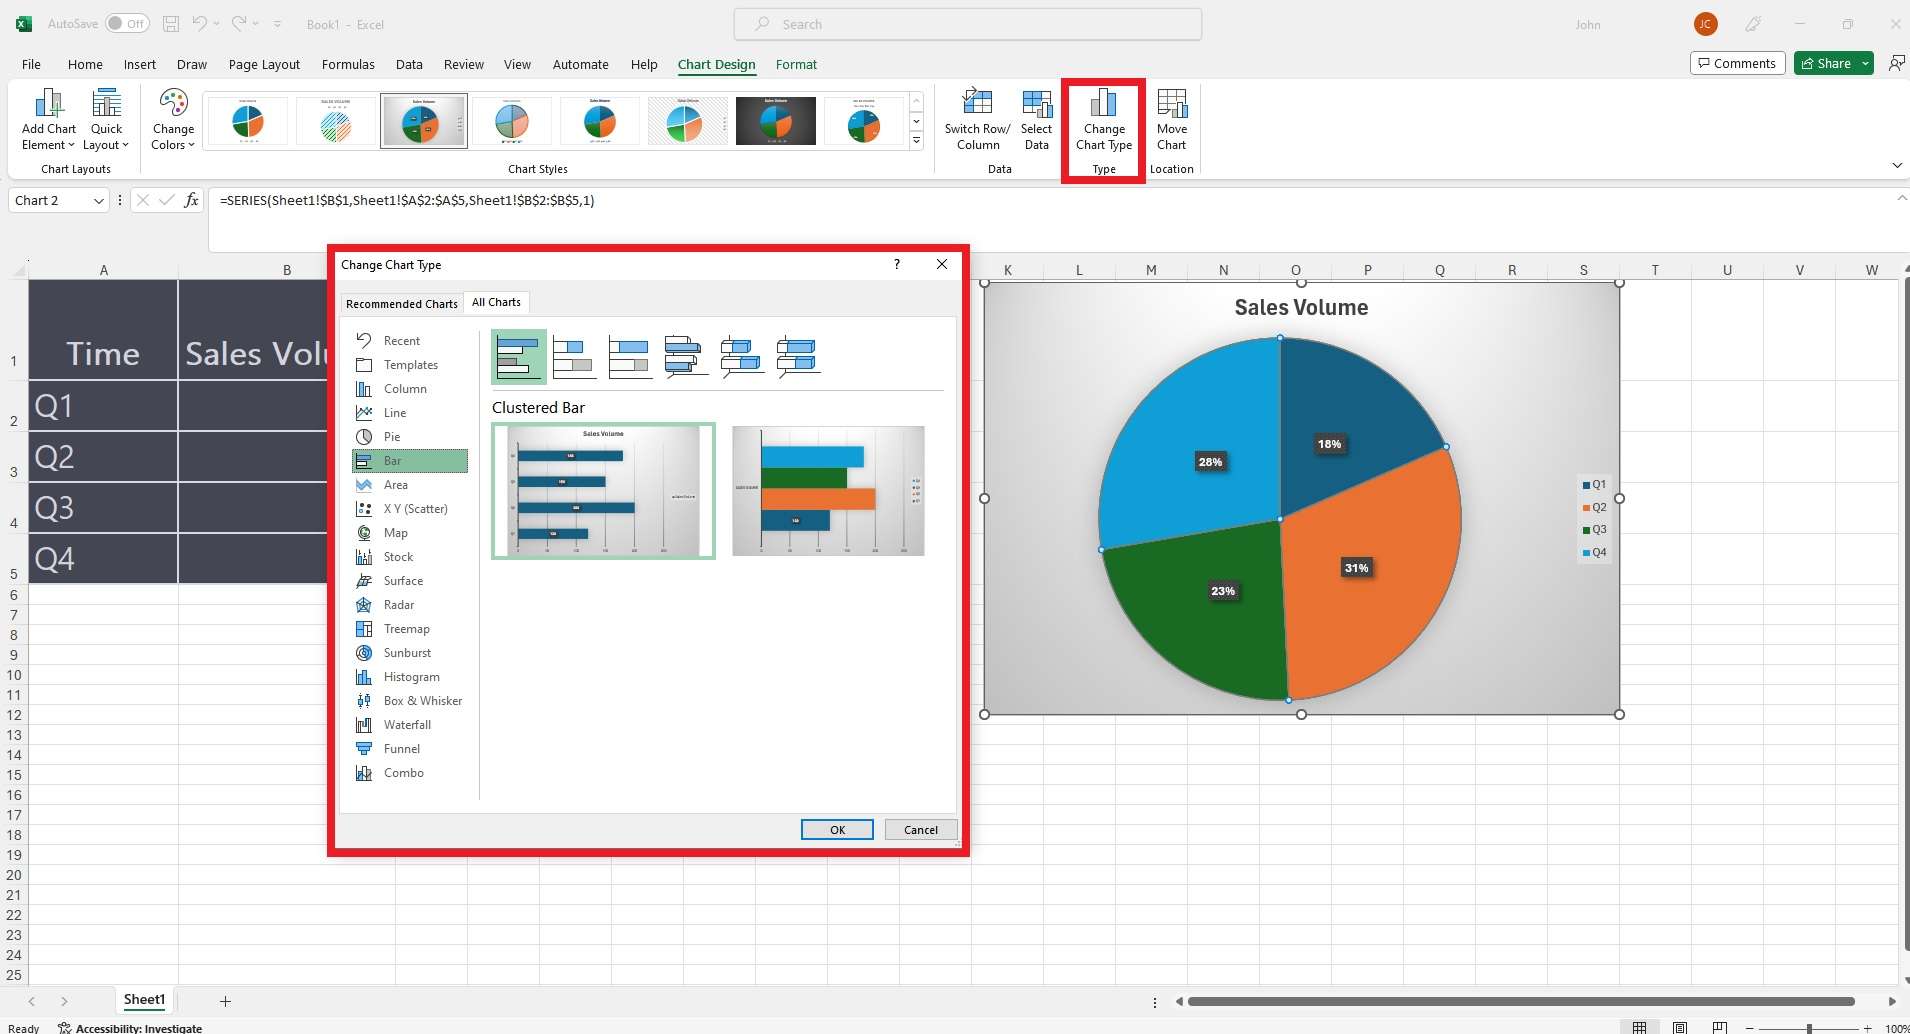
Step 5 (Optional ): Use alternative data visualizations depending on your preference.
- Click the Change Chart Type button on the Design tab or within the Chart Area's contextual menu.
- Choose a different type and confirm the change by clicking OK.
Part 2.Why EdrawMax Is the Ideal Tool for Presentations
Creating pie charts in Excel is ideal for basic data interpretation. If you're charting complex data, however, it can sometimes have drawbacks if the pie chart is labeled incorrectly. Hence, if you're looking for a professional alternative, then consider EdrawMax.
EdrawMax is one of the best alternative pie chart creation tools available today. The platform caters to beginners and experts alike, even if it's your first time using the software. You can design and modify pie charts in seconds.
Key Features
EdrawMax is your go-to choice for crafting impeccable pie charts with ease. Below are its key features.
- Comprehensive Pie Chart Creation. EdrawMax offers a robust suite of tools for creating intricate and informative pie charts. It caters to a wide array of data visualization needs.
- Ease-of-Use. EdrawMax uses an intuitive interface and drag-and-drop functionality. Along with its user-friendly tools, EdrawMax ensures a seamless experience for beginners and experienced users.
- Compatibility with various platform. EdrawMax provides the flexibility to work on the web and various devices including Windows, Linux, MacOS, and mobile platforms.. It enables you to create, edit, and access your work anytime and anywhere.
- File Format Compatibility. EdrawMax supports various file formats, including Excel-compatible formats. The versatility in compatibility facilitates smooth collaboration and sharing.
Pricing
EdrawMax offers three flexible pricing options designed to match your budget (as of Sept.4, 2023):
- Semi-Annual Plan. Priced at $69.00, billed every 6 months. Ideal for cost-conscious users.
- Annual Plan. At $99.00 per year, the Annual Plan provides excellent value for consistent EdrawMax usage.
- Perpetual Plan. Obtain lifelong access with a one-time payment of $198 through the Perpetual Plan.
The Benefits of Using EdrawMax for Pie Charts
Here are three reasons why you should use EdrawMax over Excel for creating pie charts.
Enhanced Efficiency
EdrawMax's streamlined workflow enables you to create intricate pie charts up to 5 times faster than Excel. This efficiency boost is valuable when dealing with large datasets or time-sensitive projects. Having a tool that saves you time empowers you to complete tasks while ensuring precision and quality.
Optimized Interface
EdrawMax's interface is tailored for creating perfect pie chart designs. The tool offers a cohesive and intuitive environment for creatives. This specificity ensures you have access to the necessary tools and functions. The interface reduces unnecessary complexity and boosts productivity in crafting appealing pie charts.
Rapid Styling Flexibility
EdrawMax empowers you to experiment with various chart styles with ease. It gives you the power to change colors, labels, and other design elements quickly. This skill is useful when fine-tuning your visualization to match specific branding or presentation requirements. The flexibility saves you time compared to Excel's sometimes intricate styling process.
Part 3.Create Well-Designed Pie Charts With EdrawMax
Creating a pie chart using EdrawMax is a simple procedure. This section explores utilizing the platform to unleash your creativity and data visualization skills. To start creating intricate pie charts, follow the steps below.
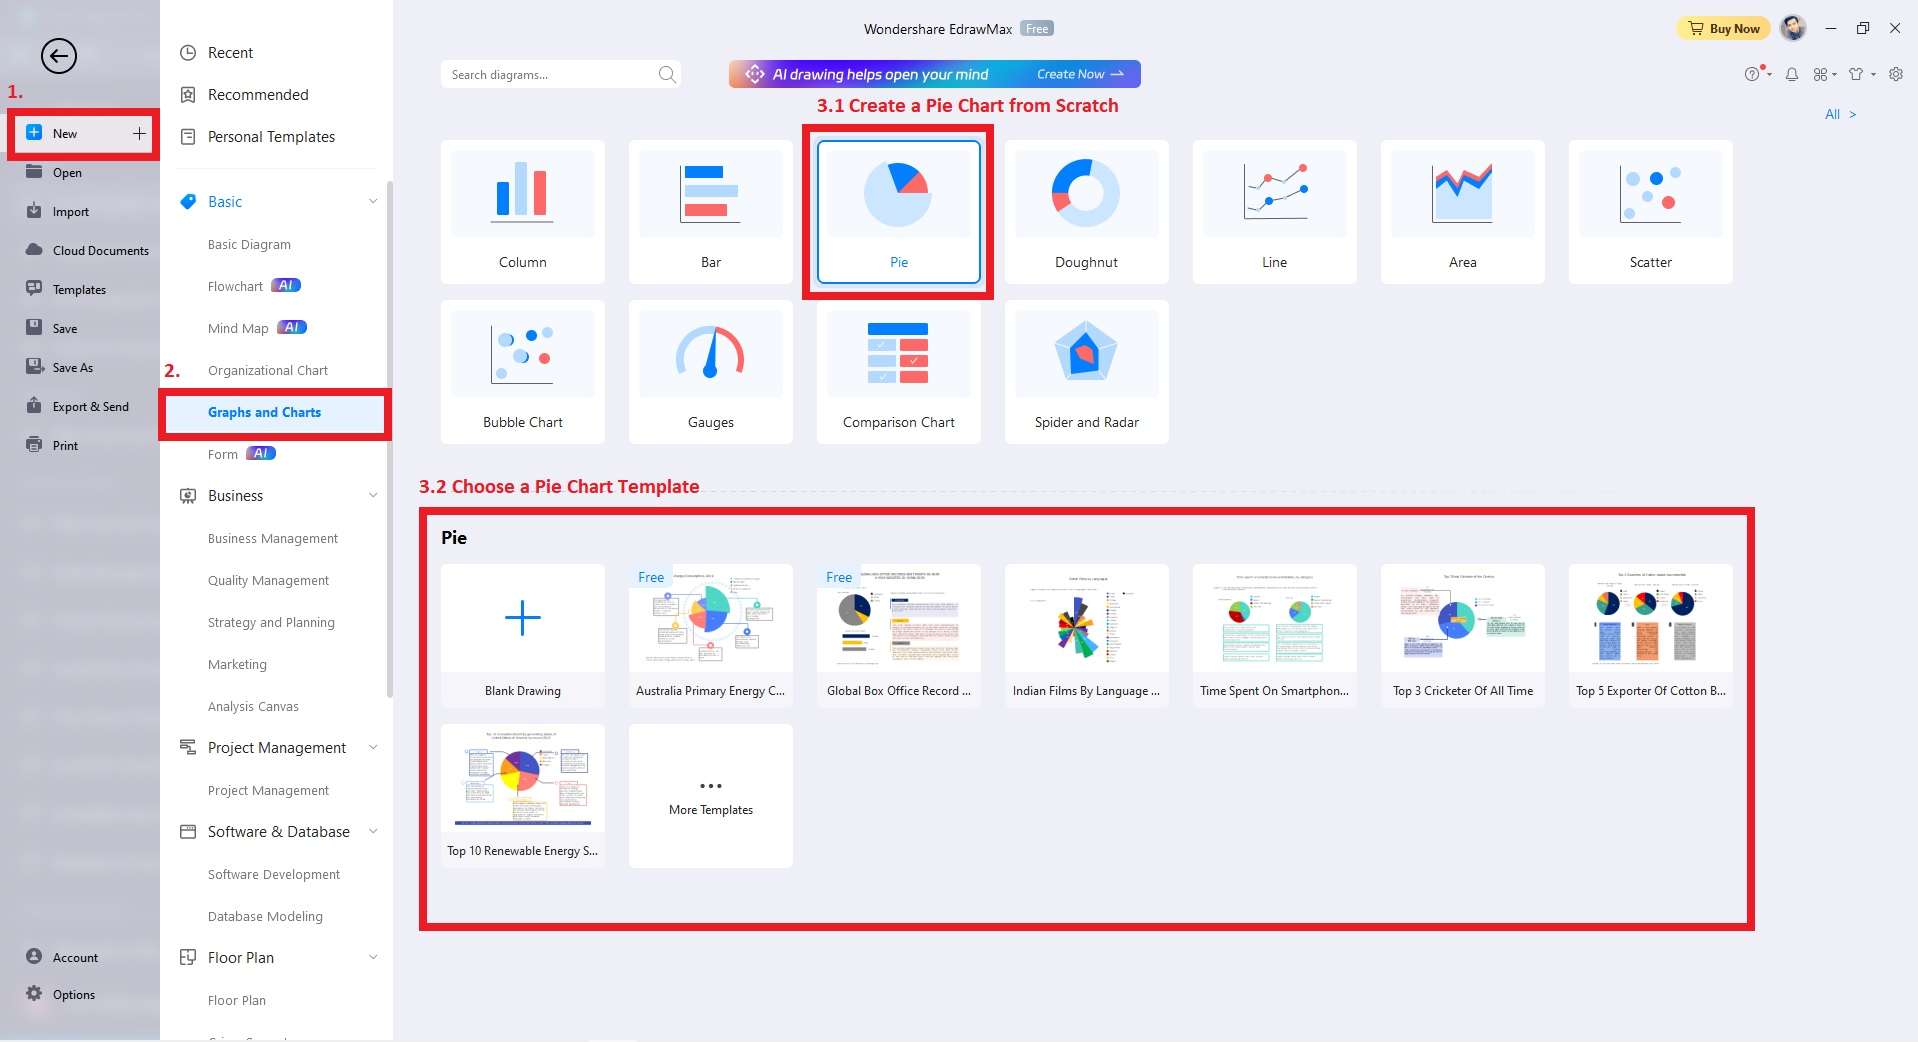
Step 1: Download and install EdrawMax on your device. You can also use EdrawMax online if you're on the go. Log in or sign up with a new account.
- Go to File > New button to select the diagram category that suits your project.
- Alternatively, click Basic > Graphs and Charts and choose a pre-designed pie chart template to get started in seconds.
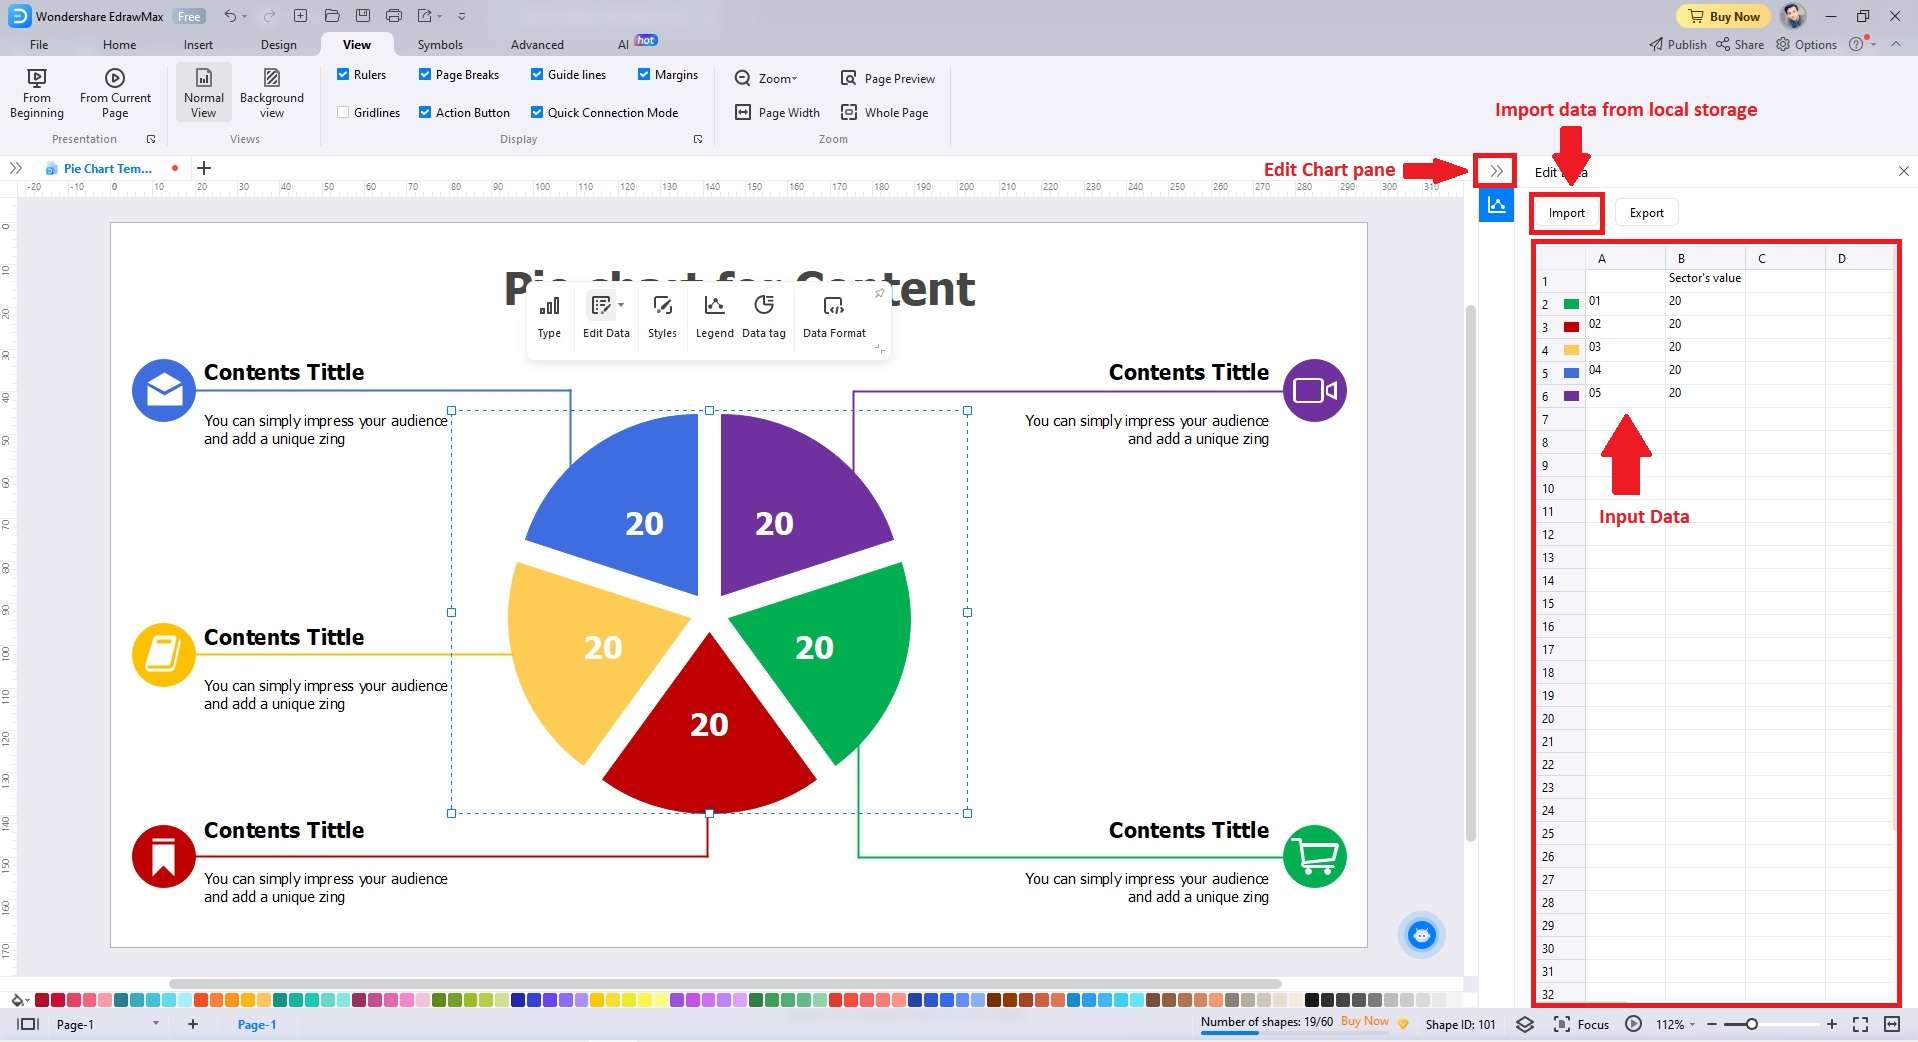
Step 2: Access the Chart pane by clicking the Chart icon on the right sidebar once your pie chart is open.
- Input data for your pie chart.
- Or click Import to locate a data file in your local storage. This action populates the Data pane with your chosen data. It will automatically update the pie chart on the drawing page to reflect the imported dataset.
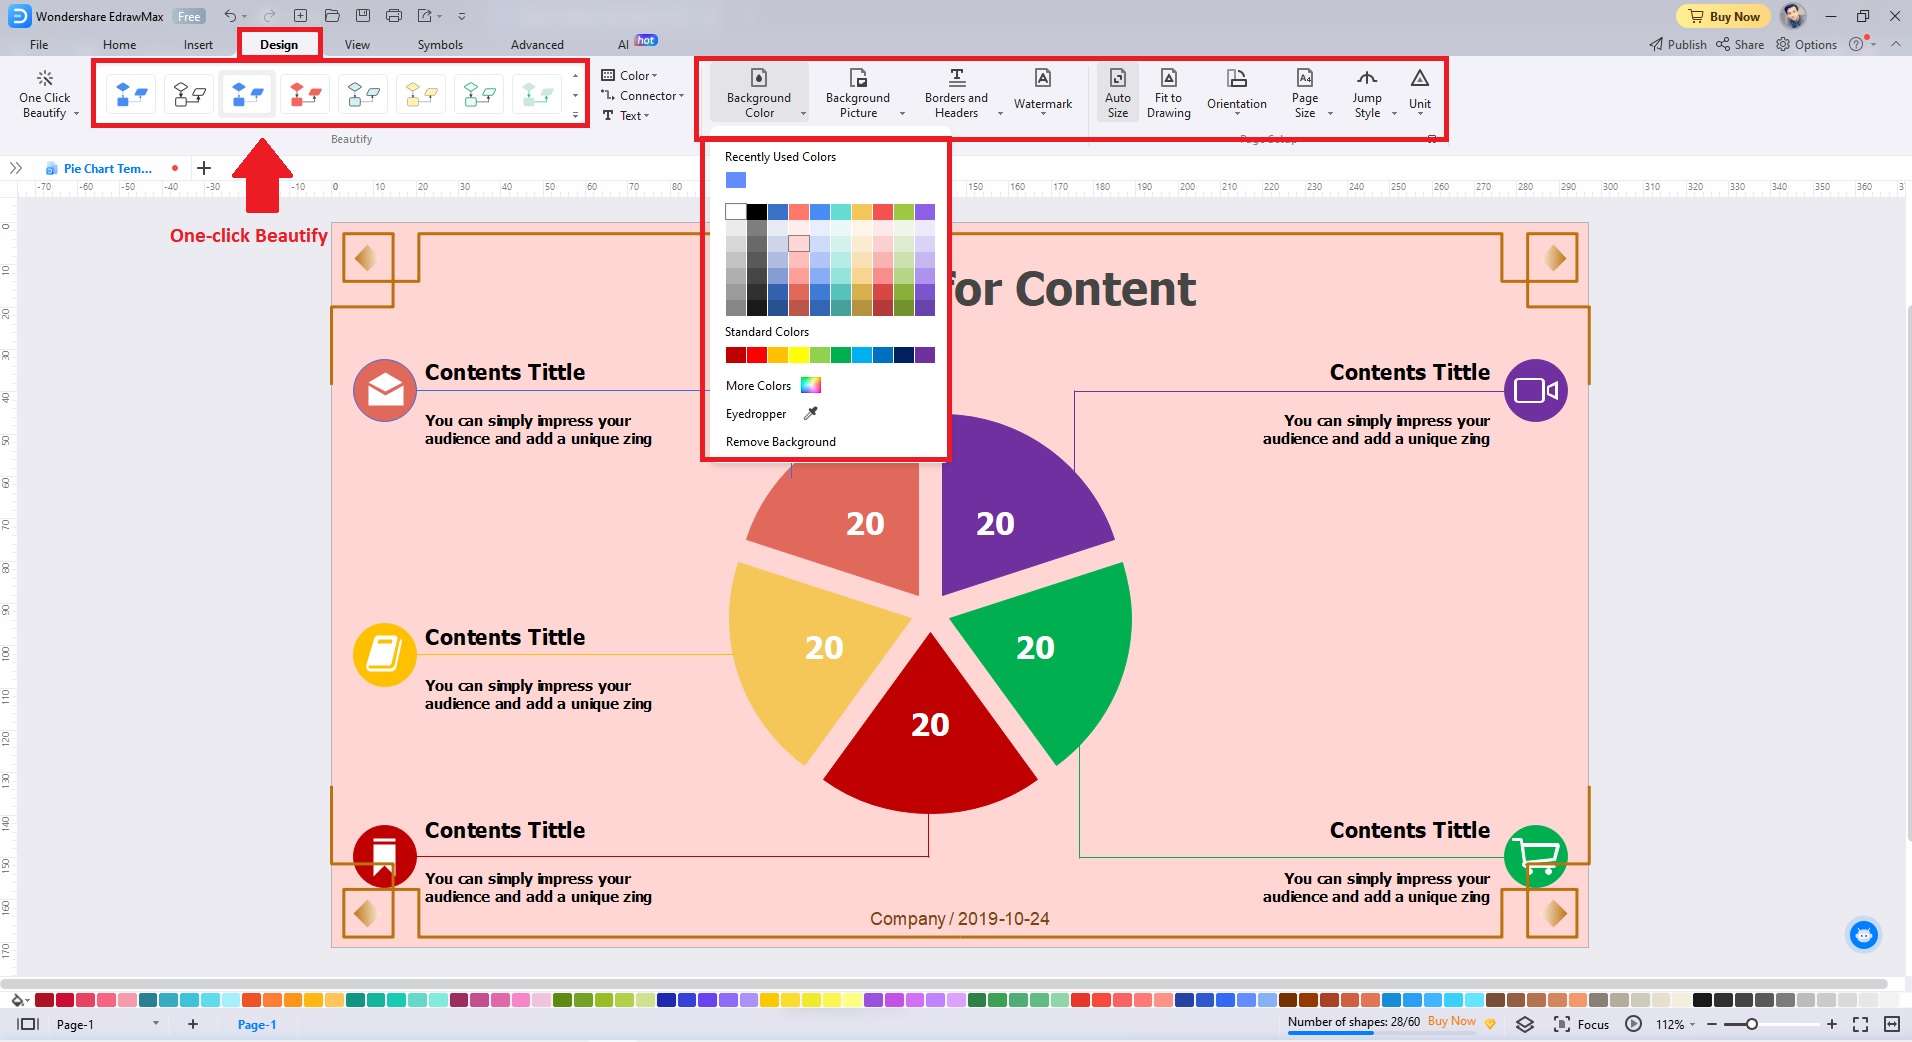
Step 3: Click the Design tab at the top toolbar to alter the pie chart's design and attributes.
- Choose any from the Beautify tab to personalize your pie chart in one click.
- Click Background Color, Background Picture, Borders and Headers, and more to refine your pie chart's appearance further.
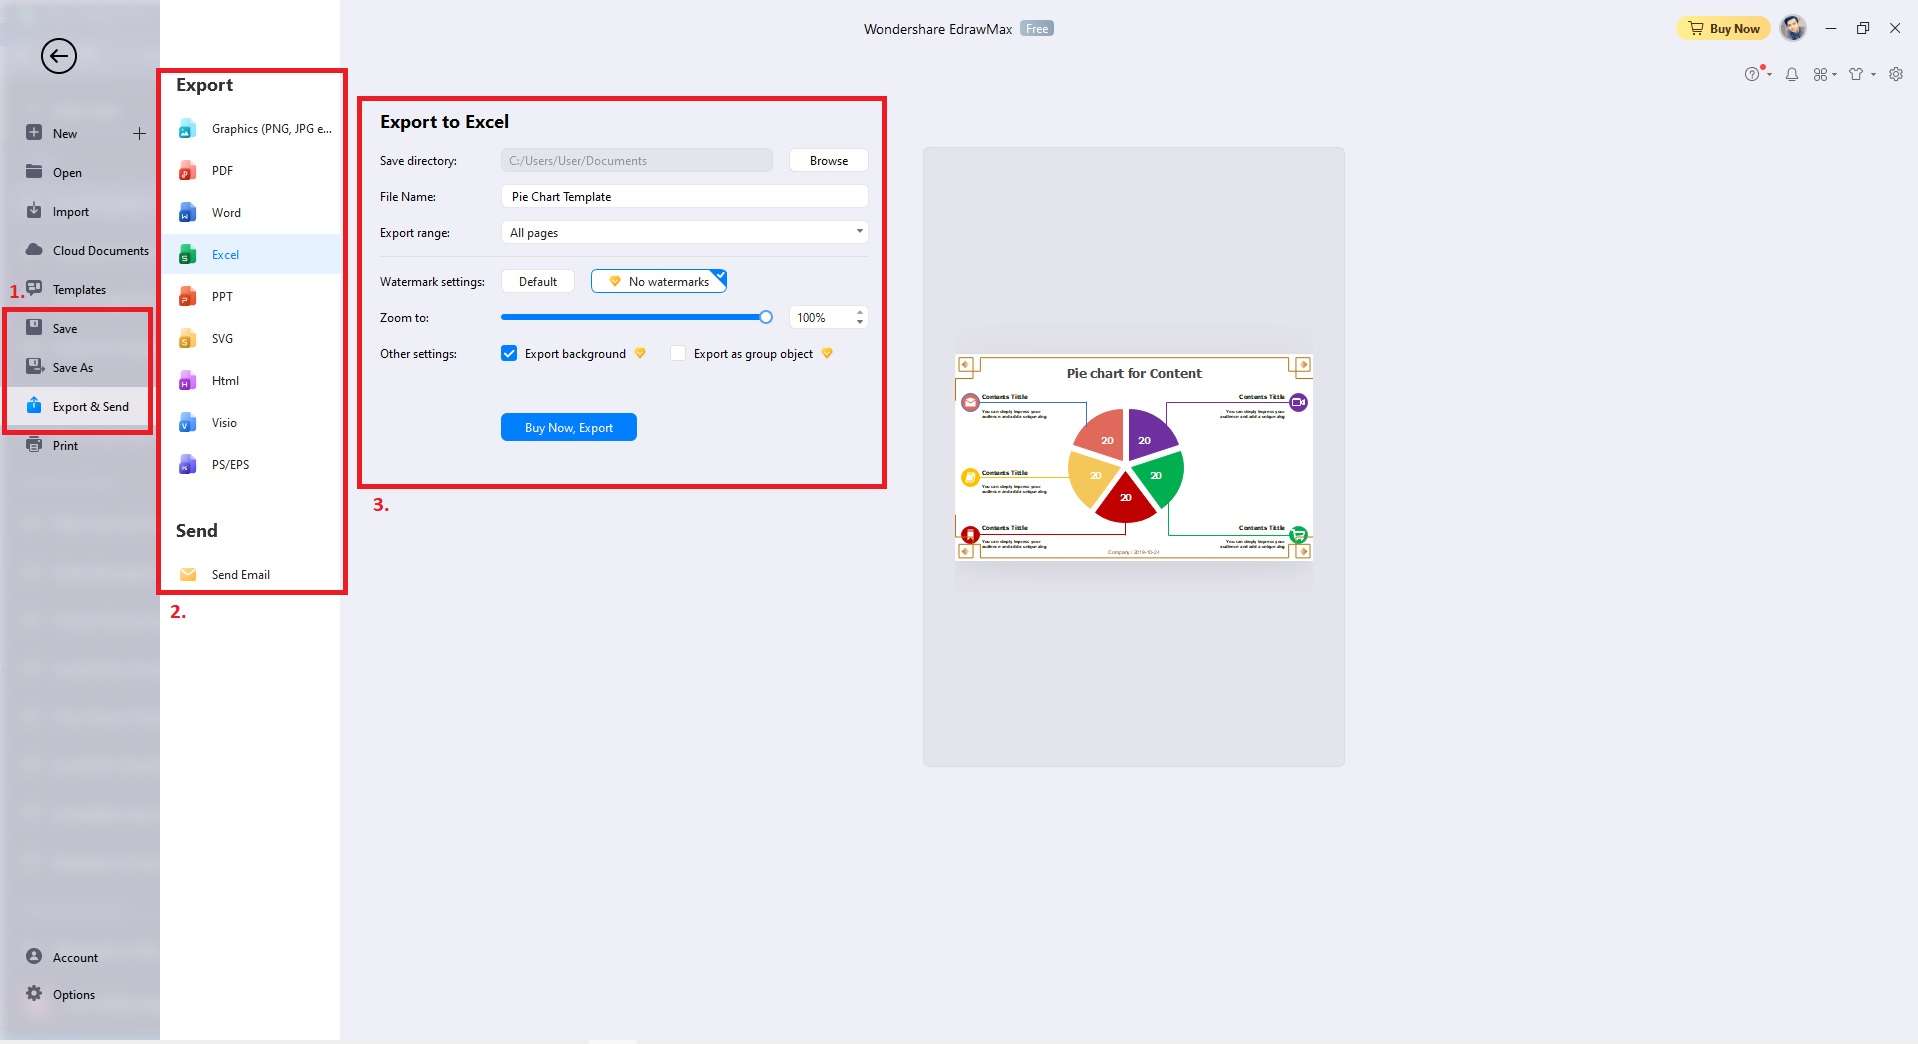
Step 4: Refine your pie chart until it meets your desired result. Upon completion, save it in your chosen format. You can also export it in XLSX and CSV formats, ensuring effortless sharing via Excel with others.
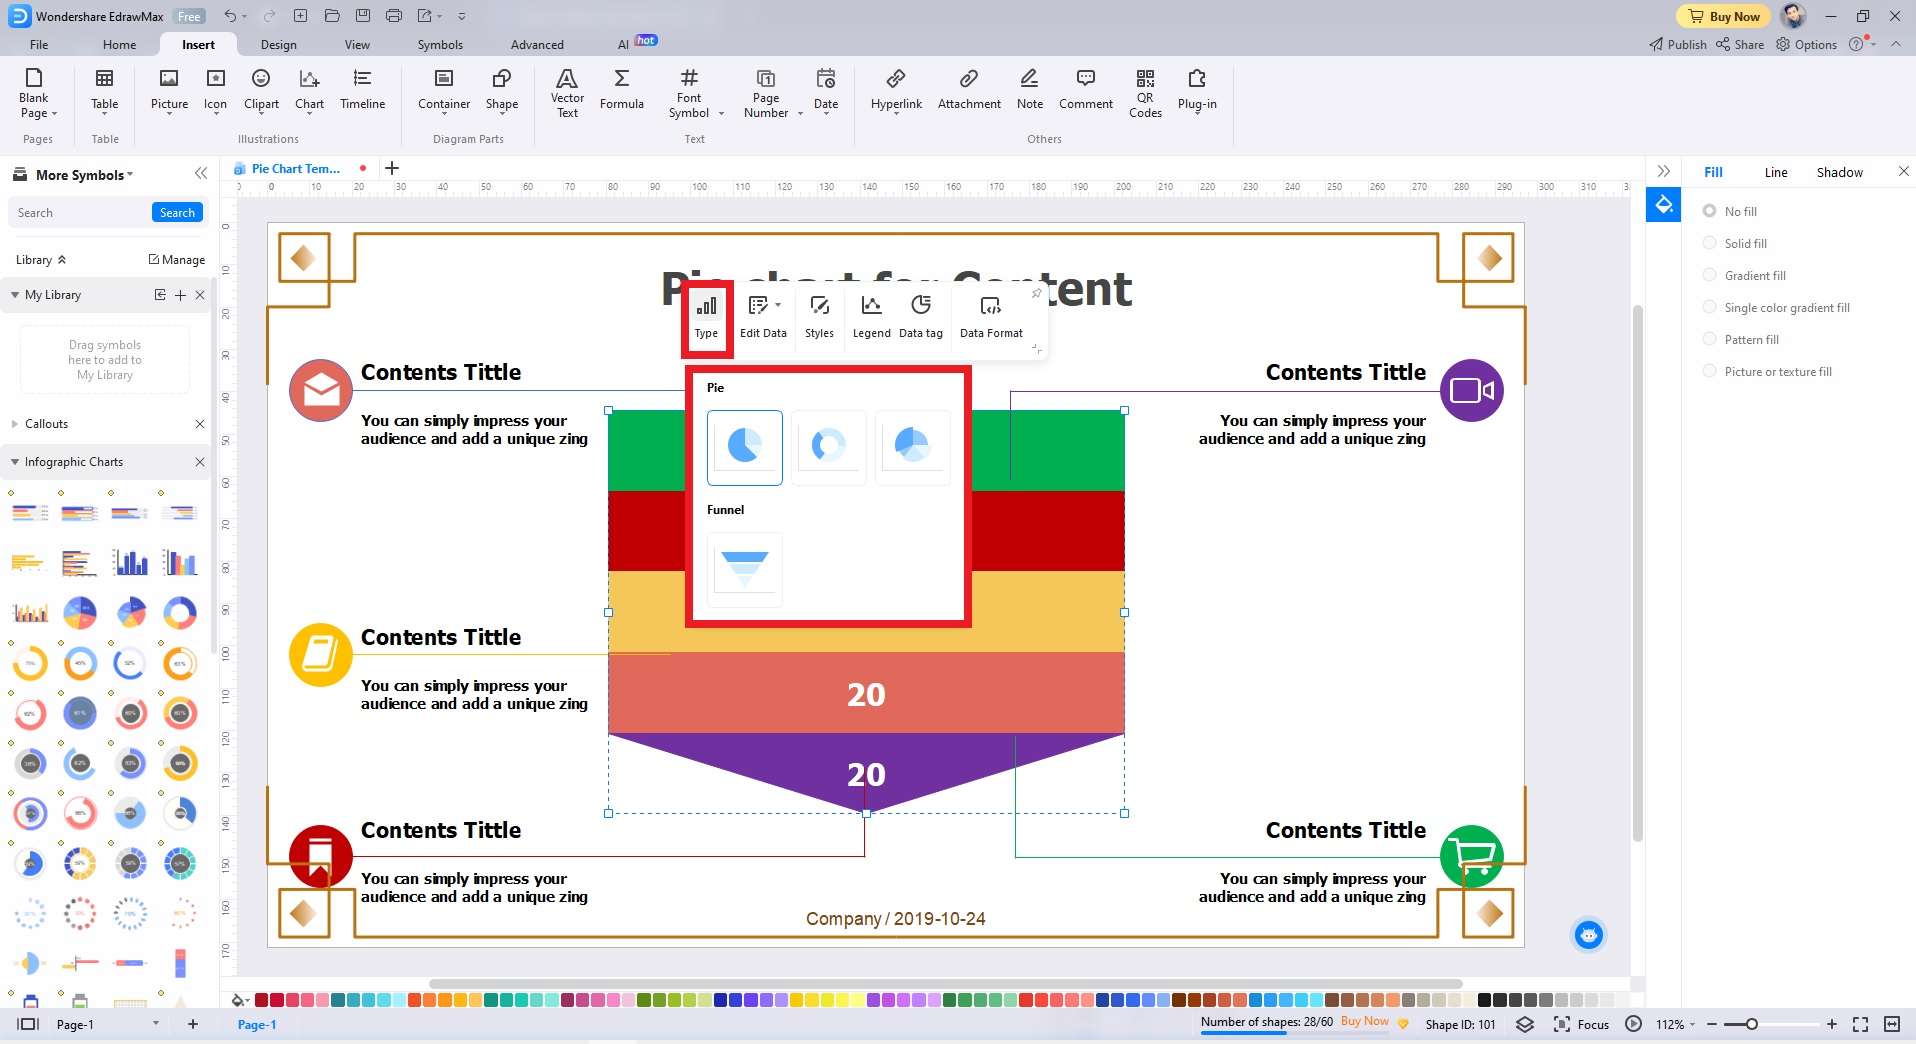
Step 5 (Optional): EdrawMax allows you to alter the design of your pie chart.
- Right-click on your pie chart and click on Type. Choose between three different pie chart types.
- Click Funnel to change your pie chart into a funnel chart.
Part 4.Conclusion
Making pie charts in Excel involves selecting data, choosing chart types, and customization through formatting tools. While Excel offers functionalities in creating pie charts, considering alternatives like EdrawMax is worthwhile.
EdrawMax provides an intuitive interface, diverse templates, and seamless pie chart creation. It makes data visualization an engaging experience. With many features, EdrawMax enhances your charting capabilities beyond Excel's scope. Embrace its power today to easily create compelling and informative pie charts.
AI Diagram Generator
Enter your prompt. Upload files if needed. Generate diagrams, charts, or slides instantly.


