Free simple circular diagram maker
Effortlessly create custom circular diagrams. Start from scratch or use free templates to create professional-quality cycle diagrams designed for your needs.

Why Use EdrawMax Circular Diagram Maker?
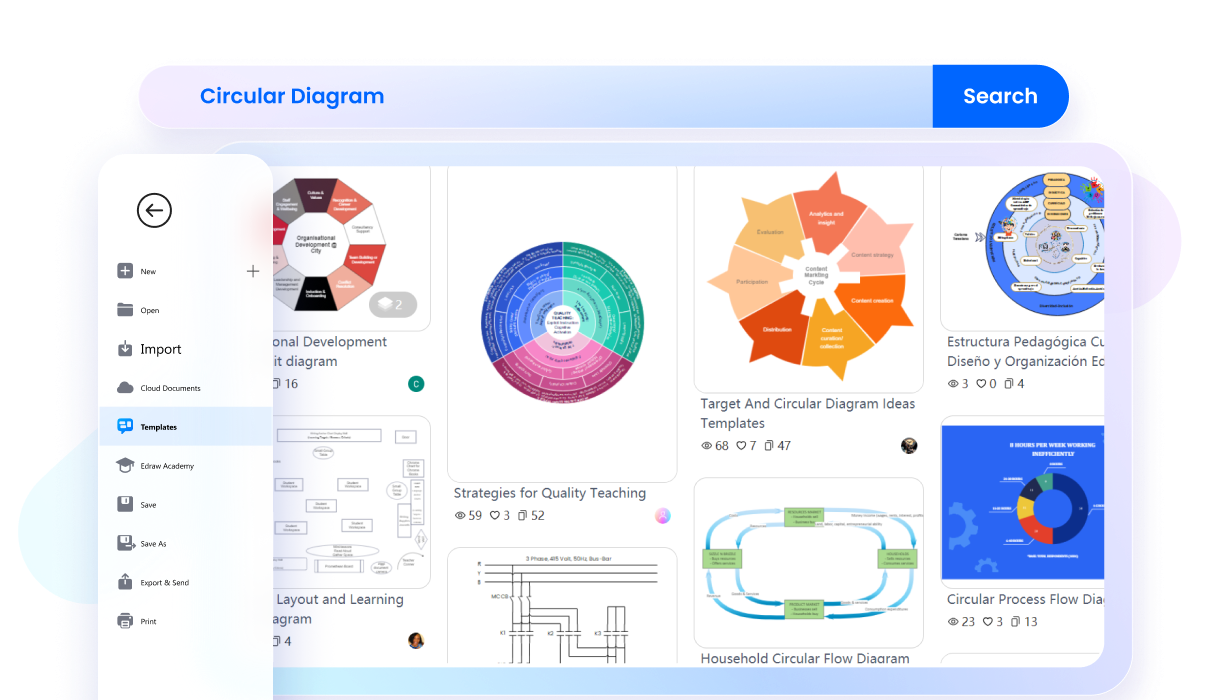
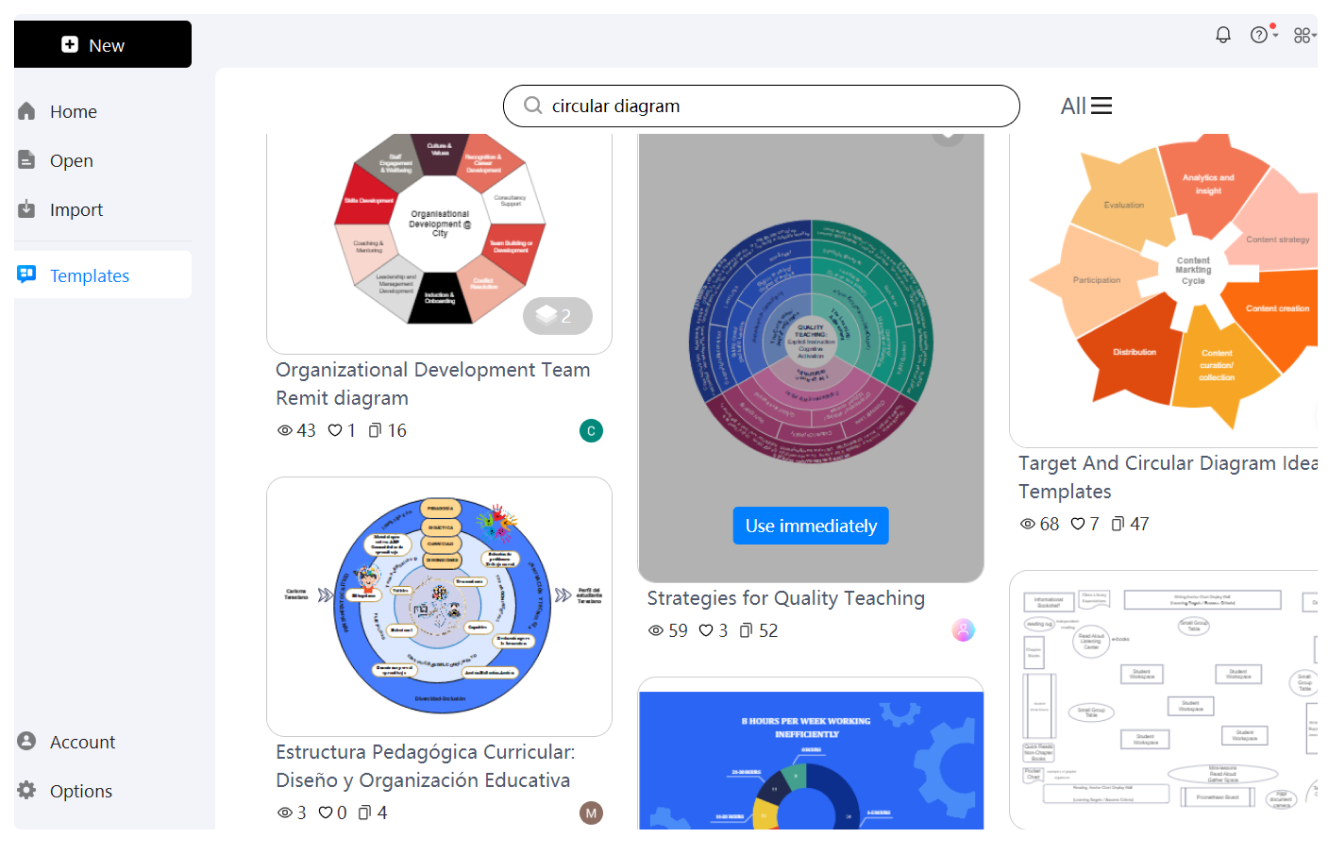
EdrawMax offers an extensive collection of templates specifically designed for creating circular flow diagrams. These templates simplify the design process. All you need is to pick a related circular diagram and start customizing with thousands of symbols, suited for cycle diagrams.
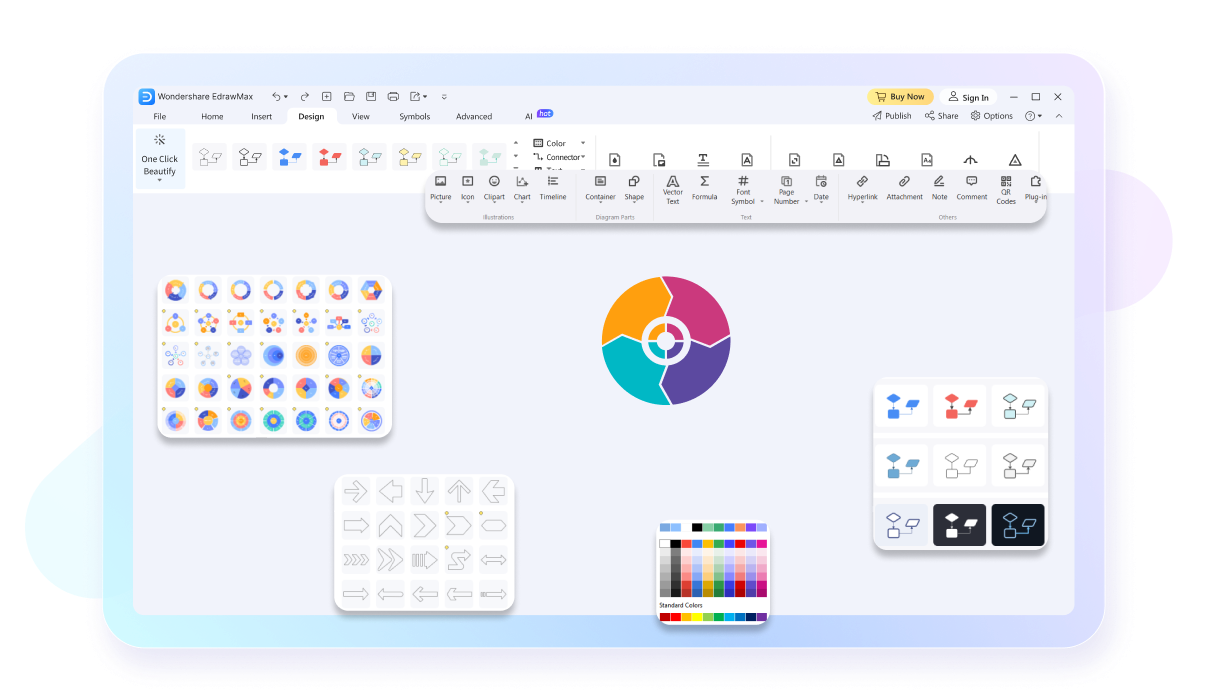
The one-click beauty feature transforms basic diagrams into polished, professional-looking visuals with a single click. This function standardizes styling, colors, and layouts. This ensures that your circular diagrams are not only informative but also visually appealing. By applying consistent design elements automatically, it helps maintain a high standard of presentation, which is critical for professional documents and presentations.
EdrawMax's presentation function enables seamless conversion of diagrams into presentation-ready formats. You can present directly from the platform or export your diagrams to PowerPoint (PPTX) for further customization. This feature ensures that your circular diagrams are easily integrated into your presentations to make them more dynamic and engaging. It also supports live presentations, where you can interact with the diagram elements during your talk.

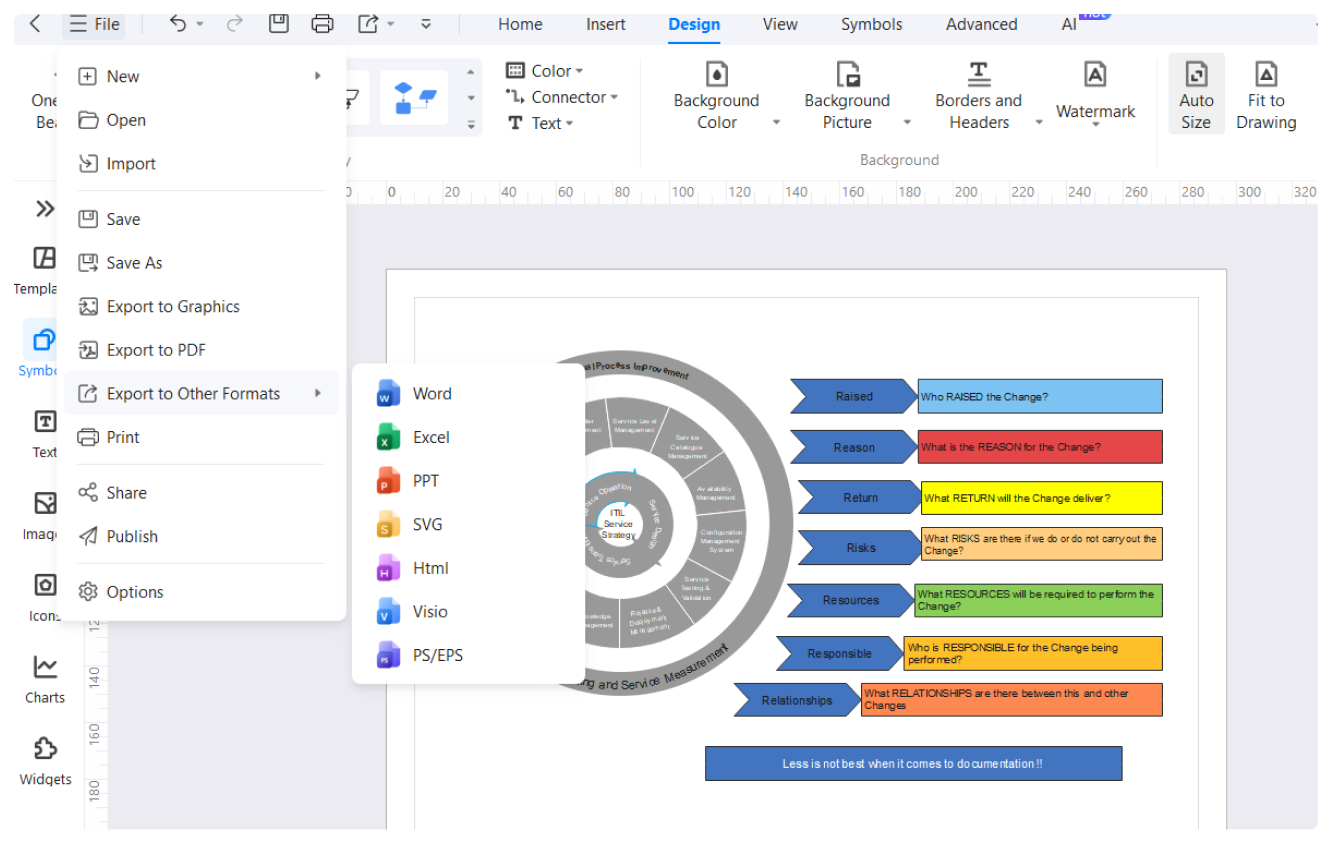
Integration with Microsoft Office is a significant advantage of using EdrawMax. You can easily export your circular diagrams to Word, PowerPoint, and Excel. This integration ensures that your diagrams can be incorporated into reports, presentations, and spreadsheets without any compatibility issues. Whether you're preparing detailed reports or dynamic presentations, the ease of exporting and importing between EdrawMax and MS Office streamlines your workflow.

How to Make a Circular Diagram in 3 Simple Steps
What our users say
More Circular Diagram Tools
Discover more AI-powered diagram makers to boost your productivity.
FAQs About EdrawMax Circular Diagram Tools
-
What is a circular diagram?A circular diagram is a visual tool used to represent processes, cycles, or repeating sequences that have no definitive beginning or end. Its primary purpose is to show how different stages relate to one another in a continuous loop, emphasizing the flow and interconnectedness of a system or project lifecycle.
-
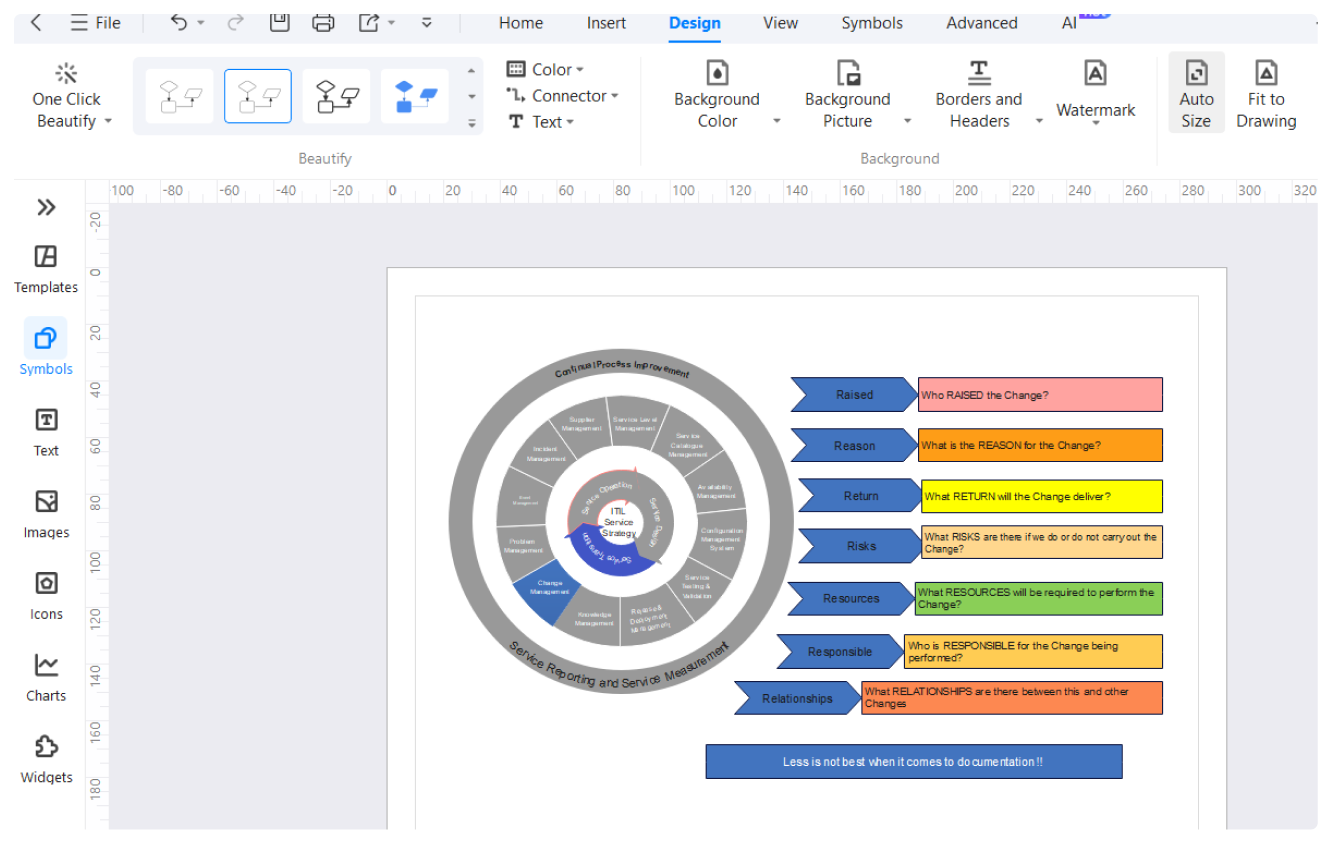
What are the essential elements of a standard circular diagram?A standard circular diagram typically consists of a central hub or core, surrounding segments or "slices" representing individual steps, and directional arrows indicating the flow. Labels and icons are often added to each segment to provide context, ensuring that the viewer understands the specific actions required at every stage.
-
How does a circular diagram differ from a traditional pie chart?While both are round, they serve different functions. A pie chart shows proportions or parts of a whole at a single point in time. In contrast, a circular diagram illustrates a sequence of events or a process over time, focusing on the progression and relationship between sequential steps or phases.
-
When is it most appropriate to use a circular diagram instead of a linear one?You should use a circular diagram when your data or process is cyclical, such as a business life cycle, seasonal trends, or continuous improvement models like PDCA. Unlike linear charts, which imply a final result, circular diagrams highlight the ongoing nature of a process where the last step feeds back.
Stop drawing. Start describing.
AI diagramming isn't just text-to-diagram.
AI now understands any input, fetches live data, adapts through dialogue, and works everywhere.
Free circular diagram templates from EdrawMax