Are you a veteran or rookie project manager? Chances are you’ve already heard of a Gantt chart. The term might be intimidating at a glance, but that’s not the case. A Gantt chart is an effective and helpful tool for project managers to improve various aspects of their projects. As a result, it makes planning for all jobs easy and visible for all parties to enable timely delivery.
In this comprehensive guide, you will learn everything about the Gantt chart. What it is, how to use it, how to create one, and why it is an essential tool for many project managers.
In this article
Part 1. What is a Gantt chart?
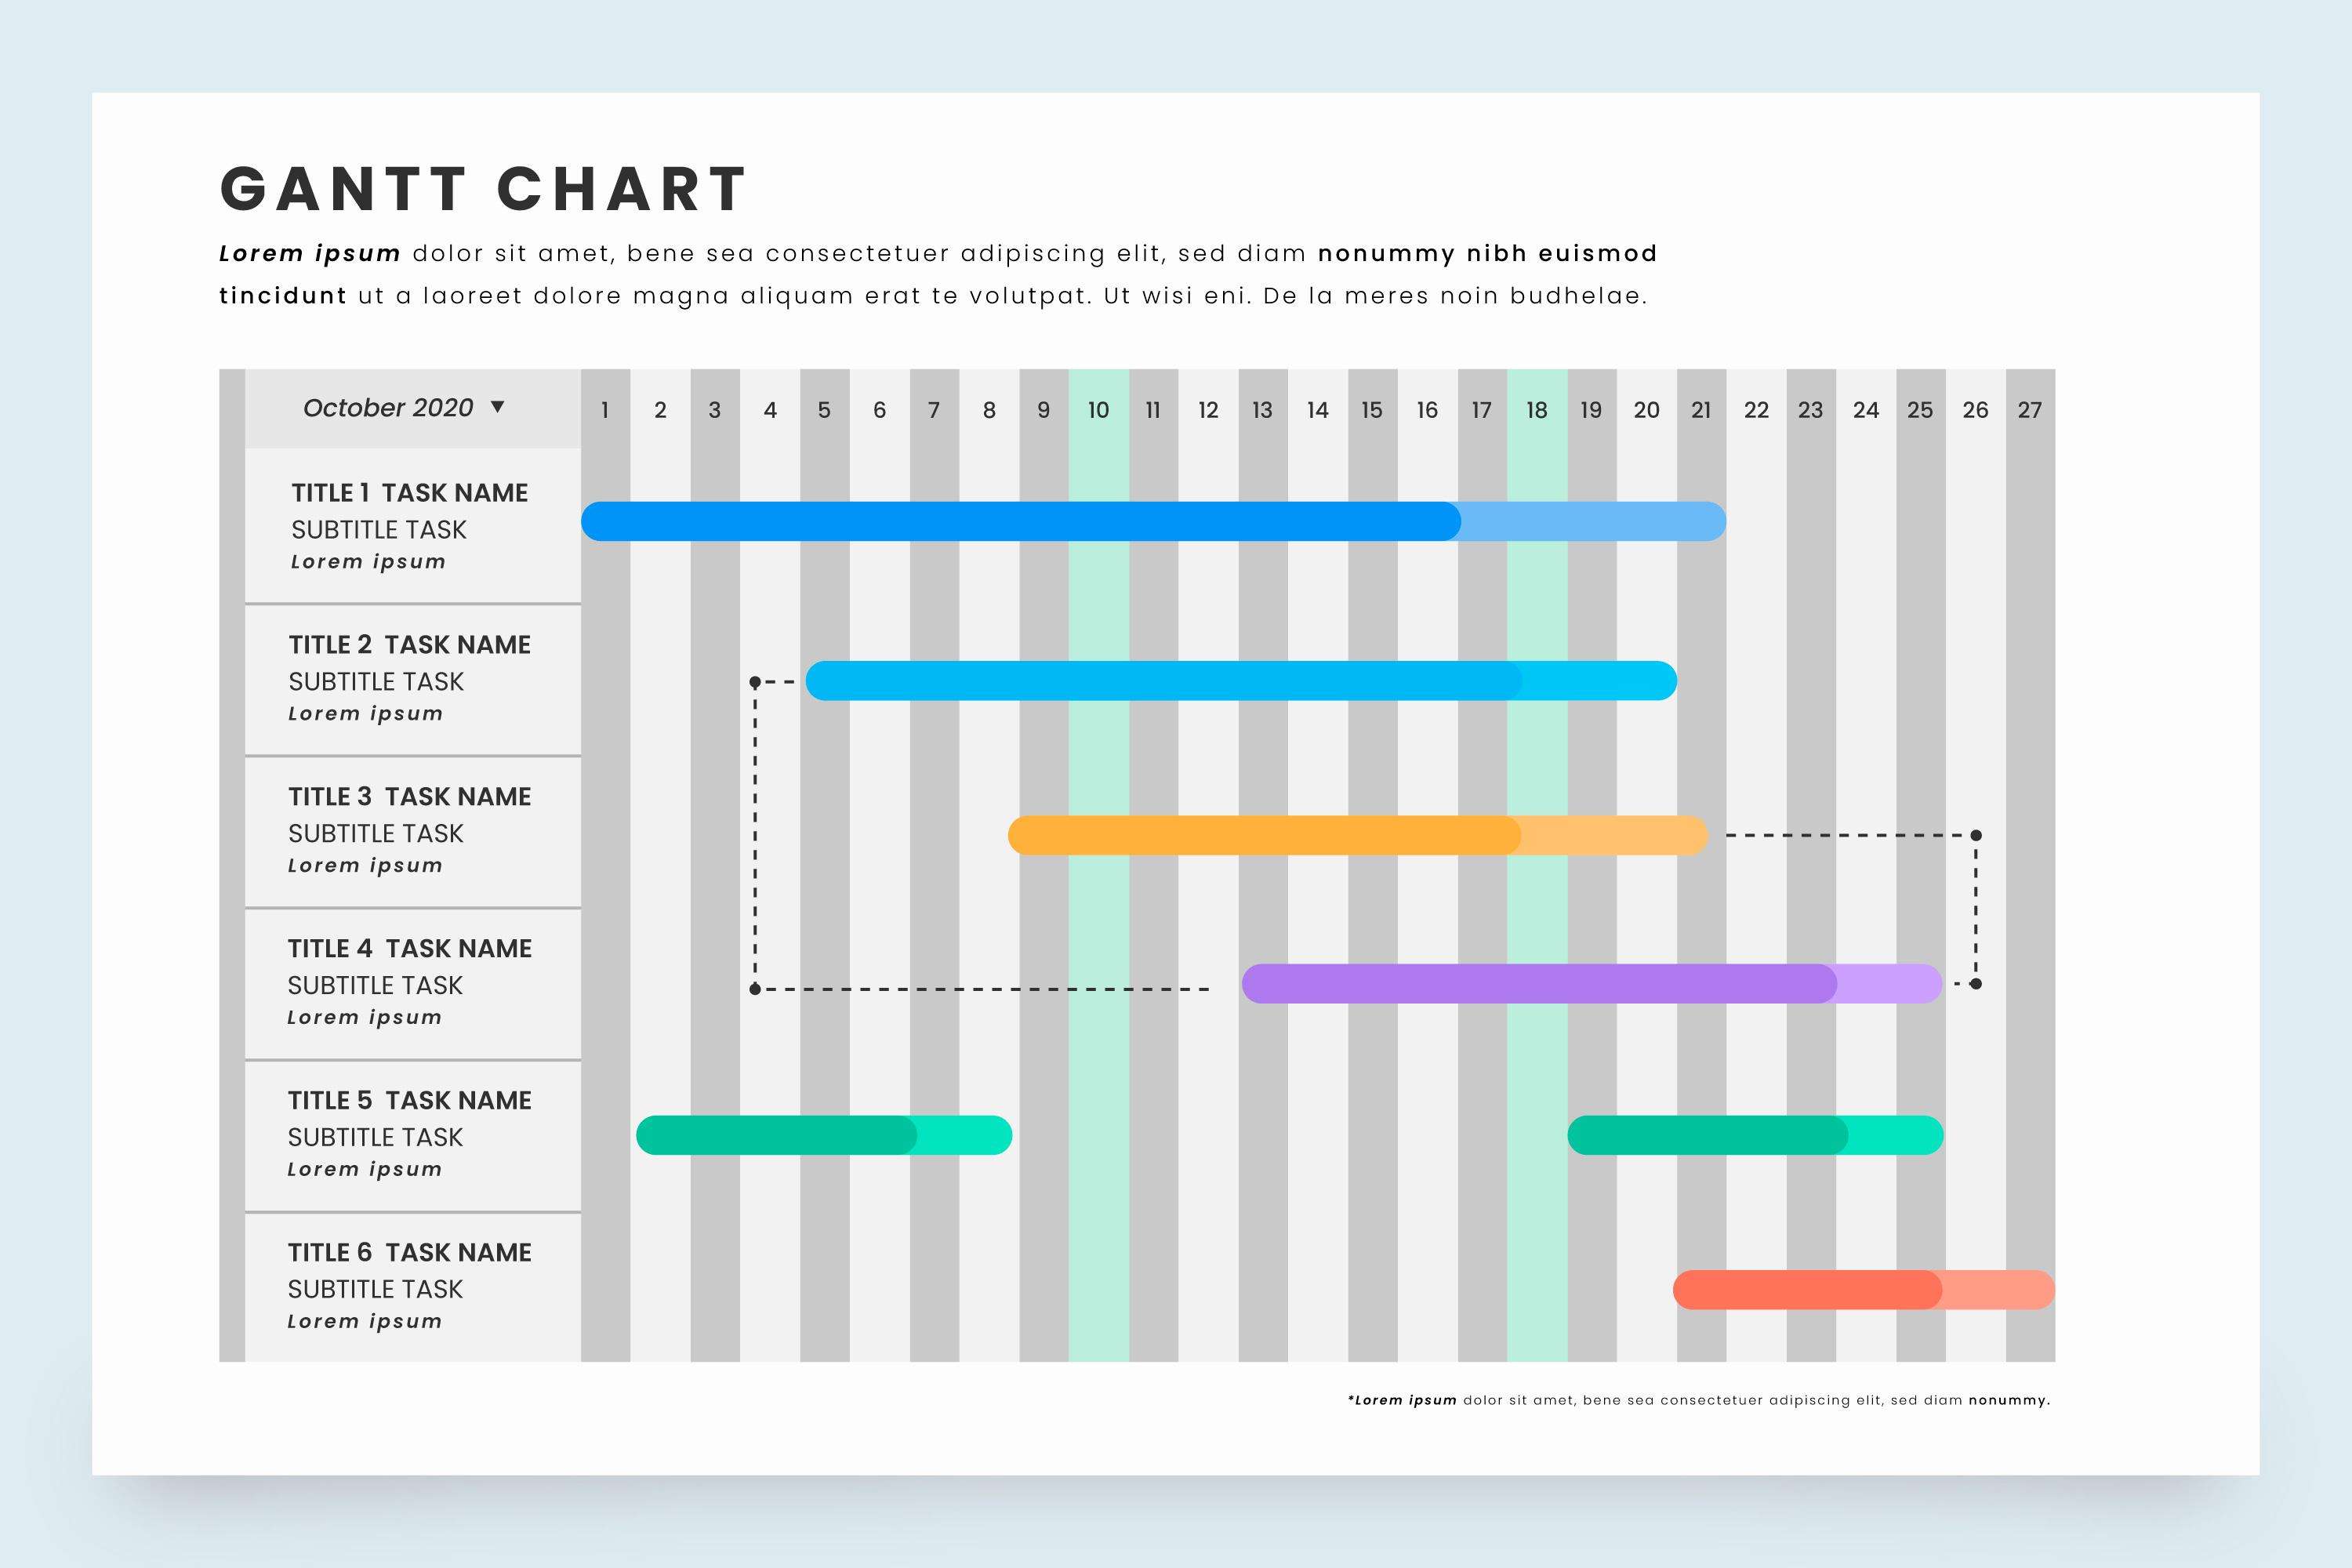
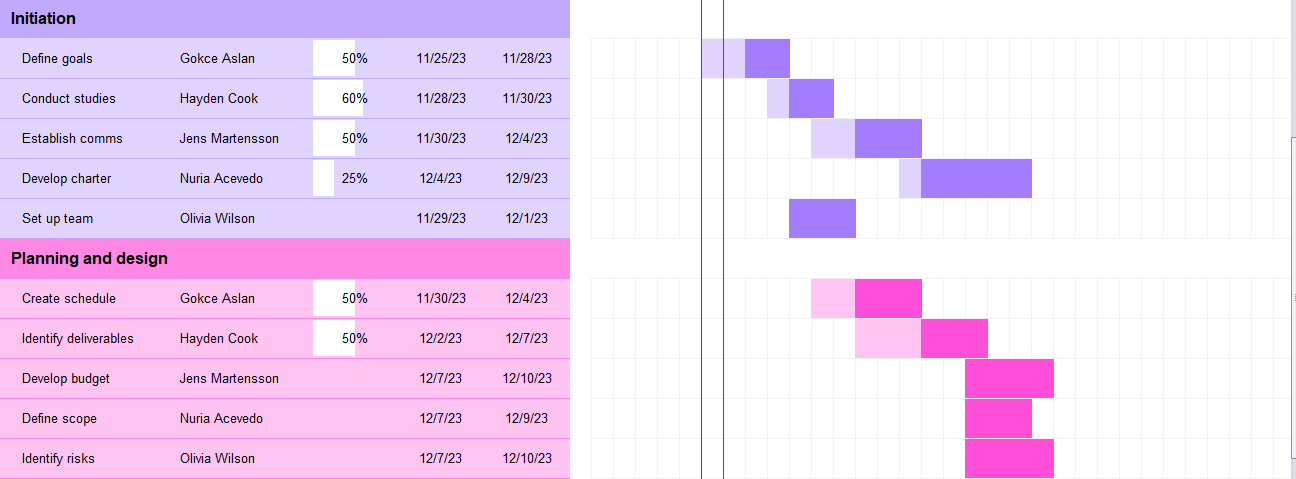
In simple terms, a Gantt chart is a tool project managers use to manage big projects. However, if you were to go a bit in-depth, a Gantt chart is a horizontal bar chart used to visually represent a project plan’s duration and what it entails. Speaking of what it entails, the basics are the timeline, the tasks, and who’s responsible for each task.
With a Gantt chart, you can:
- Break down a big project into small, manageable tasks
- Assign timelines for each task
- Delegate a task to individuals
- Determine the relation between two or more tasks
- Determine the progress of each task
Part 2. Gantt Chart History
In 1896, Polish professor and engineer Karol Adamiecki devised the first Gantt chart. The professor intended to have a clear idea of production schedules in the steel company he worked in. However, you might ask why the chart wasn’t named after him. You see, back in the day, the professor published the chart in Russian and Polish. As a result, his work didn’t receive worldwide acclamation. Before the name “Gantt,” Karol Adamiecki named his chart the Harmonogram.
So, how did the Gantt chart receive its name? Fifteen years after Karol Adamiecki’s idea of visualizing project scheduling, Henry Gantt would develop an improved version of Adamiecki’s idea. Gantt used bar charts to help supervisors in steel companies know whether production was on or behind schedule. Since Gantt published his work in English, a larger population picked it up, hence the title. However, the project management world still credits the first idea to Karol Adamiecki.
Part 3. How to Use a Gantt Chart
Using a Gantt chart has several benefits, which we’ll explore next. But before that, let’s explore how to use this tool and keep your projects on track.
- Start by calculating the duration of each task: It’s important to have a clear idea of the timelines anticipated for each task. Furthermore, if a task needs subdivision, it would save you anguish later on if you did it now.
- Always update your chart: Since it is visible to other team members, it’s crucial to always update it for proper visualization. Maintaining an unchanged project schedule can lead to misinformation and, ultimately, a total collapse.
- List the project milestones: Always ensure you set the project timelines and update the milestones to track and manage the entire project and the mini-tasks.
- Share your progress with stakeholders: Other than your team members, it’s essential to update other stakeholders involved on the current happenings of the project.
Part 4. Pros and Cons of the Gantt Chart
Gantt charts are indispensable tools, visually representing project tasks, timelines, and dependencies. While widely embraced, Gantt charts have advantages and limitations that project managers must navigate.
Pros:
- Teamwork: Since Gantt charts are great for big projects, the biggest benefit of using this tool is collaboration. Team members can access the same information, ensuring everyone remains updated at every job level. As such, there’s proper accountability for every task.
- Efficiency: With every team member updated on their tasks, efficiency is guaranteed. Project managers can calculate project timelines and assign necessary resources to increase productivity.
- Visualization: As described earlier, a Gantt chart is a visual representation tool. Therefore, all team members involved in a project can have a general view of a project at a glance. Ultimately, this allows for easy project monitoring, organization, and management.
- Tracking: A simple glance at a Gantt chart allows a project manager to analyze task progress. And if there are any problems, the manager can adjust accordingly to maintain the same deadlines.
- Versatility: Gantt charts are adaptable to project sizes. Furthermore, they offer multiple project views while allowing for cross-functional applicability, ultimately proving their versatility.
Cons
- Difficult to understand: Designing a Gantt chart can be complex and tedious, especially for big projects. As such, someone with a proper grasp of the tool is needed to create a chart successfully.
- Doesn’t work for all types of projects: Managing small teams with a Gantt chart can be difficult, as is the case when using it for short-term projects.
- Dynamic Changes: Gantt charts may require frequent updates if there are changes in project scope, timelines, or resources.
Part 5. How To Build A Gantt Chart
You can build a Gantt chart using different methods. One of them is using traditional desktop applications, while others prefer using project management software. This section will teach you the general method used to create a simple Gantt chart.
- Choose the right tool: Before anything, choosing the right tool to build your Gantt chart is essential.
- Set the project information: Before creating your chart, list all your ideas about the task. Essentially, you want to provide the project's main agenda and overall goal.
- Set the project tasks: Your next step is to break down the entire project into mini-tasks
- Schedule the task timelines: After creating all the mini-tasks, schedule each task by defining the duration for easy monitoring and tracking. Many software allow you to drag and drop a task on a timeline and later drag out either side to extend or shorten the duration.
- Add milestones for the project: Tracking project deadlines is crucial. So, you want to add important milestones for your project to help you identify key deliverables.
- Define and add dependencies: Do you have tasks that rely on each other? If so, you want to define them on the chart, how they relate to each other, and what resources they’ll need.
- Assign tasks to team members: Once everything is laid out, it’s time to assign each task to the respective team members to kick off the project.
Part 6. Gantt Chart Software Recommendation
After learning what a Gantt chart is and how to build one, it’s time to find software to help you develop a professional chart. But how do you know which software to choose? We did the heavy lifting by reviewing the top Gantt chart software.
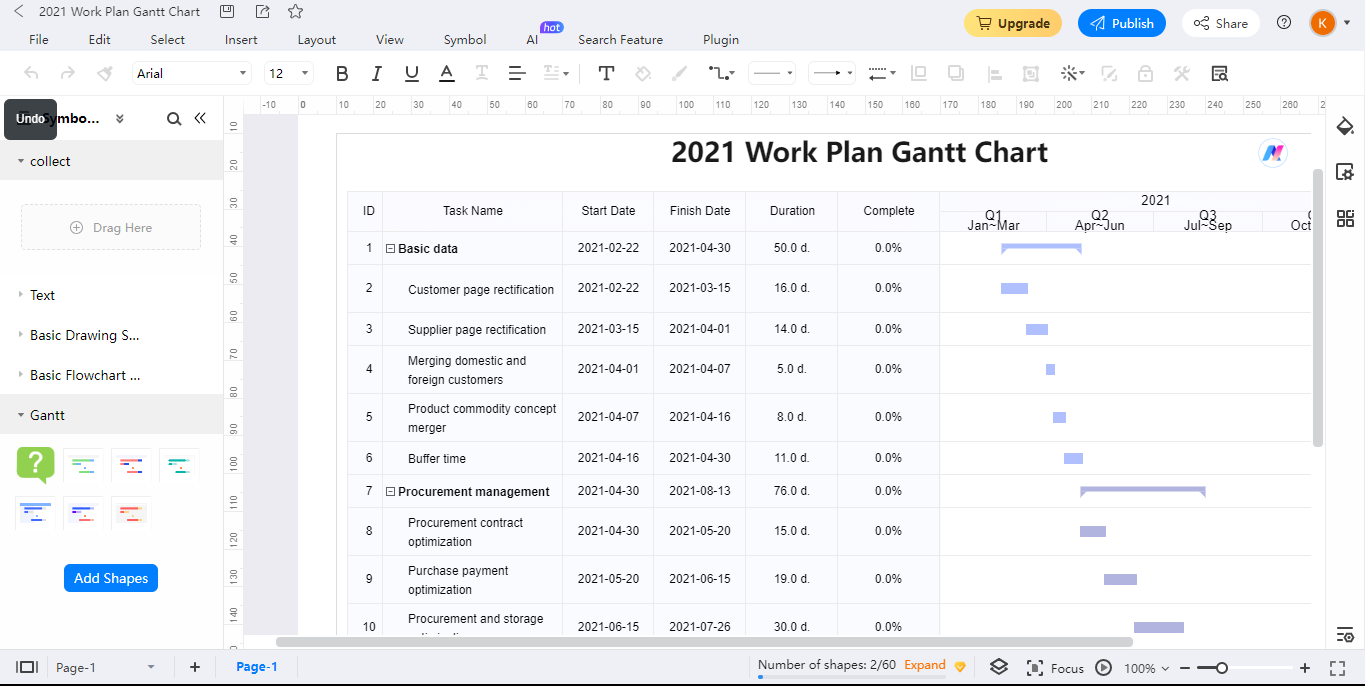
Edrawmax
The biggest benefit of EdrawMax software is its ability to draw any diagram (over 280). With this suit in your arsenal, you can produce several diagrams in one software. One drawback is it may be a bit overwhelming for novice users and too much for small organizations.
Key Pros:
- Plenty of templates to choose from
- Works on all operating systems (Linux, Windows, and macOS)
Key Cons:
- Doesn't integrate with other software
- Has no mobile app
Ms Project
Preferred by corporates, Ms Project is a veteran in the industry, providing some familiarity. While it may have been around long, it’s not easy to use. Plus, it can present a financial constraint for big teams.
On the positive side, the tool is available both online and offline but browser-based solutions. However, if you opt for the mid-range plan, you can use a downloadable desktop app.
Key Pros:
- Offline and online options
- Familiar user interface
- Amazing customer support
Key Cons:
- No downloadable mobile app
Instagantt
A feature-rich software with a Gantt chart tool, Instagantt is easy to use, especially with its drag-and-drop feature. Furthermore, users can split a task into mini-tasks and distribute them to team members using the workload management tool.
Additionally, Kanban and Board are available to help your team collaborate on projects. You can also use the reporting tools to monitor project timelines and adjust accordingly.
Key Pros:
- Offers clear reports and views
- The workload tool can alert you on members' workload
- Shareholders can access the project's progress
- You can budget
Key Cons:
- The cluttered interface can put off new users
Part 7. FAQs
How To Make a Gantt Chart in Excel
The first step is to create a project table. To do this, enter the project information in a spreadsheet as in a normal data entry situation. Have one column for the tasks and another for the task start date, end date, and duration.
The next step is to create a stacked Excel bar chart to help you visualize the data. Your horizontal axis will have the start dates, while the vertical axis contains the different tasks.
The third step is to input the duration. This step will show how long each task will take. Use the Select Data Source option to add the dates in Legend Entries (series). Adding task descriptions is the next step, using the “Select data source” option. Finally, it’s time to turn the Excel chart into a proper Gantt chart by tweaking several aspects, including the bars.
How To Make a Gantt Chart in PowerPoint
If you prefer PowerPoint, choose a template to emulate when designing your Gantt chart. But before that, you must fill your data in an Excel sheet and import it into PowerPoint.
After choosing a template, you can start the customization, changing the font styles and colors along with the borders, shape outlines/fills, and alignment. You can also add a text box if you wish to add text. The next step will be to add milestones and information about the milestones. You’ll then add bars and labels to the Gantt chart using the Bars tab in the Ribbon. Finally, make the Gantt chart attractive by adding graphics.
How to Make a Gantt Chart in Tableau
Your first step is to prepare your data by including task names, start dates, and durations. Ensure the dataset comprises these key components. The next step is to connect the data by choosing the appropriate data source. Import the relevant columns containing task names, start dates, and durations.
Drag the task names to the Rows shelf and the start dates to the Columns shelf. Tableau will automatically generate a timeline in this step. Next, drag the durations to the Size shelf, and Tableau will convert the timeline into Gantt bars, with the length corresponding to the task durations.
The next task to enhance clarity is to format the chart by adjusting colors, labels, and tooltips. Finally, review the chart and make any necessary changes. Afterward, save and share the visualization with other stakeholders.
Conclusion
There’s no doubt Gantt charts are popular among project managers. This tool provides a clear outline of a team’s work. That includes how the project comes together and the resources available to ensure timely delivery. As a result, complex projects turn into simple tasks, with a shared chart where every team member understands their role.
Thanks to this comprehensive guide, you now understand what a Gantt chart is. But more importantly, you know how to build and use one with various tools, such as Excel and Tableau. Whether you're a novice or a veteran project manager, a Gantt chart is a fantastic tool to ensure you have a firm grasp on your project to ensure timely delivery.