

Navigating a project without a clear roadmap can lead to chaos and delays. Picture a team laboring without a structured plan, confusing, and missed deadlines. The Program Evaluation and Review Technique (PERT) steps in here. PERT is a handy tool in Project Management. It helps organize tasks, figure out how long they might take, and show the most crucial parts of the project.
This article is a quick guide to PERT in project management, explaining how it helps make things smoother and on time. Learn how to use PERT charts in project management by reading below.
In this article
Part 1. What Does PERT Mean?
The Program Evaluation Review Technique (PERT) is a valuable project management tool employed to estimate the realistic time needed for project completion. Its primary purpose is to provide a structured project planning and scheduling framework. PERT utilizes visual aids like PERT charts or network diagrams to map out and organize tasks within a project.
By breaking down the project into smaller, manageable tasks, PERT facilitates better coordination among team members and assists in scheduling deliverables more efficiently. Moreover, PERT is more than just guessing how long tasks will take. It integrates a thoughtful approach by considering three time estimates for each job: optimistic, pessimistic, and most likely.
Part 2. What Does a PERT Chart Contain?
A PERT chart is a visual representation that captures the essential elements of a project in a clear and structured manner. It consists of interconnected nodes and arrows, illustrating tasks, their sequence, and their relationships. Unlike a Critical Path Method (CPM) chart that focuses solely on the critical path, a PERT chart incorporates the variability of task durations by utilizing three-time estimates.

The three-time estimates in PERT encompass each task's optimistic, most probable, and pessimistic scenarios. These estimates serve to outline the following:
- Optimistic time: The shortest possible duration required for completing a task under ideal conditions.
- Most probable time: The expected or most likely task duration based on normal circumstances.
- Pessimistic time: If unforeseen challenges or obstacles arise, this is the longest time it will take to finish the project.
By integrating these time estimates, a PERT chart provides a comprehensive overview of the project's timeline, incorporating a range of potential durations for each task. Moreover, PERT calculations work backward from a fixed end date, ensuring alignment with strict project deadlines, especially when contractor deadlines remain unmovable.
Part 3. How Does a PERT Chart Work?
A PERT chart, comprised of circles or rectangles denoting nodes, depicts project milestones or events. These nodes represent tasks and can be generated using software, from specialized PERT-chart-specific tools to common programs like Microsoft Excel.
Tasks in a PERT chart are linked by lines or vectors, symbolizing the sequence of activities. These connections denote task dependencies; for instance, an arrow from Task No. 1 to Task No. 2 indicates that Task No. 1 must conclude before Task No. 2 commences.

Tasks occurring simultaneously but belonging to different task lines within the project are referred to as parallel tasks. They progress independently and concurrently at the same project stage.
The visual layout of a well-constructed PERT chart provides an organized view of task interdependencies, facilitating project analysis and estimation of individual task durations. By leveraging this information, project managers can calculate the minimum time needed for project completion, enabling better planning, resource allocation, and timeline management.
Part 4. PERT Chart Examples
Now that you know everything about how a PERT chart in project management works, you can find some examples in this section. They're all from Wondershare EdrawMaxs Template Community. So, if you want to access other PERT chart examples, go through the website and find your inspiration.
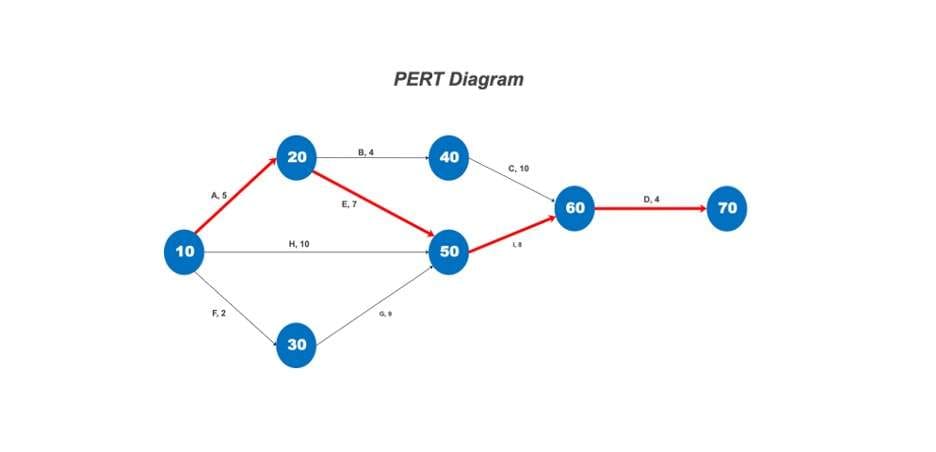
Example 1: Numbers-Only PERT Chart
Ideal for rapid referencing, the Numbers-Only PERT Chart simplifies complex project sequences using numerical representations. This streamlined format swiftly conveys task sequences and dependencies, making it handy for quick checks or brief overviews. While lacking detailed descriptions, it is a snapshot of the project's flow. An accompanying legend can enhance its functionality.
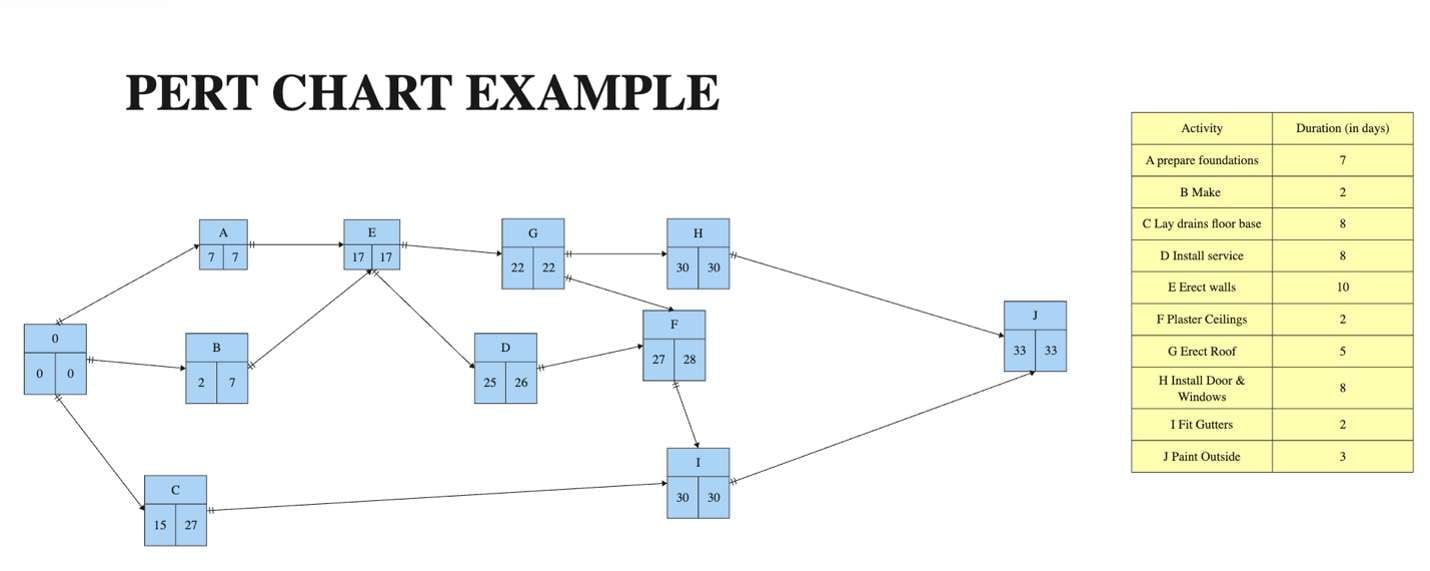
Example 2: PERT Chart With Data Table
The PERT Chart With Data Table offers a conventional template enriched with an integrated table, serving as a comprehensive repository for additional project information and legends. This amalgamation of a visual chart and data table enhances communication and clarity. The table augments the chart by detailing task descriptions, time estimates, task dependencies, and other relevant project-specific data.
Part 5. The Kardashian Family Tree - Broken Links and Strong Ties
Conclusion
In conclusion, using PERT charts simplifies complex projects by breaking tasks into manageable steps. It helps teams understand task sequences and dependencies easily. For creating PERT charts for project management, use EdrawMax. It's user-friendly, offering ready-to-use templates for various project needs.
EdrawMax simplifies the charting process, allowing even beginners to create professional-looking PERT charts. With its intuitive interface and versatile templates, EdrawMax is an excellent choice for visualizing project workflows and ensuring everyone stays on the same page throughout the project journey.
Part 6. FAQs
PERT (Program Evaluation and Review Technique) simplifies project planning. Below are common queries explained concisely
- What are the 6 steps in PERT?
PERT involves defining tasks, sequencing them, estimating durations, identifying the critical path, building the PERT chart, and reviewing the plan.
- How do you calculate PERT in a project?
Calculate PERT by using three-time estimates (optimistic, pessimistic, and most likely) for each task and employing the formula: Expected Time = (Optimistic + 4 * Most Likely + Pessimistic) / 6.
- Where can I create PERT Charts?
Many charting tools or software are available today to create PERT charts for project management. You can make them with apps like EdrawMax, which offers comprehensive diagramming features. Alternatively, you can use big papers to create a physical PERT chart.