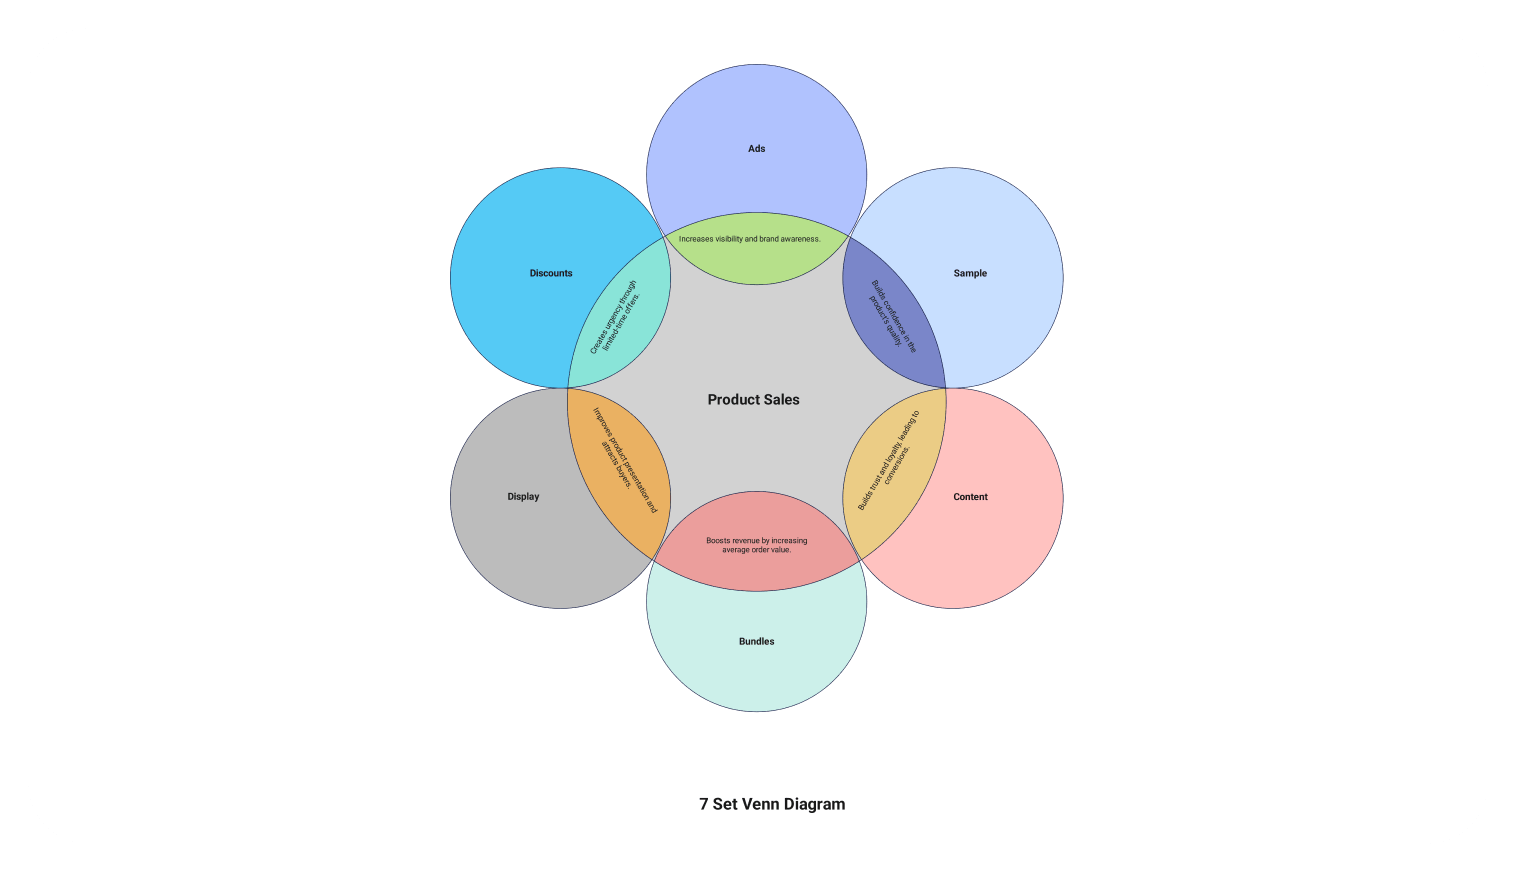
7-set Venn diagram
This flower-shaped seven-set Venn diagram is a creative way to relate complex topics.
- Templates
- Venn diagram templates
- 7 set venn diagram
About this template
The seven-set Venn diagram blooms like a geometric flower, with a central core surrounded by perfectly arranged petals. This elegant design isn’t just aesthetically pleasing – it represents one of the most sophisticated variations of set theory visualization.
At its heart lies a central intersection, surrounded by seven circles arranged in a floral pattern. Each “petal” contributes to the diagram’s capacity to display complex relationships. The example shown focuses on product sales strategies, with the center connecting different marketing elements: Ads, Sample, Content, Bundles, Display, and Discounts.
Seven-set diagrams mark the practical limit of traditional Venn diagram design. Beyond this number, the geometric complexity becomes overwhelming. The flower-like arrangement maximizes the visibility of intersections while maintaining visual clarity. Each overlap creates distinct zones for analyzing relationships between different sets.
Modern applications span diverse fields. Marketing teams use them to map customer journey touchpoints. Scientists analyze molecular interactions. Data analysts visualize complex database relationships. The symmetric design makes it particularly effective for cyclical or interconnected systems analysis.
Seven-set diagrams are powerful tools for understanding complex systems, particularly when their flower-like structure aligns with the natural flow of the data being analyzed.
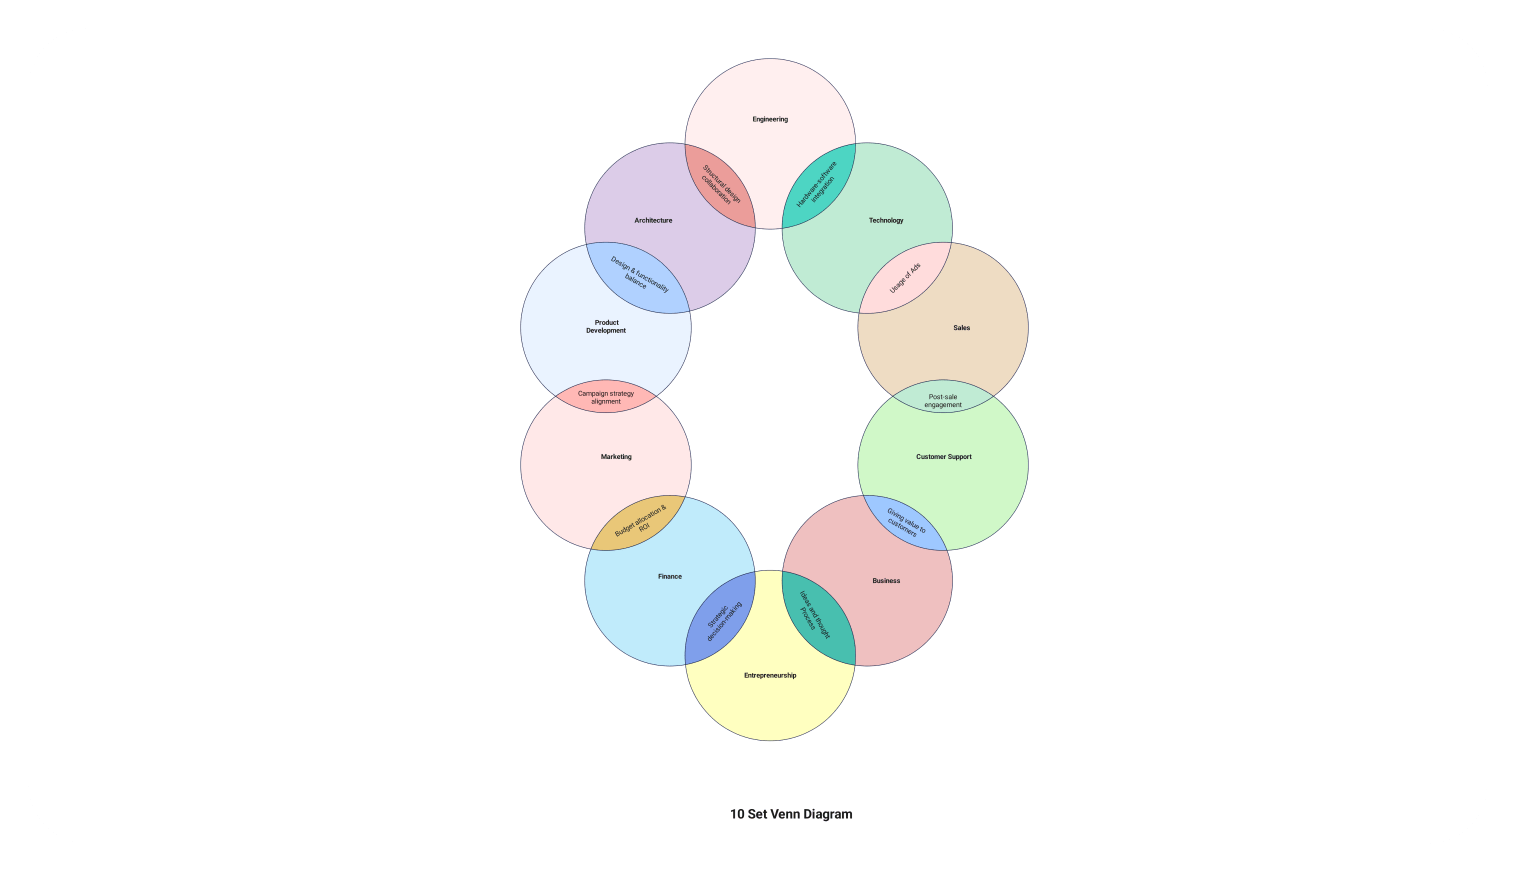
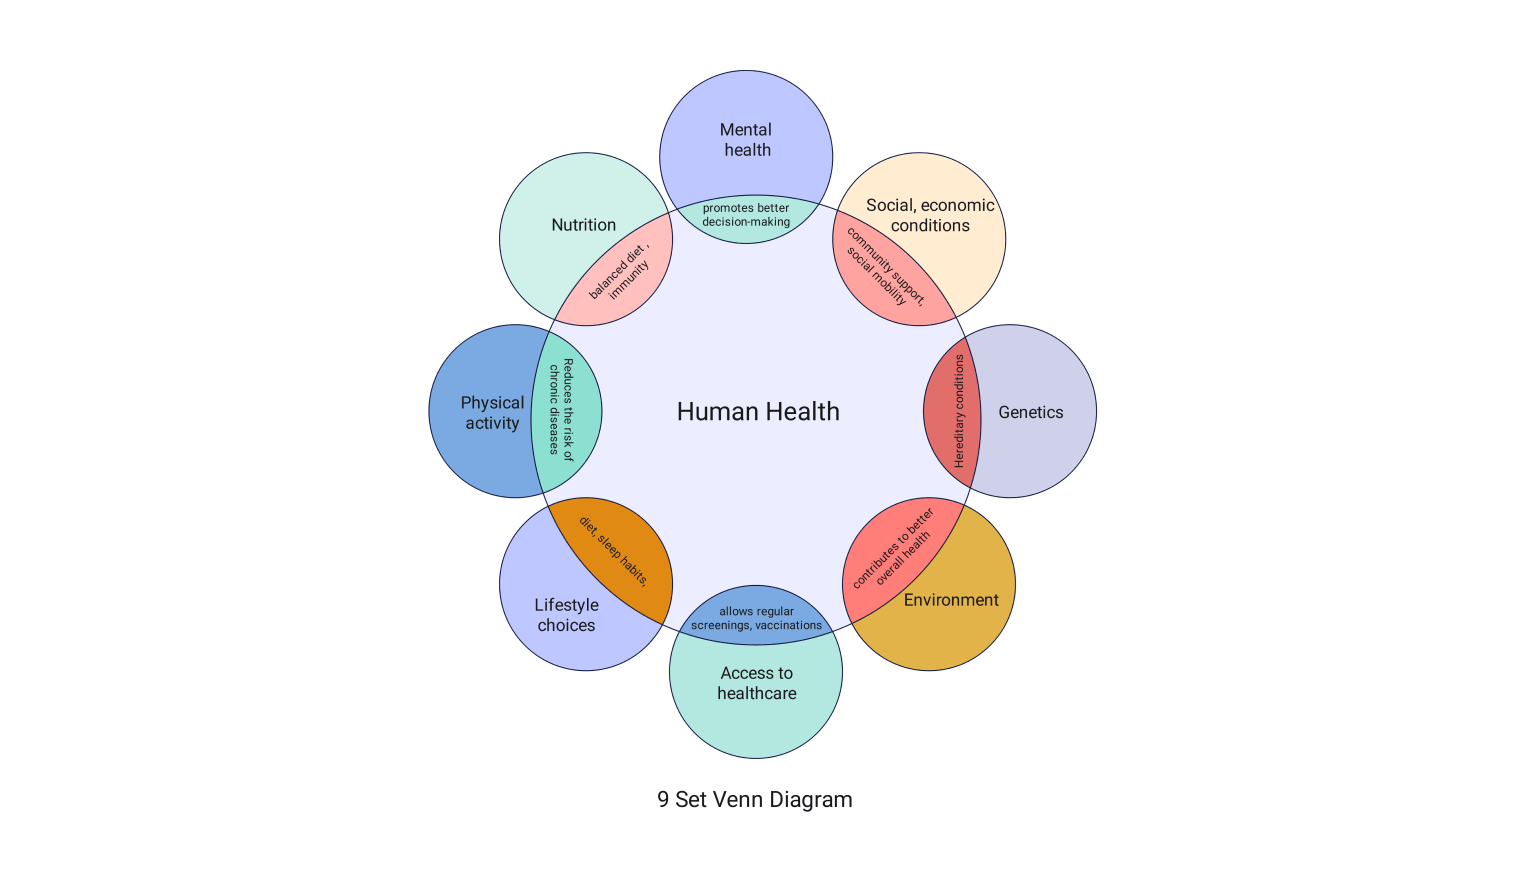
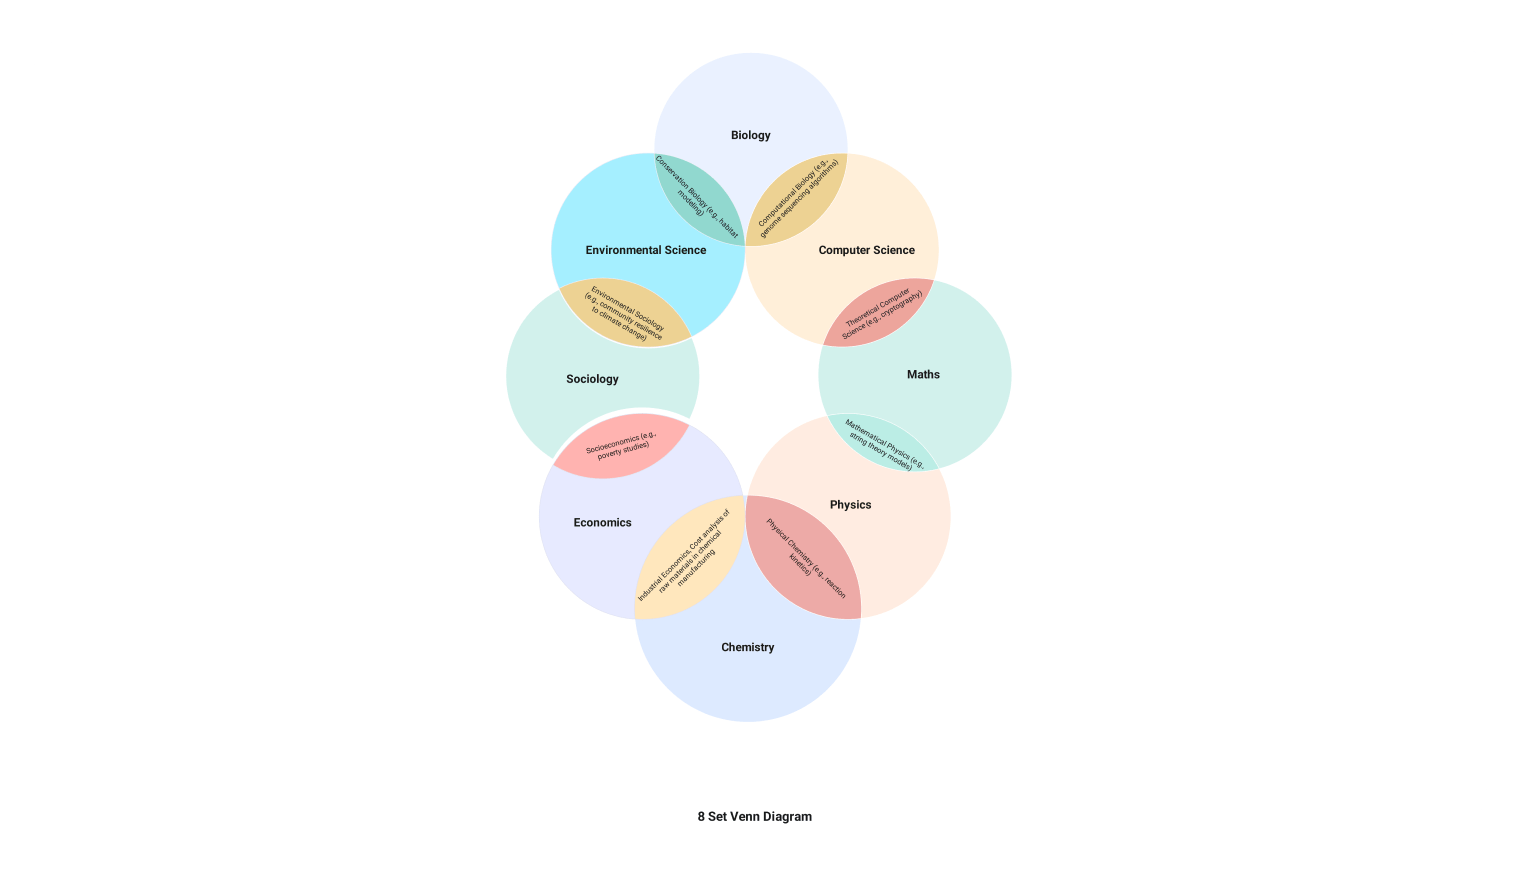
Related templates
Get started with EdrawMax today
Create 210 types of diagrams online for free.
Free Download Free Download Draw a diagram free Draw a diagram free Draw a diagram free