About this Annual Data Report template
This report template helps businesses showcase their annual financial achievements. It focuses on growth trends in revenue and assets. By using this layout, companies can easily explain complex data to investors and team members while maintaining a professional appearance.
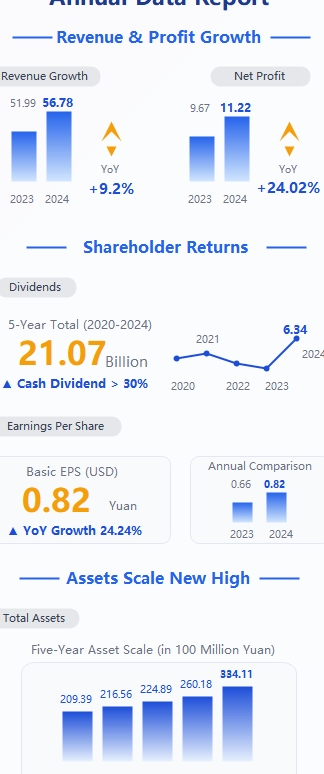
Revenue and Profit Growth
This section tracks the company's income and net earnings year-over-year. It highlights a steady rise in performance by comparing 2023 and 2024 figures to show clear financial progress for the organization.
- Revenue growth increased from 51.99 to 56.78.
- Year-over-year growth for revenue reached 9.2%.
- Net profit saw a significant jump to 11.22.
- Net profit YoY growth was 24.02%.
Shareholder Returns
This part details the rewards given to investors over a five-year period. It includes total cash dividends and basic earnings per share, which are critical indicators of the value provided to company shareholders.
- Total dividends from 2020 to 2024 reached 21.07 billion.
- Cash dividend percentage stayed above 30%.
- Basic Earnings Per Share (EPS) reached 0.82 Yuan.
- EPS grew by 24.24% compared to the previous year.
Assets Scale New High
Monitoring total assets shows how much the business has expanded its resources over time. This section uses a bar chart to display a consistent five-year growth trend that reached a new record high.
- Total assets grew to 334.11 in 100 million Yuan.
- The chart shows steady growth from 2020 through 2024.
- Asset growth reflects the company’s increasing scale and operational power.
FAQs about this Template
-
Why is tracking year-over-year revenue growth important?
Tracking year-over-year revenue growth is essential for measuring a company's success and market health. It allows business owners to see if their sales strategies are working over time. By comparing these figures, you can identify seasonal trends and potential risks early. This data also helps investors decide if the business is a safe and profitable place for their money.
-
How does a high dividend payout ratio benefit shareholders?
A high dividend payout ratio provides immediate cash flow to investors. It shows that the company is profitable enough to share its earnings instead of just reinvesting everything. For shareholders, this represents a tangible return on their investment and indicates financial stability. Consistent dividends often build long-term trust and loyalty, making the company's stock more attractive to conservative income-seeking investors.
-
What does a rising asset scale indicate about a business?
A rising asset scale suggests that a company is successfully expanding its operations and increasing its total value. It often means the business is buying more equipment, property, or technology to support future growth. High asset levels provide a strong safety net for the organization during tough economic times. It also gives the company more leverage when seeking loans or negotiating large contracts.
