About this Architecture Of A Smart Meter System
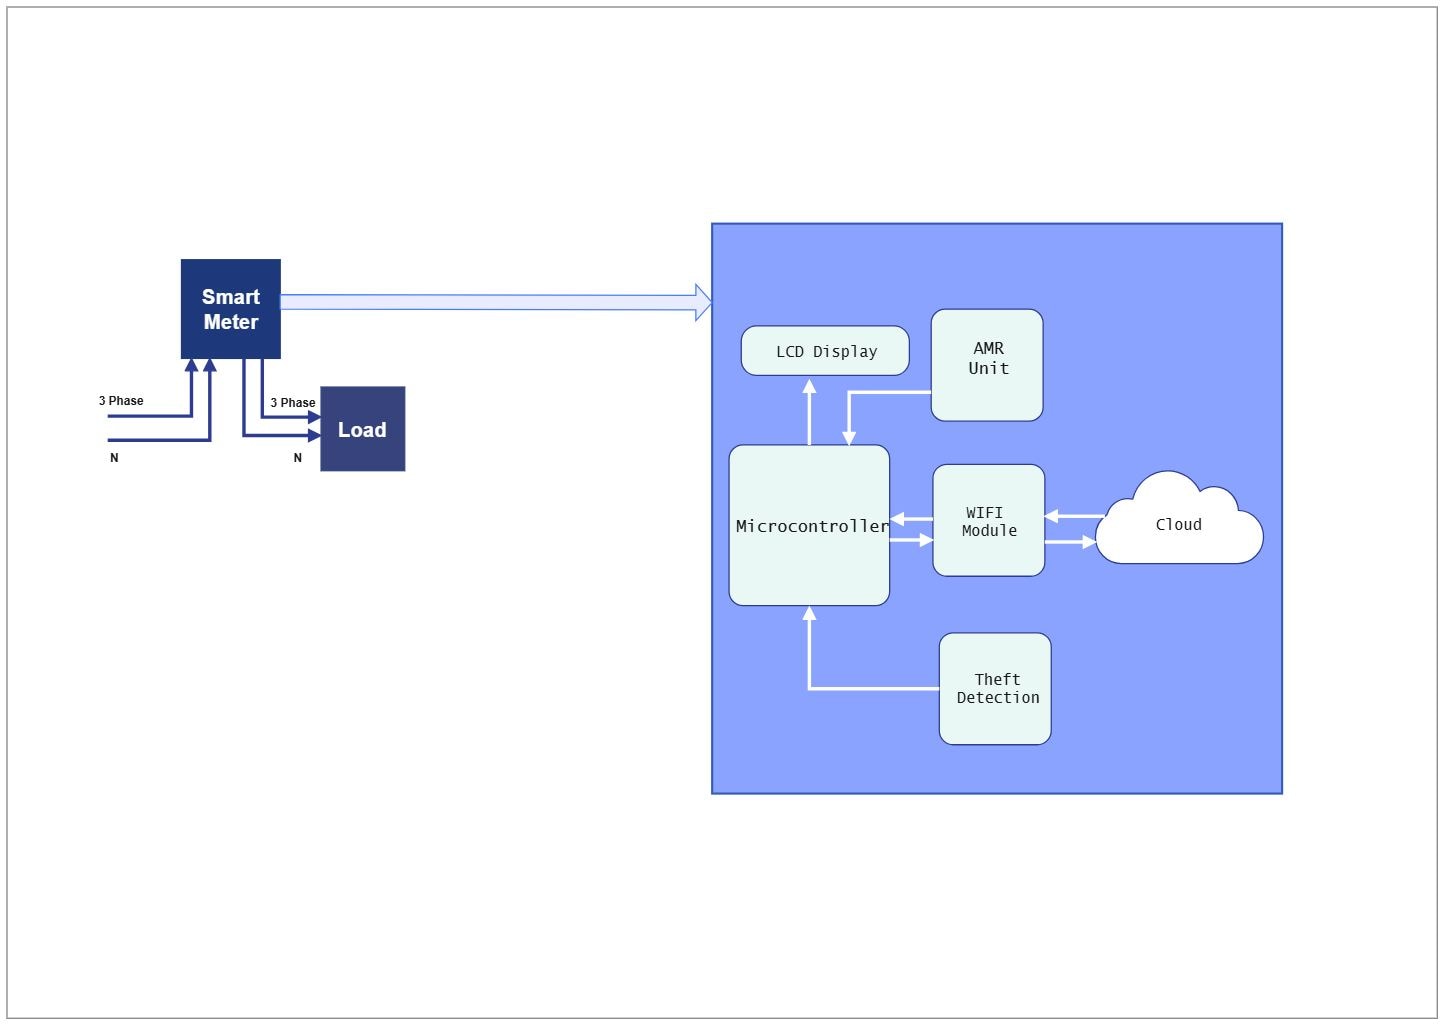
This diagram shows architecture of a smart meter system in a clearer structure, so the main layers or modules are easier to explain.
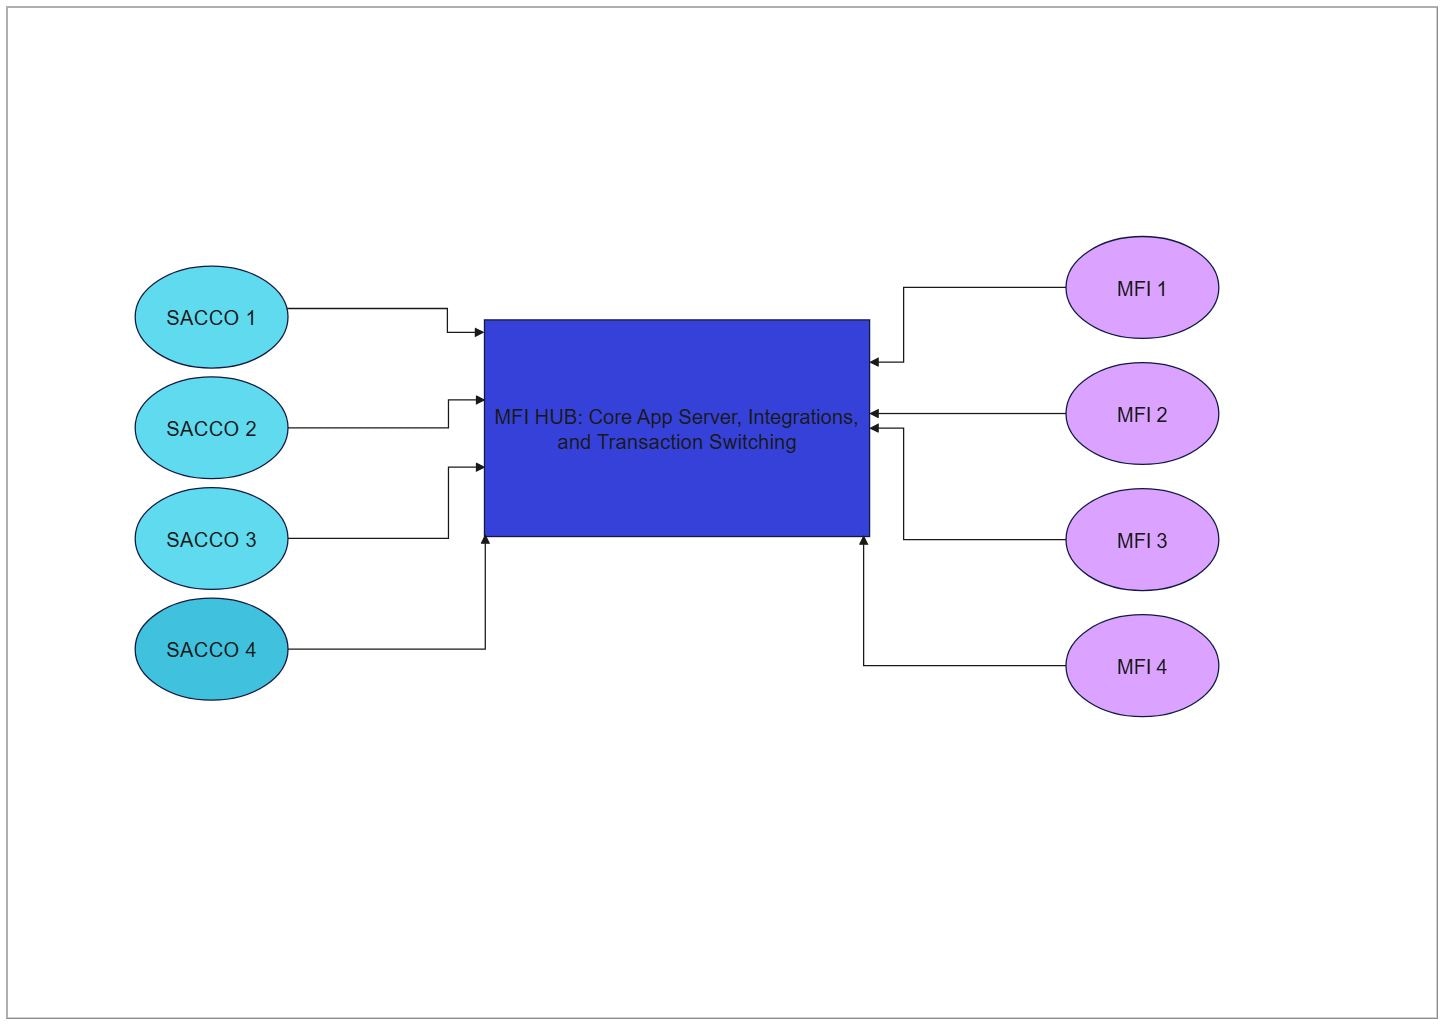
Detection Output Layer
The Detection Output Layer section groups the components that belong to this part of the architecture. In this diagram, it includes N, 3 Phase, Load, Smart Meter, which makes the boundary of the layer easier to explain when presenting how the system is organized.
- N
- 3 Phase
- Load
- Smart Meter
- Microcontroller
- LCD Display
- WIFI Module
- AMR Unit
FAQs about this Template
-
How do teams visualize Architecture Of A Smart Meter System architecture?
Teams usually visualize Architecture Of A Smart Meter System architecture with a layered diagram that separates core areas such as Detection Output Layer. This makes it easier to review dependencies, handoffs, and system boundaries, especially when architects need one view that shows how services, users, data, support layers, and technical responsibilities connect.
-
Can AI generate Architecture Of A Smart Meter System architecture diagrams automatically?
Yes, AI can generate a first draft of a Architecture Of A Smart Meter System architecture diagram, but it still needs human review. AI is useful for suggesting layers, flows, and component groupings, while engineers should verify the real services, security boundaries, data paths, naming, system dependencies, and support assumptions before using the diagram in delivery or documentation.
-
What is the difference between system architecture and application architecture?
The difference is mainly about scope. system architecture focuses on technical layers, service relationships, and operational structure, while application architecture usually describes broader software structure or behavior. Teams use system architecture views when they need to explain deployment logic, integration points, hosting layers, cross-system dependencies, and the way major technical responsibilities are separated.
-
What should a Architecture Of A Smart Meter System architecture diagram include?
A strong Architecture Of A Smart Meter System architecture diagram should include the main layers, core components, and the key data or request flow. It should also show where users, services, storage, external systems, controls, monitoring points, or support links connect, so readers can understand the design logic, ownership boundaries, and the path between major functions without guessing.
-
Which diagram type is best for documenting Architecture Of A Smart Meter System systems?
The best diagram type depends on the decision you need to support. A high-level architecture diagram works best for explaining the overall structure, while sequence, deployment, network, or microservices views help with implementation detail. Most teams start with an overview like this, then add focused diagrams for troubleshooting, onboarding, delivery planning, or support coordination.