Data flow diagram for movie recommendation system
Understand how a movie recommendation system works using this data flow diagram.
- All templates
- Data flow diagrams
- Data flow diagram movie recommendation
About this data flow diagram for movie recommendation
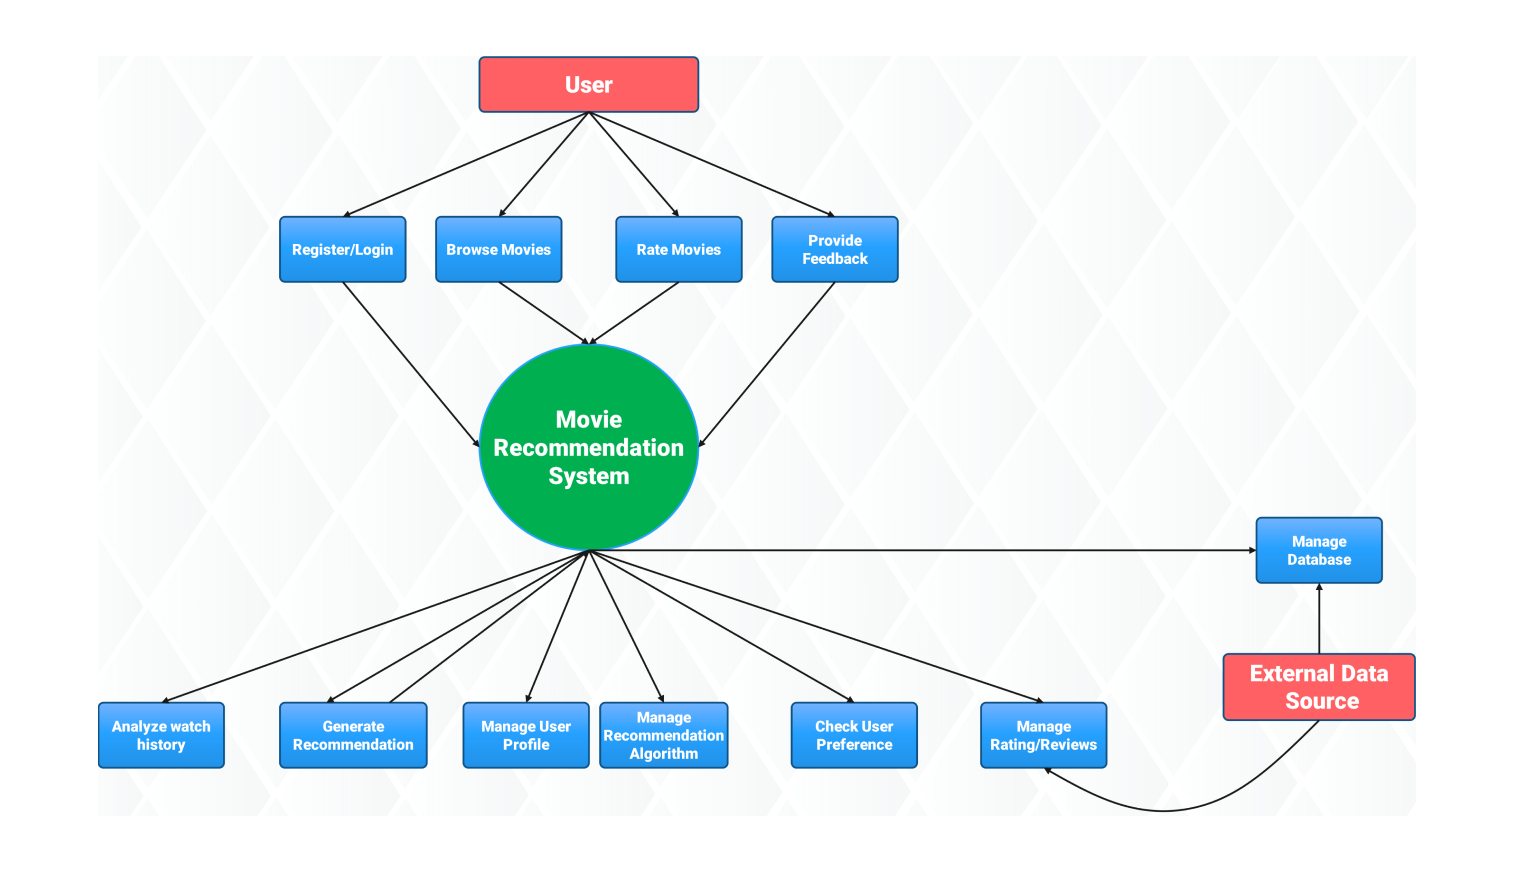
The data flow diagram (DFD) shows how the movie recommendation system shares information. It connects all parts that help provide personalized movie suggestions to users. The system begins when the user registers and logs in. Then, they can browse movies, rate them, and give feedback. The movie recommendation system tracks these activities to enhance its recommendations.
The system gives movie recommendations by looking at your watch history and preferences. The system stores user profiles. It tracks all ratings and reviews. This improves recommendations. The algorithm learns and gets better over time. User feedback and updates ensure suggestions stay accurate and relevant.
The system pulls extra information from external data sources. It gets movie details, reviews, ratings, and metadata. This helps improve its recommendations. The system connects to outside data sources. This helps to fully personalize the user experience.
The data flow diagram shows how data moves. First, it goes from users to the recommendation system. It processes watch records and preference data. Then, it manages user profiles and recommendations. The system works well together. Each part has a specific role in processing and transferring data. The DFD clearly shows how data moves in the movie recommendation system.
Related templates
Get started with EdrawMax today
Create 210 types of diagrams online for free.
Free Download Free Download Draw a diagram free Draw a diagram free Draw a diagram free