Data flow diagram for online quiz app
Understand the data flow of an online quiz app using this data flow diagram.
- All templates
- Data flow diagrams
- Data flow diagram online quiz
About this data flow diagram for the online quiz app
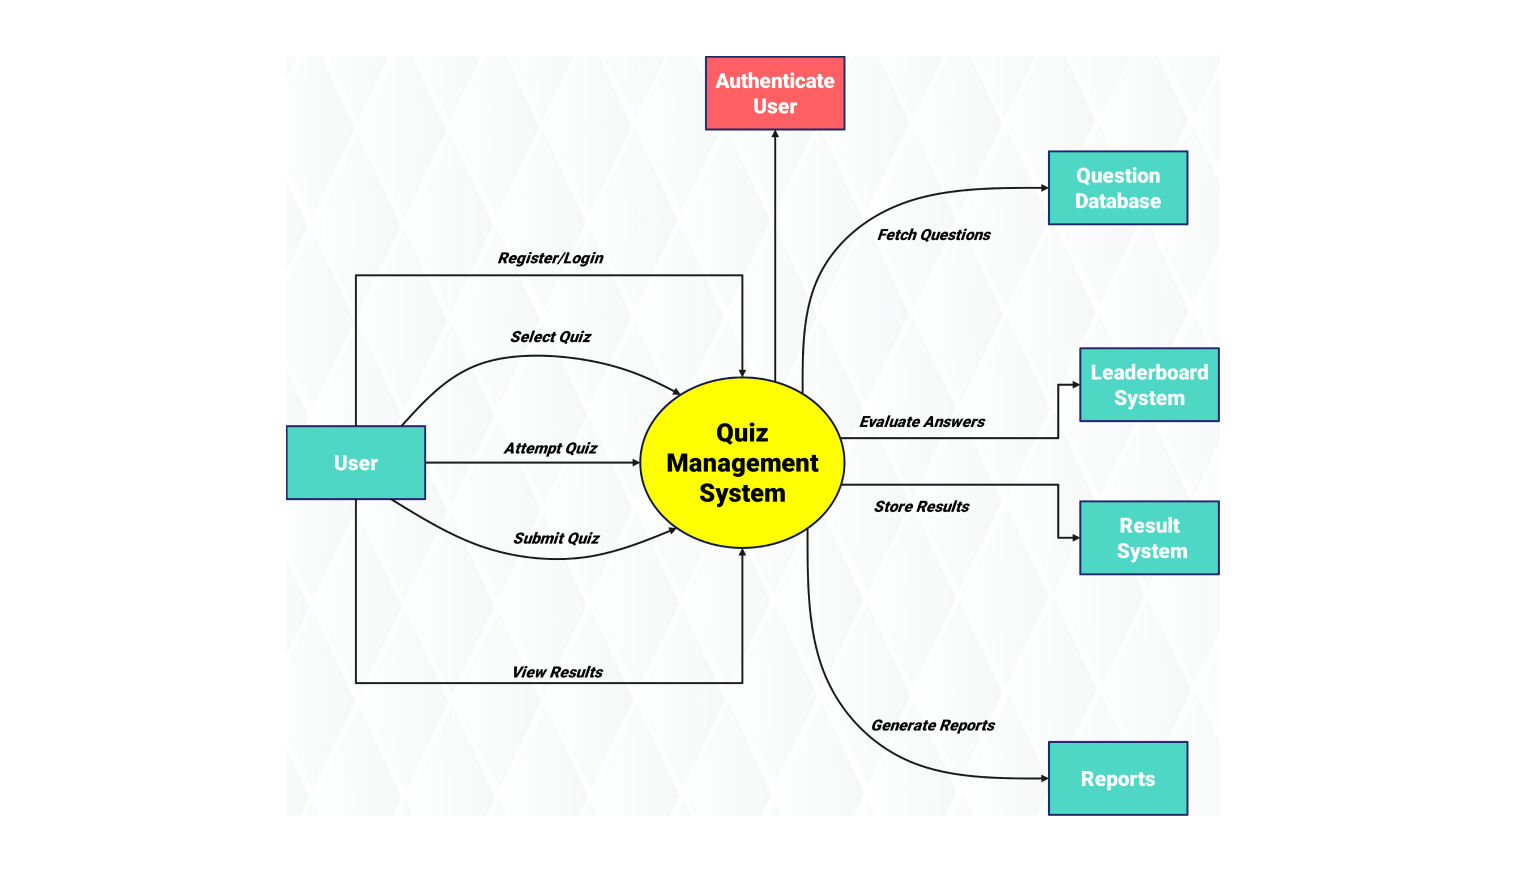
The data flow diagram (DFD) depicts how data moves between different program elements that manage quiz operations in the online quiz application. The system starts when a user connects to perform either registration or log in functions. Authenticated users can pick a quiz before answering the questions.
The quiz management system processes user responses by comparing them against established evaluation standards. The system gets questions from its database. This database has all quiz questions and their correct answers. The system stores evaluation results in a database after calculating user scores from their answers.
The resulting system shows the user's test results after the quiz evaluation process. The system provides users with a detailed performance review. It shows their correct and incorrect answer rates. The leaderboard shows how users rank against others. This makes the quiz more competitive.
The quiz management system makes reports from quiz results. Administrators and educators can access these reports to analyze performance and find areas for improvement. The data flow diagram shows how user input enters the quiz management system. It then goes to the question database. After that, it moves to the result and leaderboard systems.
This flow illustrates the steps of an online quiz application. The system works smoothly because each part has a specific job in processing and transferring data. The DFD presents an organized presentation of data movement within the online quiz application.
Related templates
Get started with EdrawMax today
Create 210 types of diagrams online for free.
Free Download Free Download Draw a diagram free Draw a diagram free Draw a diagram free