


Consuming massive datasets is the demand of today’s industries, from businesses to finance, computing technology, healthcare, and more. By 2027, the data visualization market is expected to be worth $19.2 billion with an annual 10.2% growth. To aid the demand, the market has launched several popular information visualization tools over the years.
One such tool is Graphviz, a standard open-source app that turns your syntax into graphs and network diagrams. In no time, its DOT-description model became a success among entry-level database designers and software engineers. Want to know more about whether this tool is truly a genius as the market claims? Keep reading this detailed Graphviz review.
In this article
What is Graphviz?
Graphviz, short for Graph Visualization Software, is an open-source module for data visualization. Developed by AT&T Labs Research, this tool is based on the DOT language, a simpler and straightforward syntax alternative.
It helps programmers depict structural information in the form of interactive graphs and network diagrams. This visualization helps them analyze, refine, and optimize codes accordingly. Typically, software engineers, network analysts, and database designers use Graphviz to visualize relational data and understand hierarchical structures.
- Automated layouts: Graphviz utilizes advanced algorithms to automatically convert datasets, whether complex or basic, into visually appealing graphs and other structured formats.
- Customization tools: It features various DOT descriptions that allow for customization of node appearance, labels, colors, fonts, and edges in the graphs.
- Multiple output formats: Graphviz supports multiple formats for your outputs, including SVG, PNG, PDF, and more. This helps you easily integrate visuals in documents.
- Integration: What makes Graphviz better than other programming solutions is that it can be integrated with multiple programming languages. You can use it with Python, Perl, and other web applications as per convenience.
- Problem-solving capabilities: Graphviz uses various auxiliary tools to visualize complex relational data into interface diagrams.
A Review of Graphviz’s Ease of Use
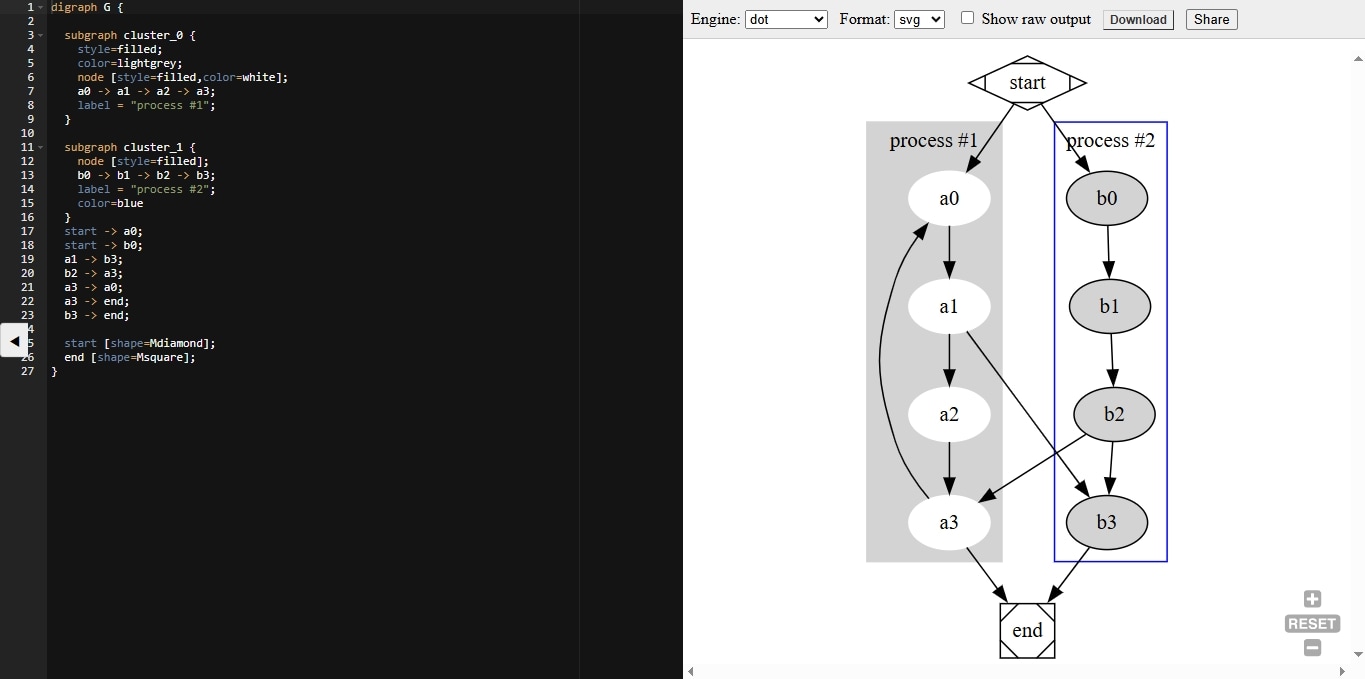
For starters, Graphviz uses DOT language to generate diagrams. It is plain language, easy to understand by both humans and computers. Unlike source codes, this language consists of very few syntax specifications; rather, it is built on nodes and links. Simply put, DOT is an abstract description for Graphviz’s nodes, edges, subgraphs, graphs, and clusters.
Compared to LaTeX and ConText, the DOT language itself is straightforward and does not have numerous keywords. So, if you are already familiar with the interface and language, accessing and using Graphviz doesn’t come as a problem.
However, if you are not, using this platform would demand a lot of patience and thorough training, as the execution of DOT in Graphivz is an entirely different story.
Take labels, for example. A label in Graphviz DOT is fixed with the edge, so if you have multiple parallel edges, the format becomes confusing and overlaps frequently. Similarly, the sequence of nodes follows no specific order. Rather, the DOT guide claims that the order partially relies on the graph and the discrete ranks in the code.
Plus, the constant glitches in the web version and the lack of a mechanism to manage the DOT files online add to the hassle. Instead, there might be are many better coding and non-coding alternatives like Mermaid, Notion, Plotly, etc, for certain users.
Graphviz’s Performance and Reliability
Graphviz is primarily known for data visualization. Backed by years of development and research, it delivers in identifying patterns and bottlenecks from your syntax and converting the refined DOT descriptions into interactive graphs. Let’s see how it performs in terms of speed and efficiency.
GraphViz's performance with smaller graphs and datasets is powerful. It is fast, has a vast gallery of directed and undirected graph samples, a playground-like space for live editing, and multi-format output. Moreover, its competitive filtering capabilities are why many consider it a standard visualization tool.
Plus, you don’t need an external data source to create graphs. That said, users have also experienced glitches and slower algorithms processing with complex and lengthy datasets. The threshold where you start to experience lag is around 1500 edges.
Moreover, despite the speed issues, Graphviz is a trustworthy alternative to produce visuals from complex and cyclic data structures. It has several graph layout programs to cover that. Graphviz DOT descriptions can make clear sequences of relational and hierarchical data while illustrating it in organized nodes, edges, and attributes.
Pros and Cons of Graphviz
Let’s see who Graphviz is best suited for and where it can be improved.
A Reliable GUI Alternative to Graphviz: Wondershare EdrawMax
Not ready to create diagrams using code? Understandable. Coding software like Mermaid and Graphvitz often seems unapproachable due to their hard syntax. And even if you use AI to generate code to feed these systems, errors and grammatical errors make rendering unreliable.
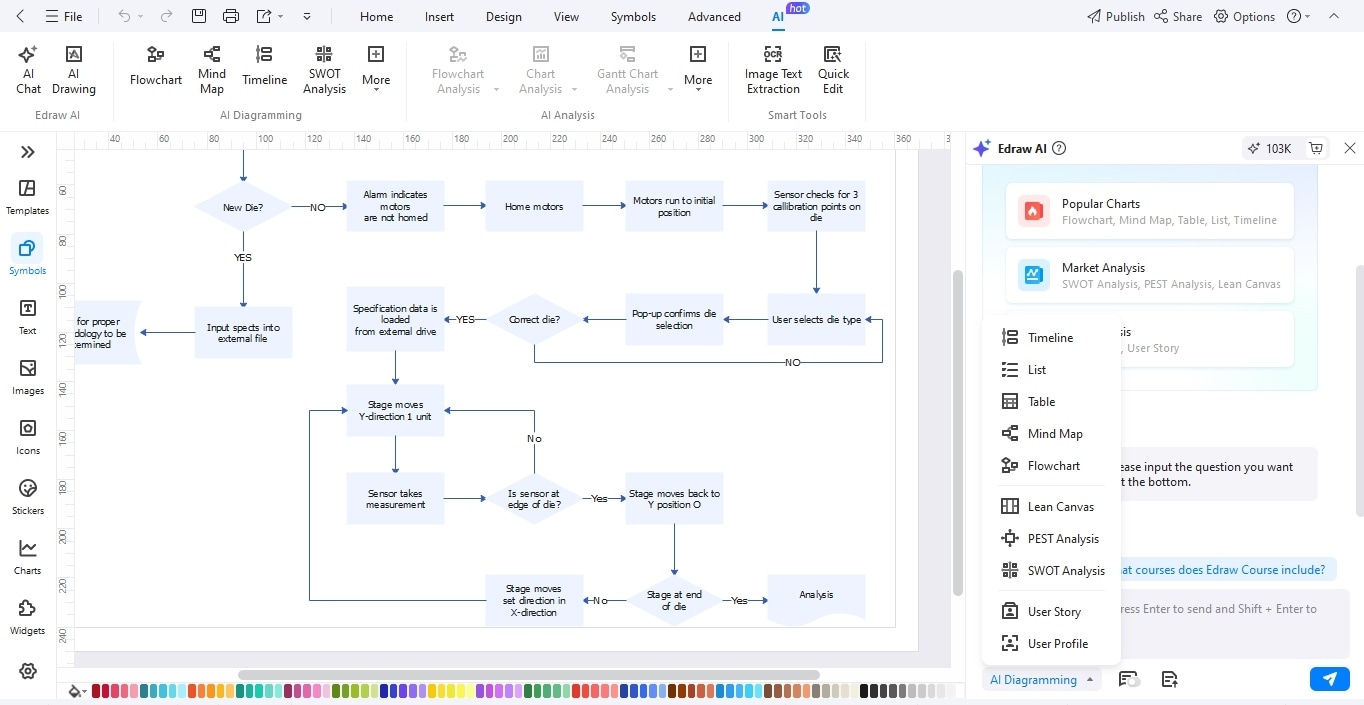
If so, consider no-coding, GUI software like EdrawMax. It is an intelligent solution that combines diagramming with AI. This tool helps you create infographics, refine existing diagrams, and analyze them for documentation. Not only this, but you also don’t have to worry about familiarizing yourself with the DOT language, syntax writing, and more.
- AI assistance: EdrawMax has a suite of AI tools for file analysis, summaries, chart analysis, and more. It also features a research companion that helps you write syntax, refine code, and correct errors.
- One-click diagram generation: With this tool, you can generate over ten types of diagrams with simple commands. Have no prompt skills? Don’t worry, EdrawMax’s prompt optimizer, AI templates, and reference files help you get accurate outcomes.
- Intuitive UI: EdrawMax’s interface is designed with beginners in mind. Its easily accessible controls and drag-and-drop canvas help you get started on this tool with no training required.
- Resourceful symbols: EdrawMax features a large library of resizable vector symbols, catering to various diagrams, including charts, graphs, floor plans, etc. You can also import and create new symbols for personalized diagrams.
- Template community: Don’t have the time to start from scratch? EdrawMax has a massive community of creators uploading their diagrams. You can always edit others’ work and upload yours in this space.
- Multi-platform support: EdrawMax doesn’t restrict you. It lets you import and export files from various platforms, including Visio, Word, PPT, XLSL, and more.
Conclusion
There it is - all about Graphviz data visualization capabilities. It is an excellent platform for users already familiar with the Graphviz interface and DOT description module. With this tool, you do not need extensive coding knowledge.
However, if you are new to it, wasting time learning the syntax and UI might not be the best idea. Rather, no-coding software with a GUI, like EdrawMax, can help you better. Its massive template community, symbol support, and AI assistance make visualization effortless.
Try its free version, you might like it.
AI Diagram Generator
Enter your prompt. Upload files if needed. Generate diagrams, charts, or slides instantly.


