Free activity diagram maker
Visualize and illustrate complex activity flows quickly with EdrawMax’s online activity diagram maker. Experience easy diagramming and create activity diagrams with a range of free templates.
Why Use EdrawMax Activity Diagram Maker?
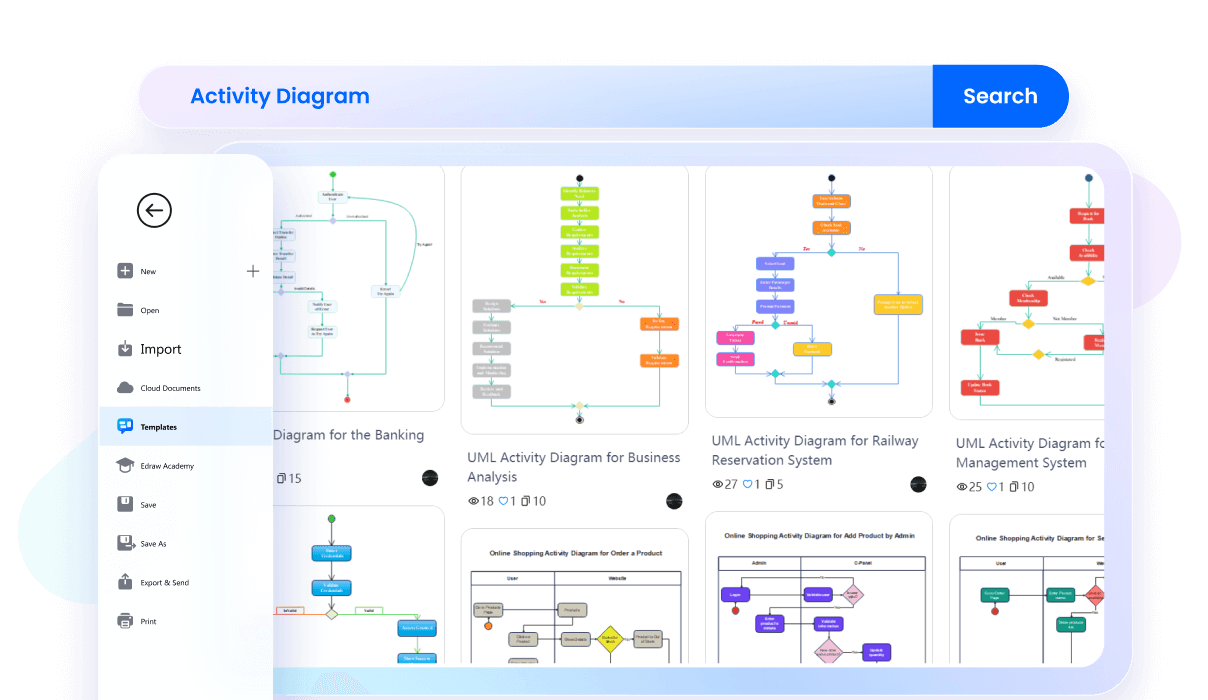
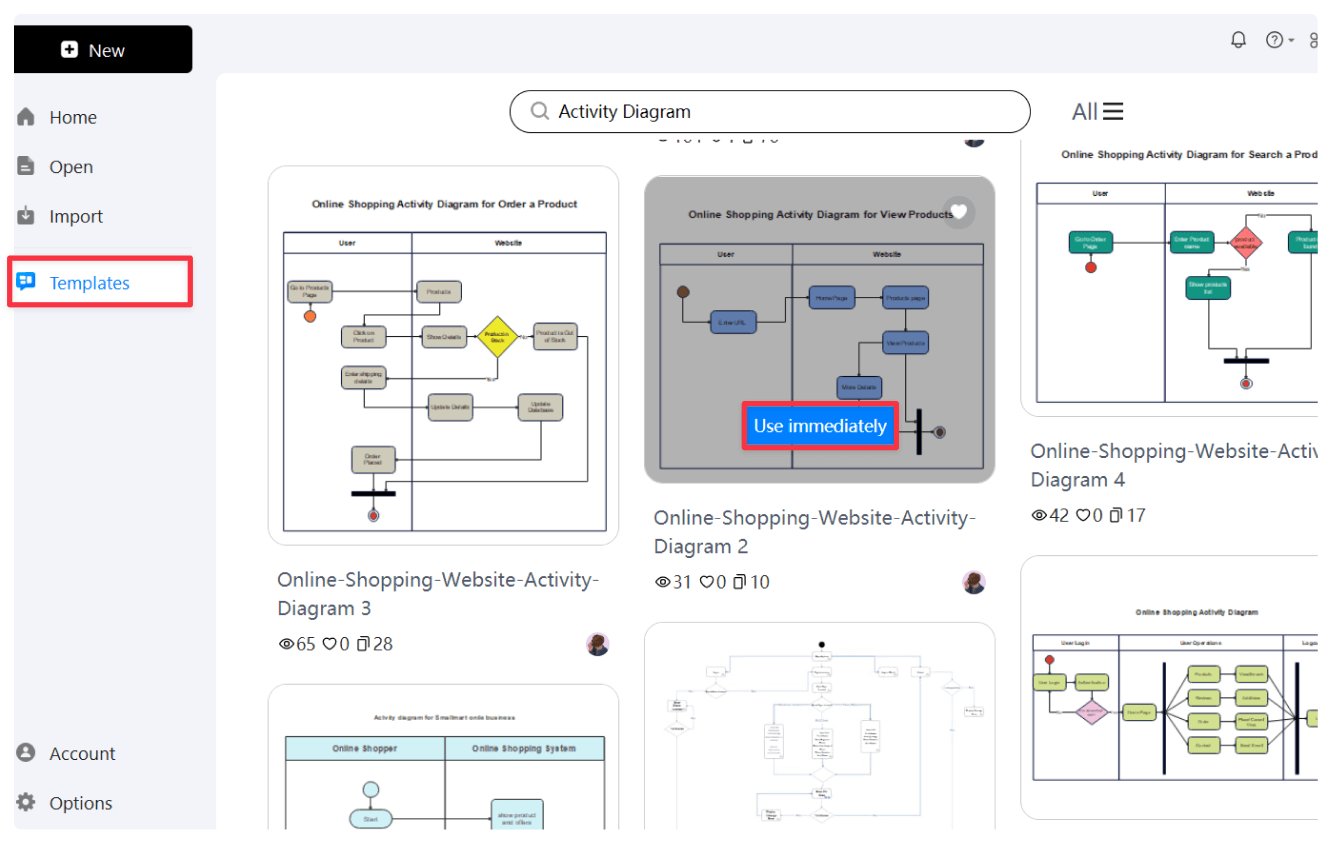
Why start from scratch when EdrawMax gives you a headstart with its pre-made templates? EdrawMax provides plenty of editable activity diagram examples that can change to your requirements. Find the perfect template for your project and customize it according to your organization needs.
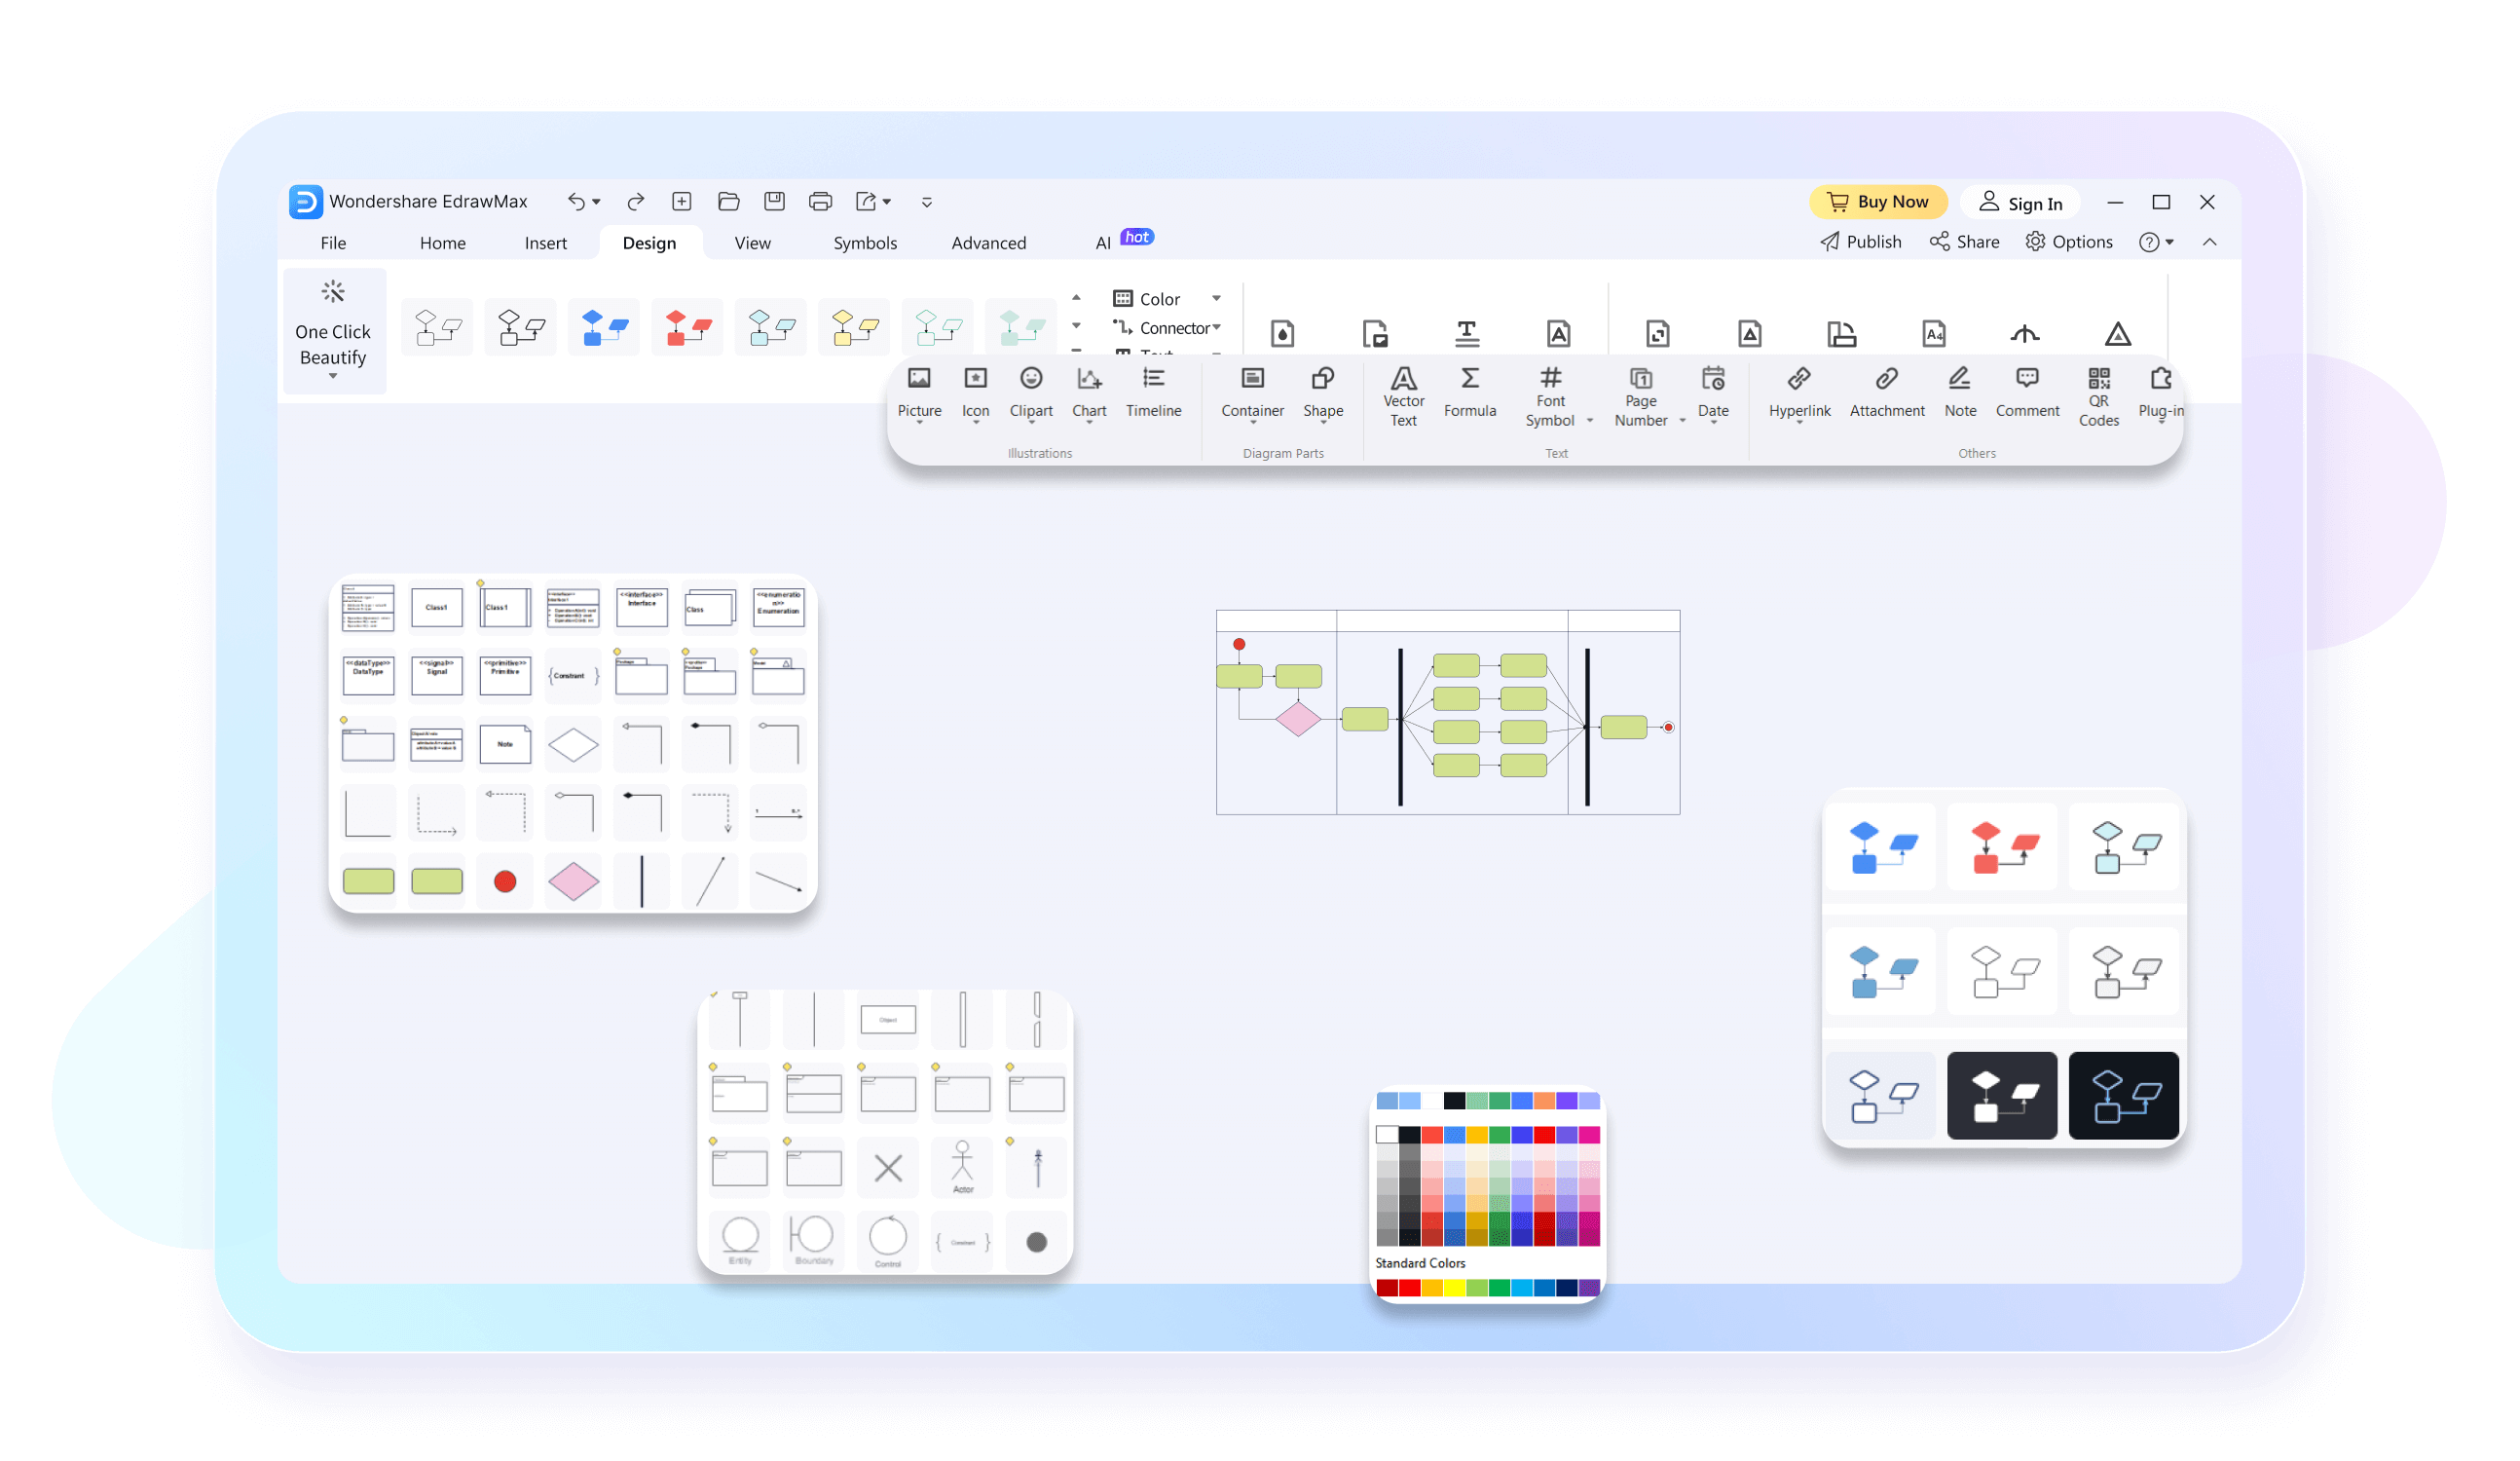
Creating activity diagrams with EdrawMax can be simple and fun. Its intelligent interface is designed with beginners in mind, who want professional results. The software has tons of simple drag-and-drop icons and symbols and well-attached connectors to model your activity diagram workflow efficiently.
With EdrawMax’s cloud services, always keep your team members in sync with what’s new in your diagram. Collaborate your workspace with peers through easy saving and sharing. Depict and convey information easily with anyone from business managers to developers for quick communications and updates.
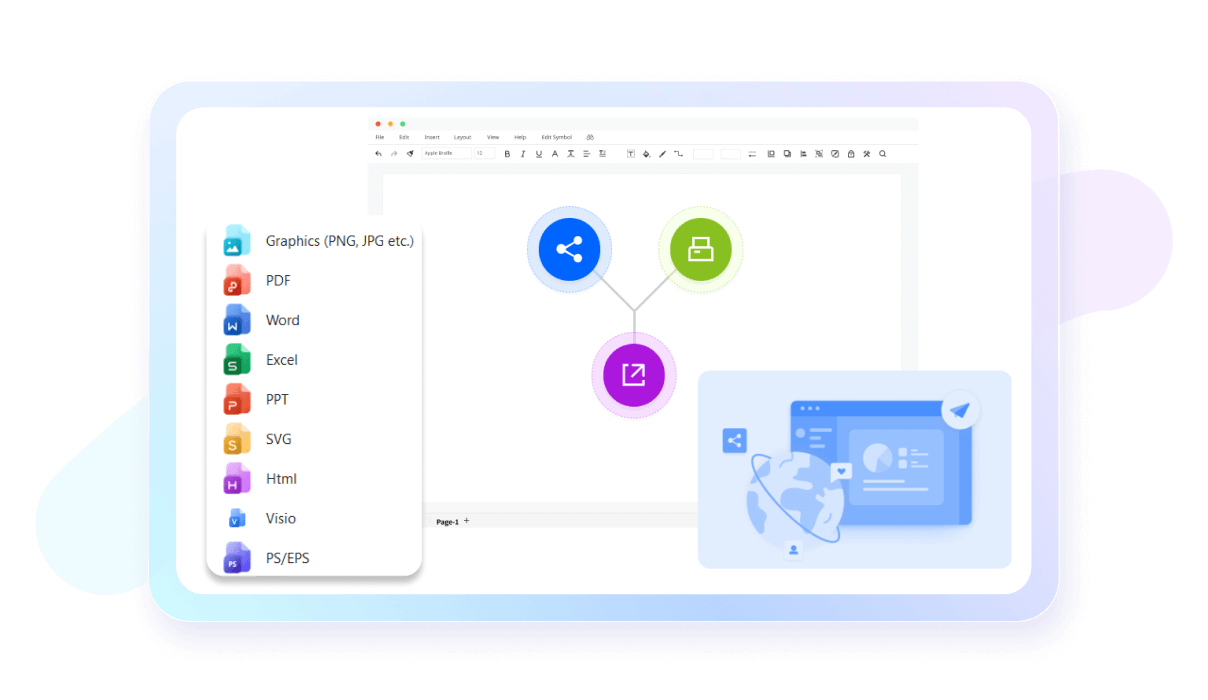
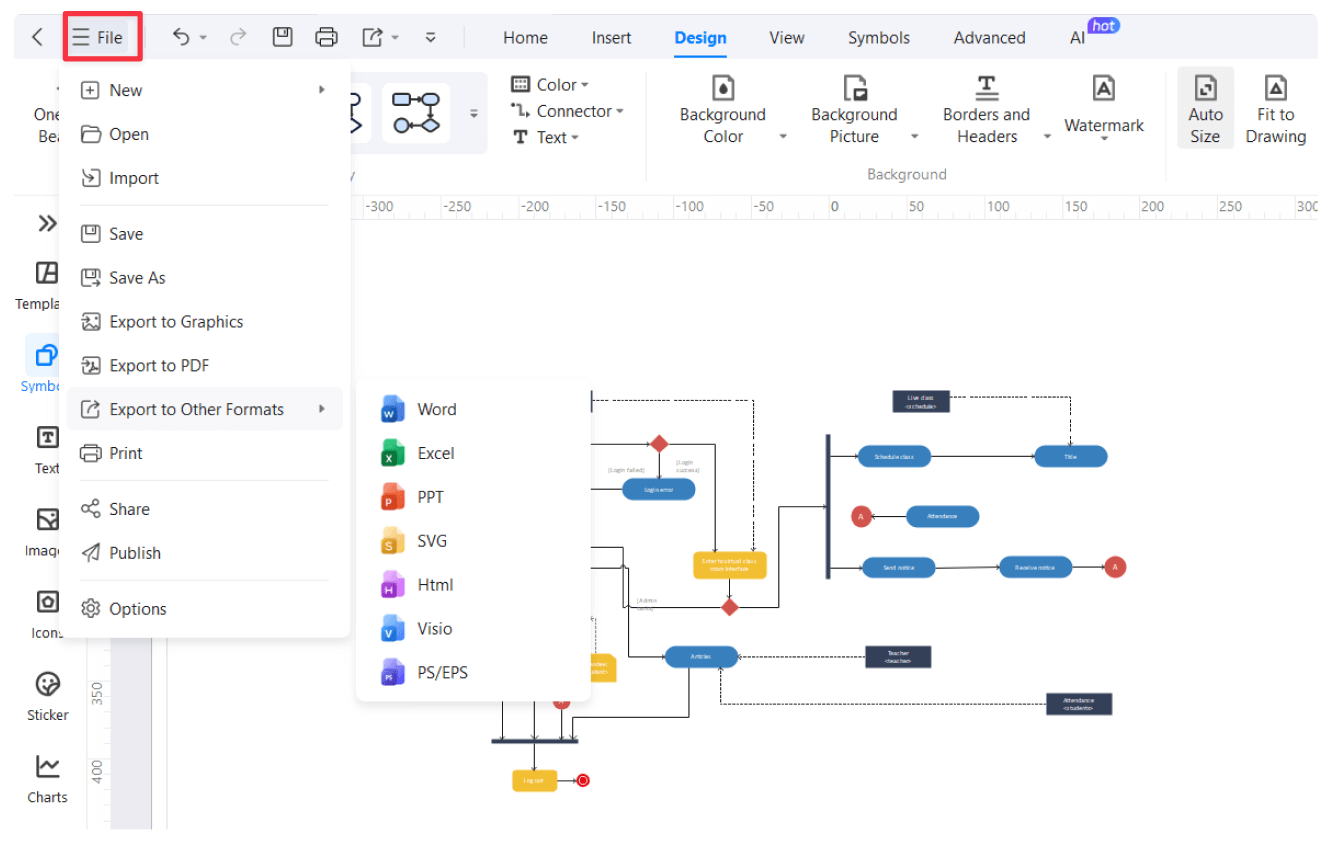
Export your file in various formats including Visio, PDF, JPG, PNG, and SVG ensuring easy cross-platform support and accessibility. This allows users flexible collaborations with team members working on different platforms or preferring varying formats.
EdrawMax offers various high-precision features like auto-aligning for accurate designs, ensuring both visual appeal and functional efficiency in various spaces.

EdrawMax's user-friendly interface and intuitive design tools make floor planning accessible to all, from experienced architects to first-time users, fostering creativity and turning visions into reality effortlessly.

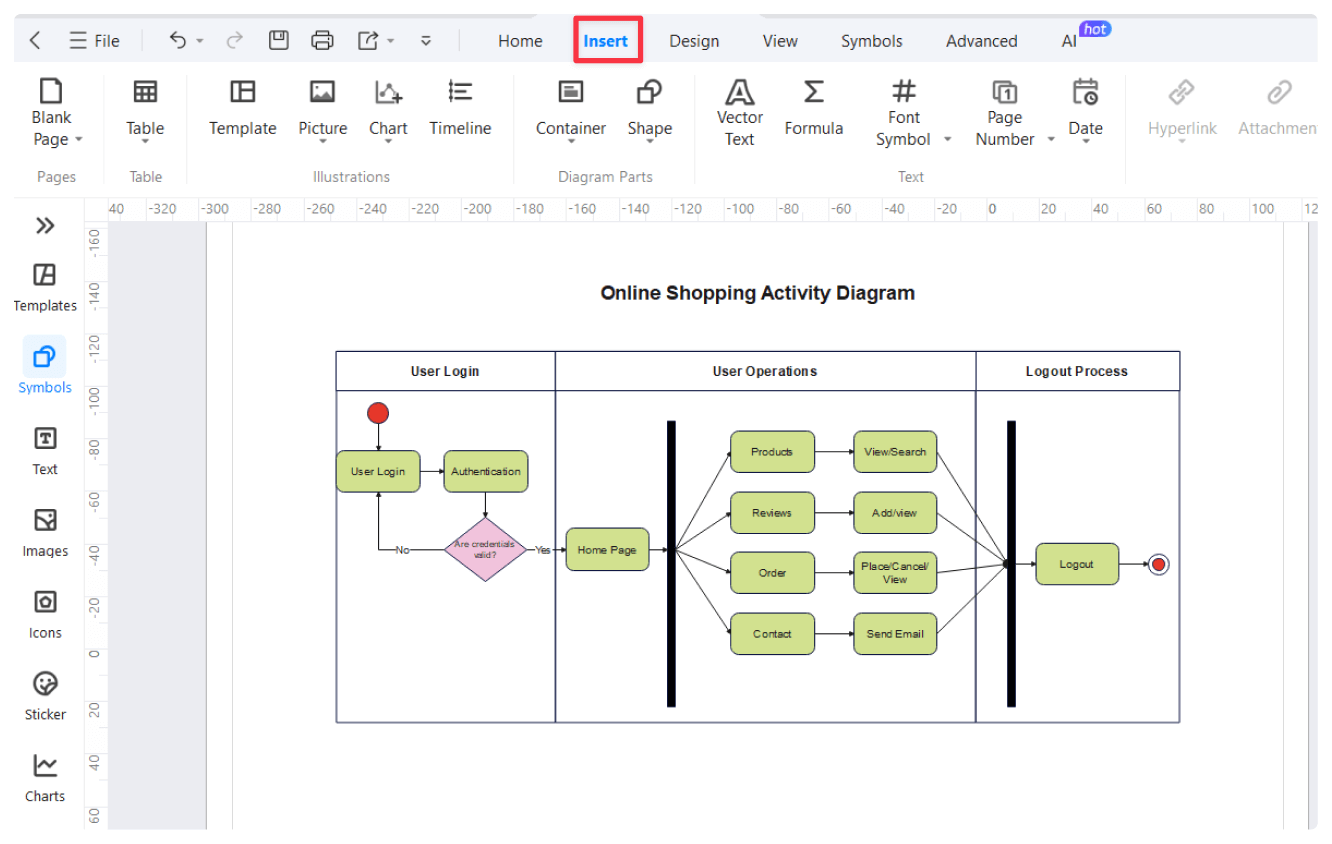
How to Make an Activity Diagram in 3 Simple Steps
What our users say
More Activity Diagram Tools
Discover more AI-powered diagram makers to boost your productivity.
FAQs About EdrawMax Activity Diagram Tools
-
How do activity diagrams differ from standard flowcharts?Activity diagrams specifically focus on the flow of control and data between activities, whereas flowcharts are more general. They excel at showing parallel processes and complex logic in system behaviors, making them essential for developers and business analysts mapping out operational procedures and software logic.
-
What is an activity diagram?An activity diagram is a visual representation used in UML to describe the flow of activities within a system. It illustrates the sequence of actions, decisions, and concurrent processes, much like a flowchart. It is particularly useful for modeling business processes or the logic behind complex software operations and workflows.
-
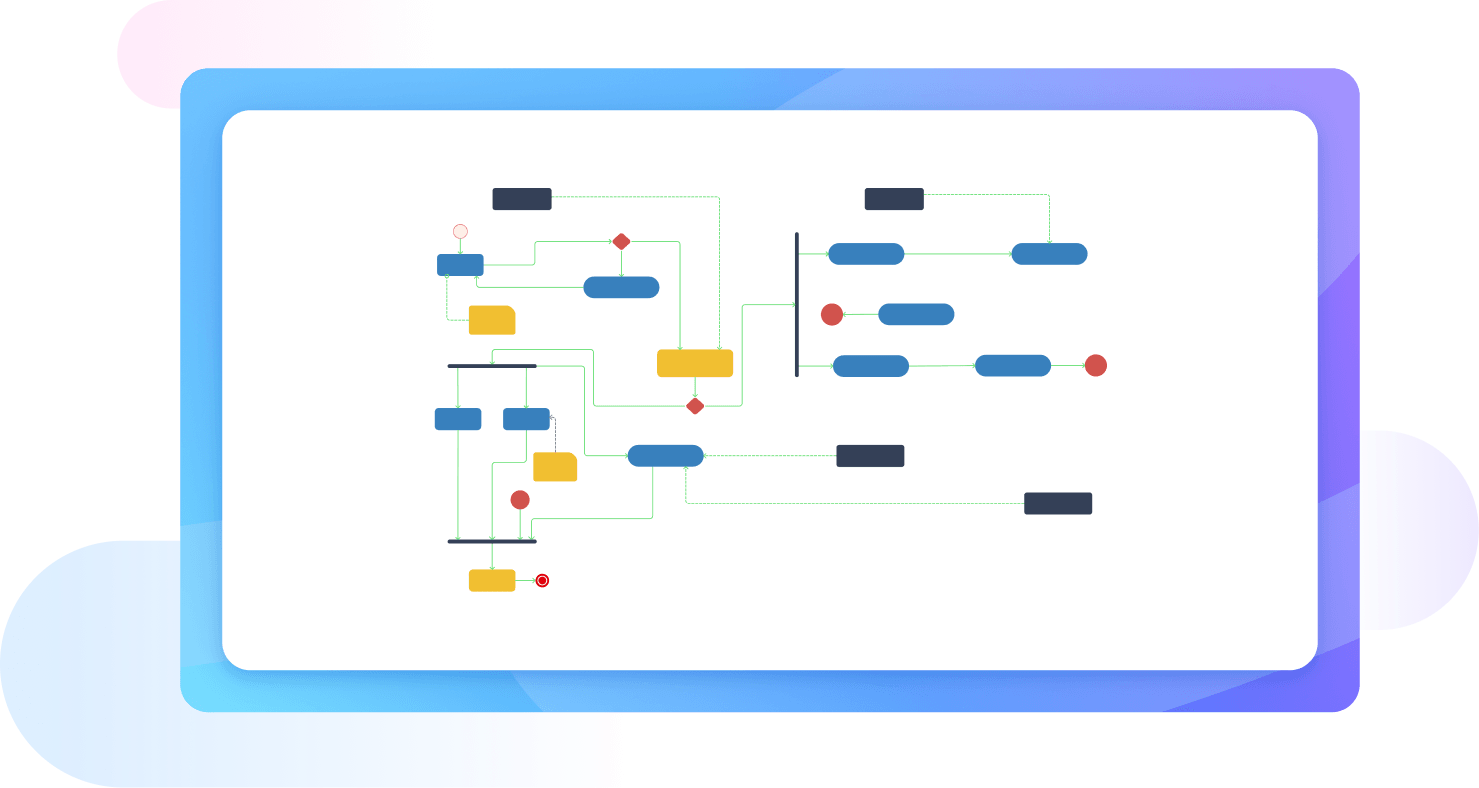
What are the main components of an activity diagram?The primary components include activity nodes (actions), transitions (arrows), decision diamonds, and start/end markers. Additionally, synchronization bars represent forks and joins for parallel tasks, while swimlanes organize activities based on the actors responsible. These elements work together to provide a clear overview of how a specific process flows from start to finish.
-
What is the purpose of a decision node?A decision node, represented by a diamond shape, indicates a point in the process where the flow can take different paths based on a specific condition. Each outgoing branch is usually labeled with a guard condition. This helps developers and stakeholders understand the logic and various outcomes of a system's behavior.
-
What are swimlanes in an activity diagram?Swimlanes are vertical or horizontal partitions used to group activities according to who performs them. By categorizing actions into specific lanes, you can clearly see the responsibilities of different actors, departments, or system components. This makes the diagram easier to read and helps identify bottlenecks in organizational or technical workflows.
-
What do fork and join nodes represent?Fork nodes are used to split a single flow into multiple concurrent activities that happen at the same time. Conversely, join nodes bring those parallel flows back together into one single path. These symbols are essential for modeling multitasking and ensuring that all parallel processes complete before the system moves forward.
-
What is the difference between an activity diagram and a sequence diagram?An activity diagram focuses on the flow of control and activities within a process, emphasizing "what" happens. In contrast, a sequence diagram focuses on the chronological interaction between specific objects and "how" they communicate via messages. Use activity diagrams for logic flow and sequence diagrams for detailed object interactions.
Learn about Activity Diagram
Stop drawing. Start describing.
AI diagramming isn't just text-to-diagram.
AI now understands any input, fetches live data, adapts through dialogue, and works everywhere.
Free Activity diagram templates from EdrawMax