


Think of a library as a system full of decisions. Would a user be permitted to borrow? Is the book available? Is a fine due? Each answer to a question. Every response gives way to an action. This is broken down in an activity diagram of the library management system. It captures the flows, steps, and choices.
The library management activity diagram gives you a transparent view of how your library really operates. It demonstrates the interaction between librarians, users, and systems. These diagrams do not attach tasks to a list. They are a description of how the system works.
In this article, you are going to learn how to draw a clear UML activity diagram with the help of roles, actions, and decision points. Let's get into it!
In this article
What is an Activity Diagram for a Library Management System?
A UML activity diagram depicts how activities in a system occur. Every activity is a result of another according to some regulations or decisions. Consider it as a flow chart only of software or systems.
How It Works in a Library System
In a library, everything is done in a rhythm. A user logs in. They search for a book. They borrow or return it. The system updates records. Each of these steps is shown in an orderly manner as an activity diagram of library system. It throws light on who, what, and when. This assists in the behavior of the system.
How It's Different from Other UML Diagrams
In contrast to a use case diagram, which only indicates who interacts with the system, activity diagrams give what happens in the process of this interaction. A class diagram is data and structure-oriented. An activity diagram is action- and flow-oriented.
Core Components of a Library Activity Diagram
We now know what activity diagrams are, so let's move to their building blocks. All the library activity diagrams have five key parts that collaborate to chart out complicated workflows. These aspects make abstract processes become clear in visual representations.
Initial Node: The Starting Point
Any library process has an origin. This starting point is the first node. This may be in library language when a student walks to the counter and states, I want to borrow a book. It is the seed that initiates all the things. This node is typically depicted as a solid black circle.
Activities: The Work That Gets Done
The meat and potatoes of your diagram are the activities. Think of them as the steps in a recipe. Every activity is a particular action of a person. Some examples are the ability to search the online catalog, check membership, scan barcodes, or update the database. These are shown in the form of rounded rectangles on your diagram.
Decisions: The Fork in the Road
Your process is a decision where choices are taken depending on the circumstances. You use diamonds to represent them. There are many exit points in each of the decision points. There is a way that may result in success and another way that results in a different activity. These decision diamonds assist you in mapping all the possible scenarios.
Merge/Join Nodes: Bringing Paths Together
There are times when various processes must converge and then proceed. Merge nodes are used to join paths. Join nodes guarantee that all the necessary conditions are fulfilled, and then the process proceeds. They stop workflow incompleteness.
Final Node: Mission Accomplished
The last node shows the successful completion of your process. It's the "FINISH" line. In library terminology, it is when a book has been returned. This node will normally be depicted as a black circle with a border indicating the end of the workflow. It is your way of saying, We did it! and the process is complete.
Samples of Library Management Activity Diagrams
Activity diagrams can only be best understood through practical demonstrations. EdrawMax's templates demonstrate the ways of visualizing the library processes. We are going to look at some of these templates and how they cope with typical library situations.
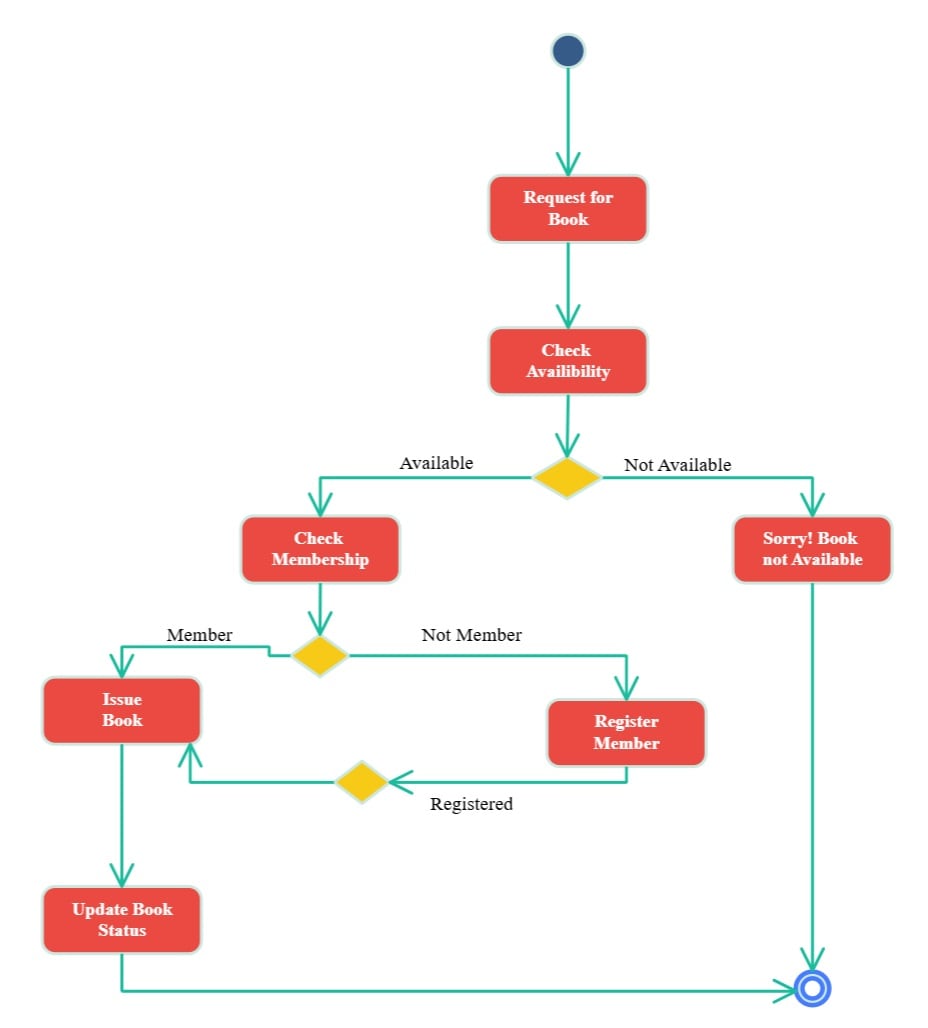
UML Activity Diagram for Library Management System
This UML activity diagram for library system represents the overall procedure of book borrowing. This begins with a user requesting a book. The procedure deals with two primary situations. This template would be ideal when the library is trying new management systems. It provides decision points and alternative paths.
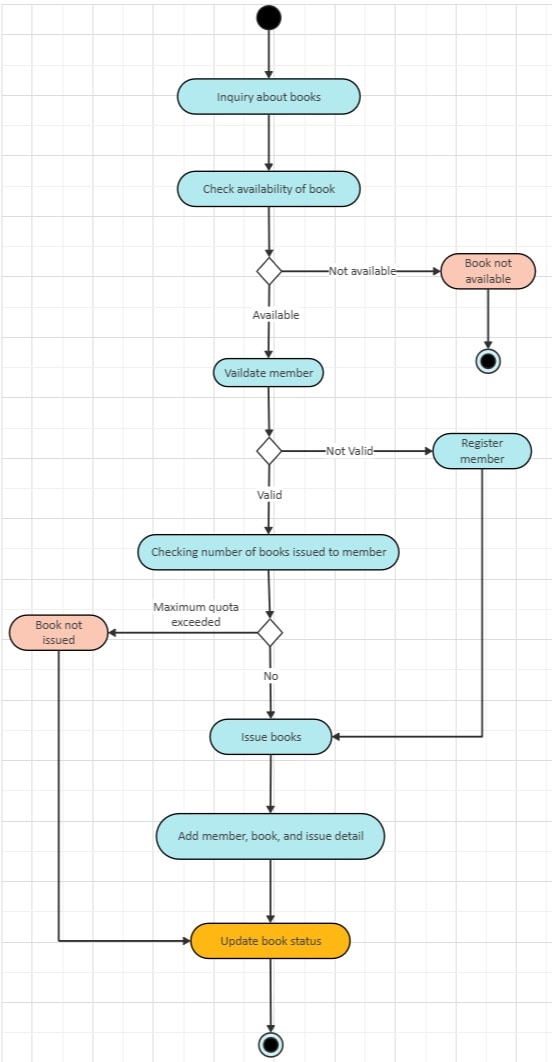
Enhanced Book Issuance Activity Diagram
The following diagram shows a more detailed process of issuing books. It starts with a book query and involves a check of availability. The registration of the new member is incorporated in the process flow. The template is useful in libraries whose membership systems are complex or whose lending procedures are automated. It comes in handy in training new employees.
How to Create an Activity Diagram for a Library Management System in EdrawMax
Samples demonstrate what can be done, but that is just a beginning. To create your own, you need a tool to assist you through all the steps. With EdrawMax, you can design an activity diagram of library management system. It makes the process simple with its built-in shapes, templates, and export capabilities.
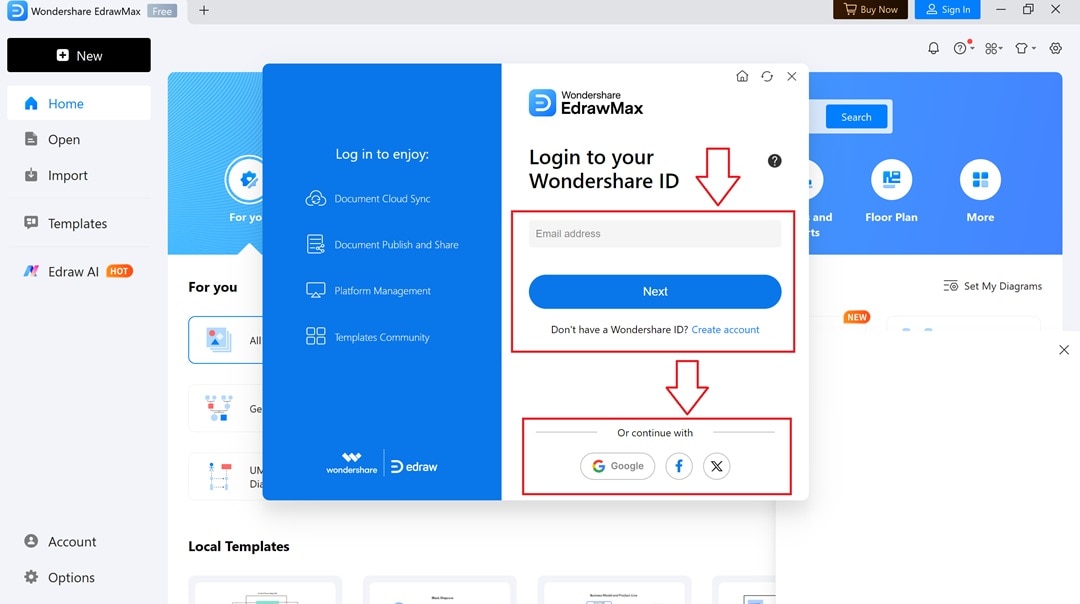
Step 1 Launch EdrawMax and Sign In
- Open EdrawMax on your desktop
- A login pop-up will appear on the main interface
- Enter your Wondershare ID email address
- Press Next to continue or pick Google or Facebook to sign in.
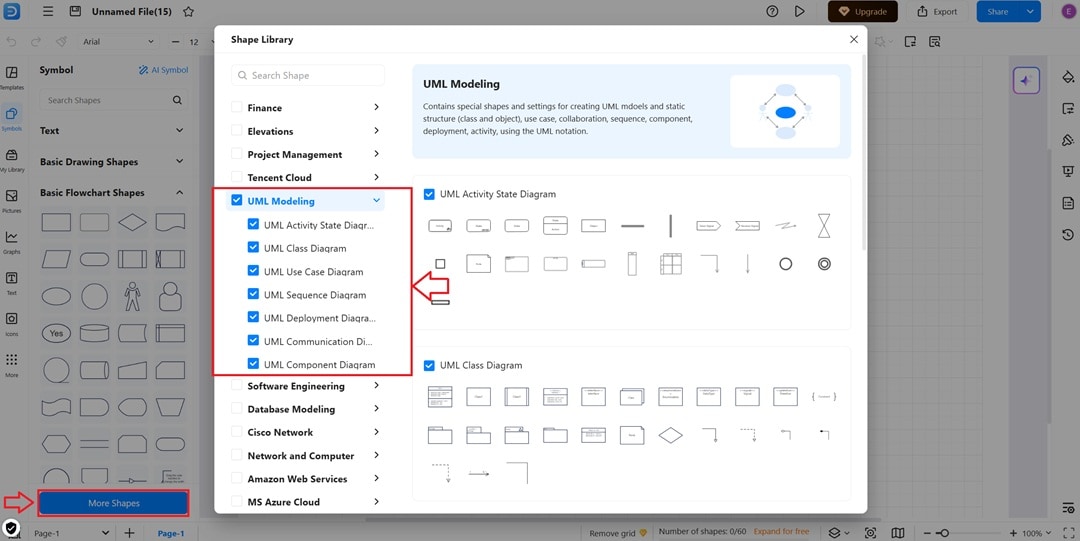
Step 2 Access UML Modeling Shapes
- To open a blank canvas, just click the New button.
- On the left sidebar, there is a button for More Shapes.
- Locate and pick UML Modeling in the Shape Library dialog.
- Ensure you check the UML Activity State Diagram.
- Click on the OK button to place these shapes in your workspace.
Step 3 Build Your Activity Diagram
- Drag and drop activity symbols
- Start with the initial node for the Request for Book
- Use diamond shapes for decision points like Available and Member
- Make use of arrows to indicate the direction of flow.
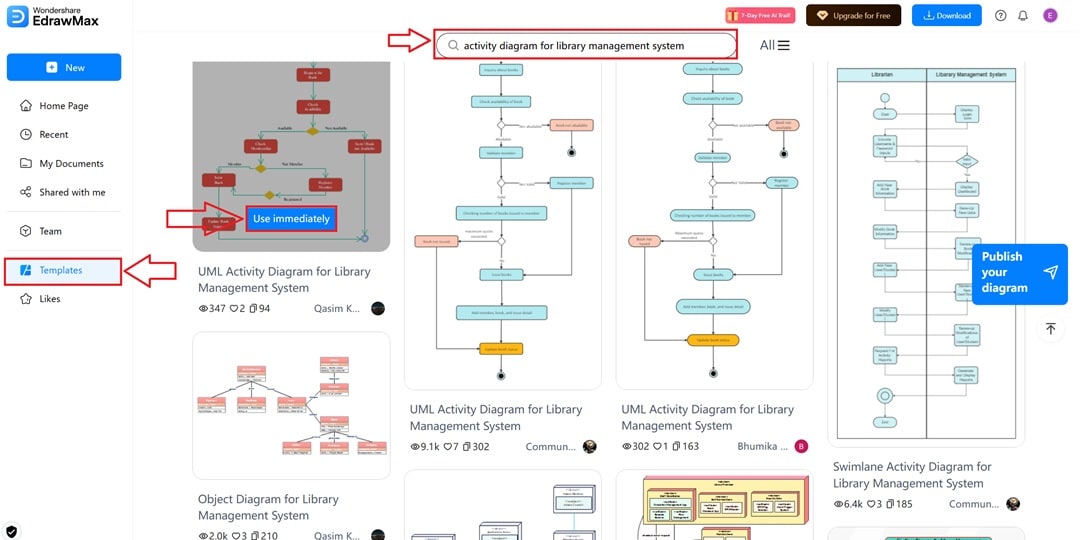
Step 4 Explore Templates for Inspiration
- Select Templates from the sidebar
- Type activity diagram for the library management system in the search bar
- Pick the suitable template
- Click Use immediately
- The template will be opened so that it can be customized
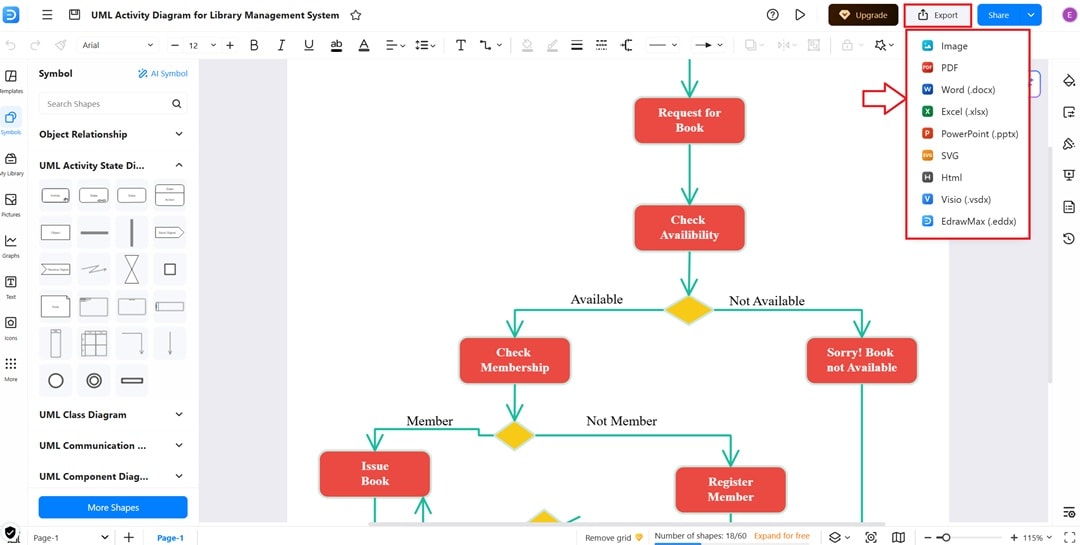
Step 5 Save and Share Your Diagram
- Click the Export button in the top right corner
- Select the file format you wish to use in the dropdown box.
- Select from options like PDF, Word, Excel, PowerPoint, or Image
- To save the diagram, press the format of your choice.
- Your library management activity diagram is complete to share.
Benefits of Using Activity Diagrams in Library Systems
Here are some tips that you can follow to create a flawless restaurant use case diagram:
Improved Communication
The activity diagrams act as a universal language among non-technical and technical employees. Librarians are able to communicate with IT teams through non-technical terminology. Workflow can be reviewed and approved by the stakeholders before execution. This understanding increases the comprehension and enhances the cooperation between the departments.
Clear Process Visualization
Activity charts convert complicated library processes into visual schemes that are simple to grasp. They demonstrate all the phases of a process. This visual method will enable the staff to learn quickly how one task relates to the other. When new employees are able to see the whole picture, they can learn the procedures quickly.
Process Optimization
Activity diagrams expose the existing workflow inefficiencies. Managers are able to identify areas in which processes can be simplified. It can be tested on the scenarios more easily due to the visual form. Process change can be tested by teams before implementation. This will increase the efficiency of libraries and enhance user experiences.
System Integration Planning
Activity diagrams aid in the planning of how various systems interact. IT teams are able to integrate library software with other systems. The diagrams ensure that all the systems facilitate the desired workflow. Such planning will avoid expensive errors in implementing the systems.
Wrapping Up
That brings us to the end of our guide, but now the actual work starts. You now know how each work is preplanned into a seamless workflow, whether it is searching for a book or updating records. In case you intend to build a library system, a library management activity diagram will provide a clear map to follow.
The library management system activity diagrams break down complex processes into visual stories that all can easily follow. EdrawMax gives you an edge with its easy-to-use interface and templates. With the right software, you can create diagrams that are precise and professional.
The path to better library management starts with a single diagram. Begin yours today!
AI Diagram Generator
Enter your prompt. Upload files if needed. Generate diagrams, charts, or slides instantly.


