


A restaurant’s workflow relies heavily on speed, uptime, and reliability. Customers expect their food to arrive promptly, with high-quality and transparent payment details. In this environment, waiters, cooks, managers, and cashiers coordinate multiple processes simultaneously. If any step falters, the entire dining experience suffers.
To address this complexity, companies use UML activity diagrams to clarify workflows and streamline operations.
An activity diagram visually represents activities in sequence and identifies the responsible roles for each task. This article demonstrates an activity diagram tailored for a restaurant management system, highlighting its purpose and implementation. Additionally, it provides three real-world examples and shares best practices for creating clear, professional diagrams.
In this article
What is an Activity Diagram for a Restaurant System?
Activity diagrams are UML diagrams used to represent the dynamic flow of an activity. State diagrams illustrate an object's status. In contrast, activity diagrams focus on sequences and decision-making in processes.
In a restaurant management system, activity diagrams can:
- Show the customer journey from arrival to departure.
- Demonstrate ordering and serving processes between waiters and kitchen staff.
- Monitor simultaneous tasks, such as multiple dishes being prepared at once.
Activity diagrams help by showing processes from a high-level view. They assist:
- Helps developers in designing better POS (Point-of-Sale) and ordering systems.
- Restaurant managers evaluate efficiency and address bottlenecks.
- Staff trainers grasp step-by-step workflows.
An activity diagram links system design with how things actually work in the real world.
Main Components of the Restaurant Activity Diagram
Uniform notations are used in an activity diagram. Here’s the breakdown for restaurant operations:
Initial Node
- This is shown as a full black circle.
- The beginning of the workflow.
- Example: Customer enters the restaurant.
Activities
- Shown as rounded rectangles.
- Represent individual tasks.
- Examples: Take Order, Cook Meal, Serve Dish, and Generate Bill.
Decisions
- Represented by diamonds.
- Show branching based on conditions.
- Example: Dine-in or Takeaway?
Forks and Joins
- Bars that represent parallel activities.
- Example: Two cooks preparing two different dishes concurrently.
Swimlanes
- Models with vertical or horizontal partitions dividing tasks.
- Sample lanes: Patron, Server, Galley, Cash Register.
Final Node
- A bull’s-eye symbol.
- Indicates the workflow is complete.
- Example: Customer leaves after payment.
Object Flows
- Dotted arrows for the movement of items.
- Example: Order trips from the Waiter to the Kitchen.
Examples of Activity Diagram for a Restaurant System
Activity Diagram for Restaurant Payment
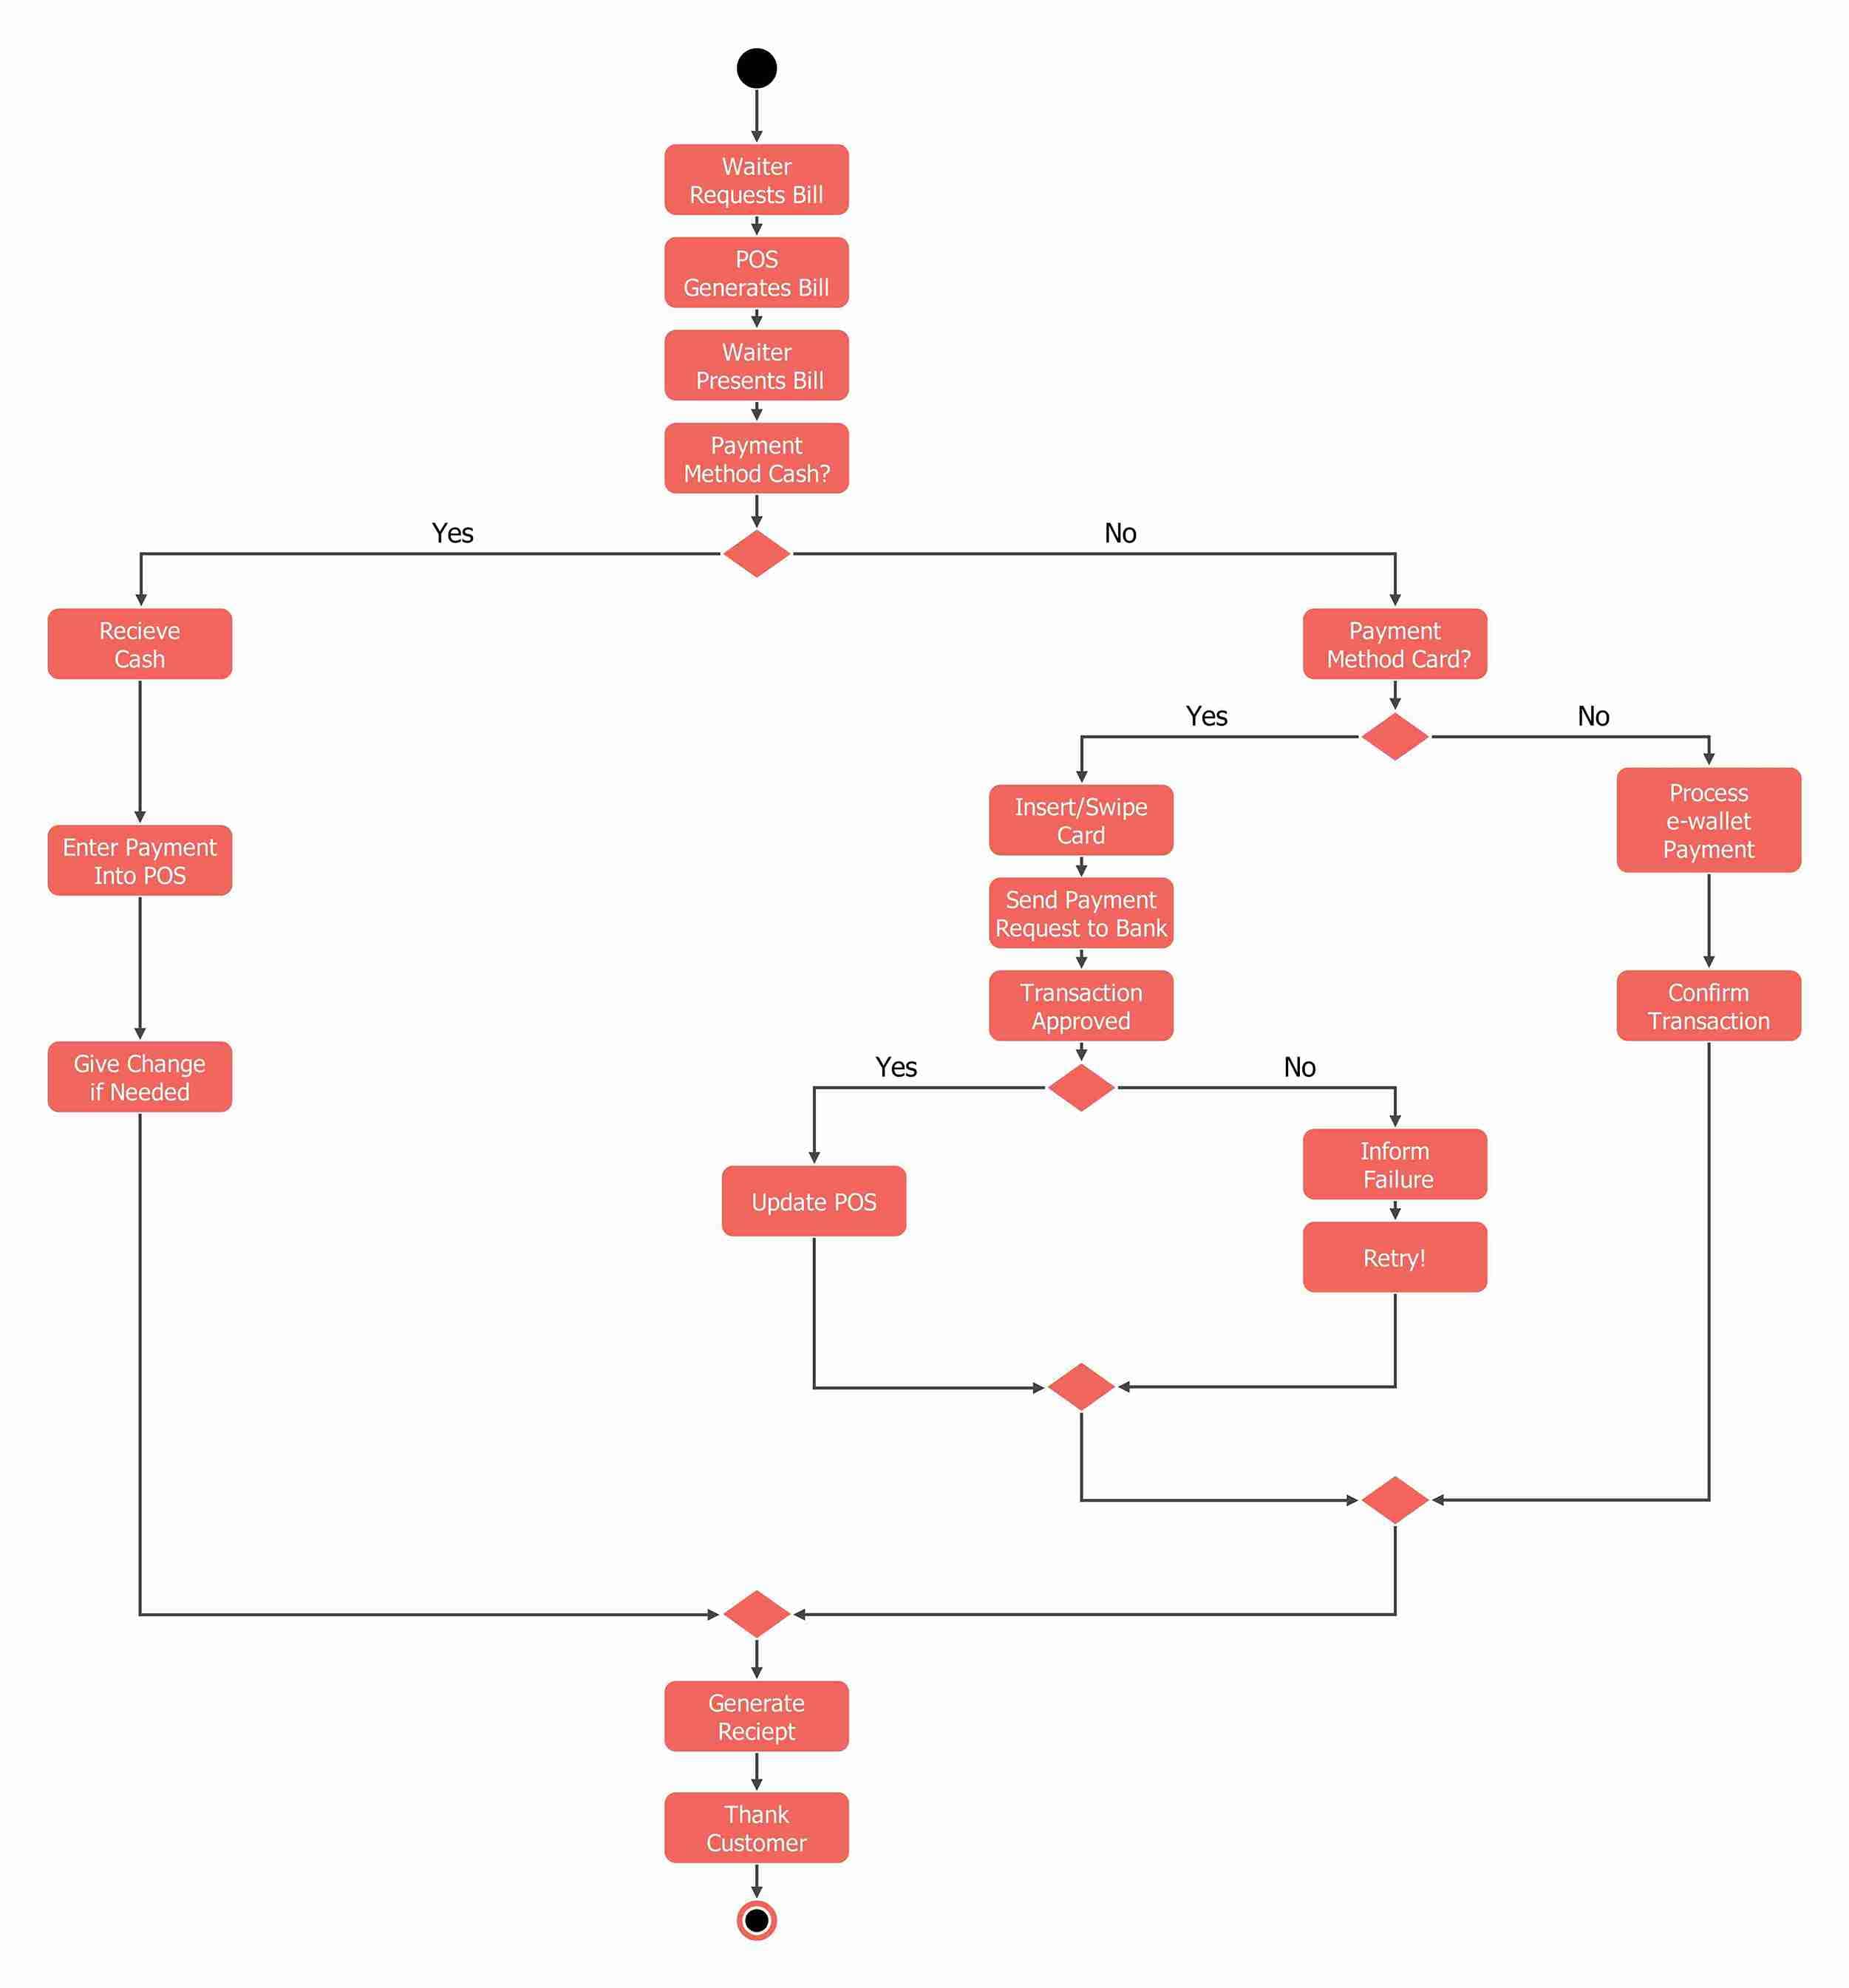
This activity diagram shows the restaurant's payment process after the customer asks for the bill. The bill created by the POS is first presented by the waiter. Based on the payment option selected, it can follow three paths: cash/card/e-wallet.
- For cash payments, you key in the amount, make change if necessary, then go back and ring it into the POS.
- When a card transaction succeeds or fails, it's either a confirmation or a retry.
- E-wallet payments are confirmed digitally.
When receipts and customer acknowledgments are created, all payment flows merge. This ensures accuracy and a smooth experience for consumers. That's key for every type of transaction.
Activity Diagram for Restaurant Inventory
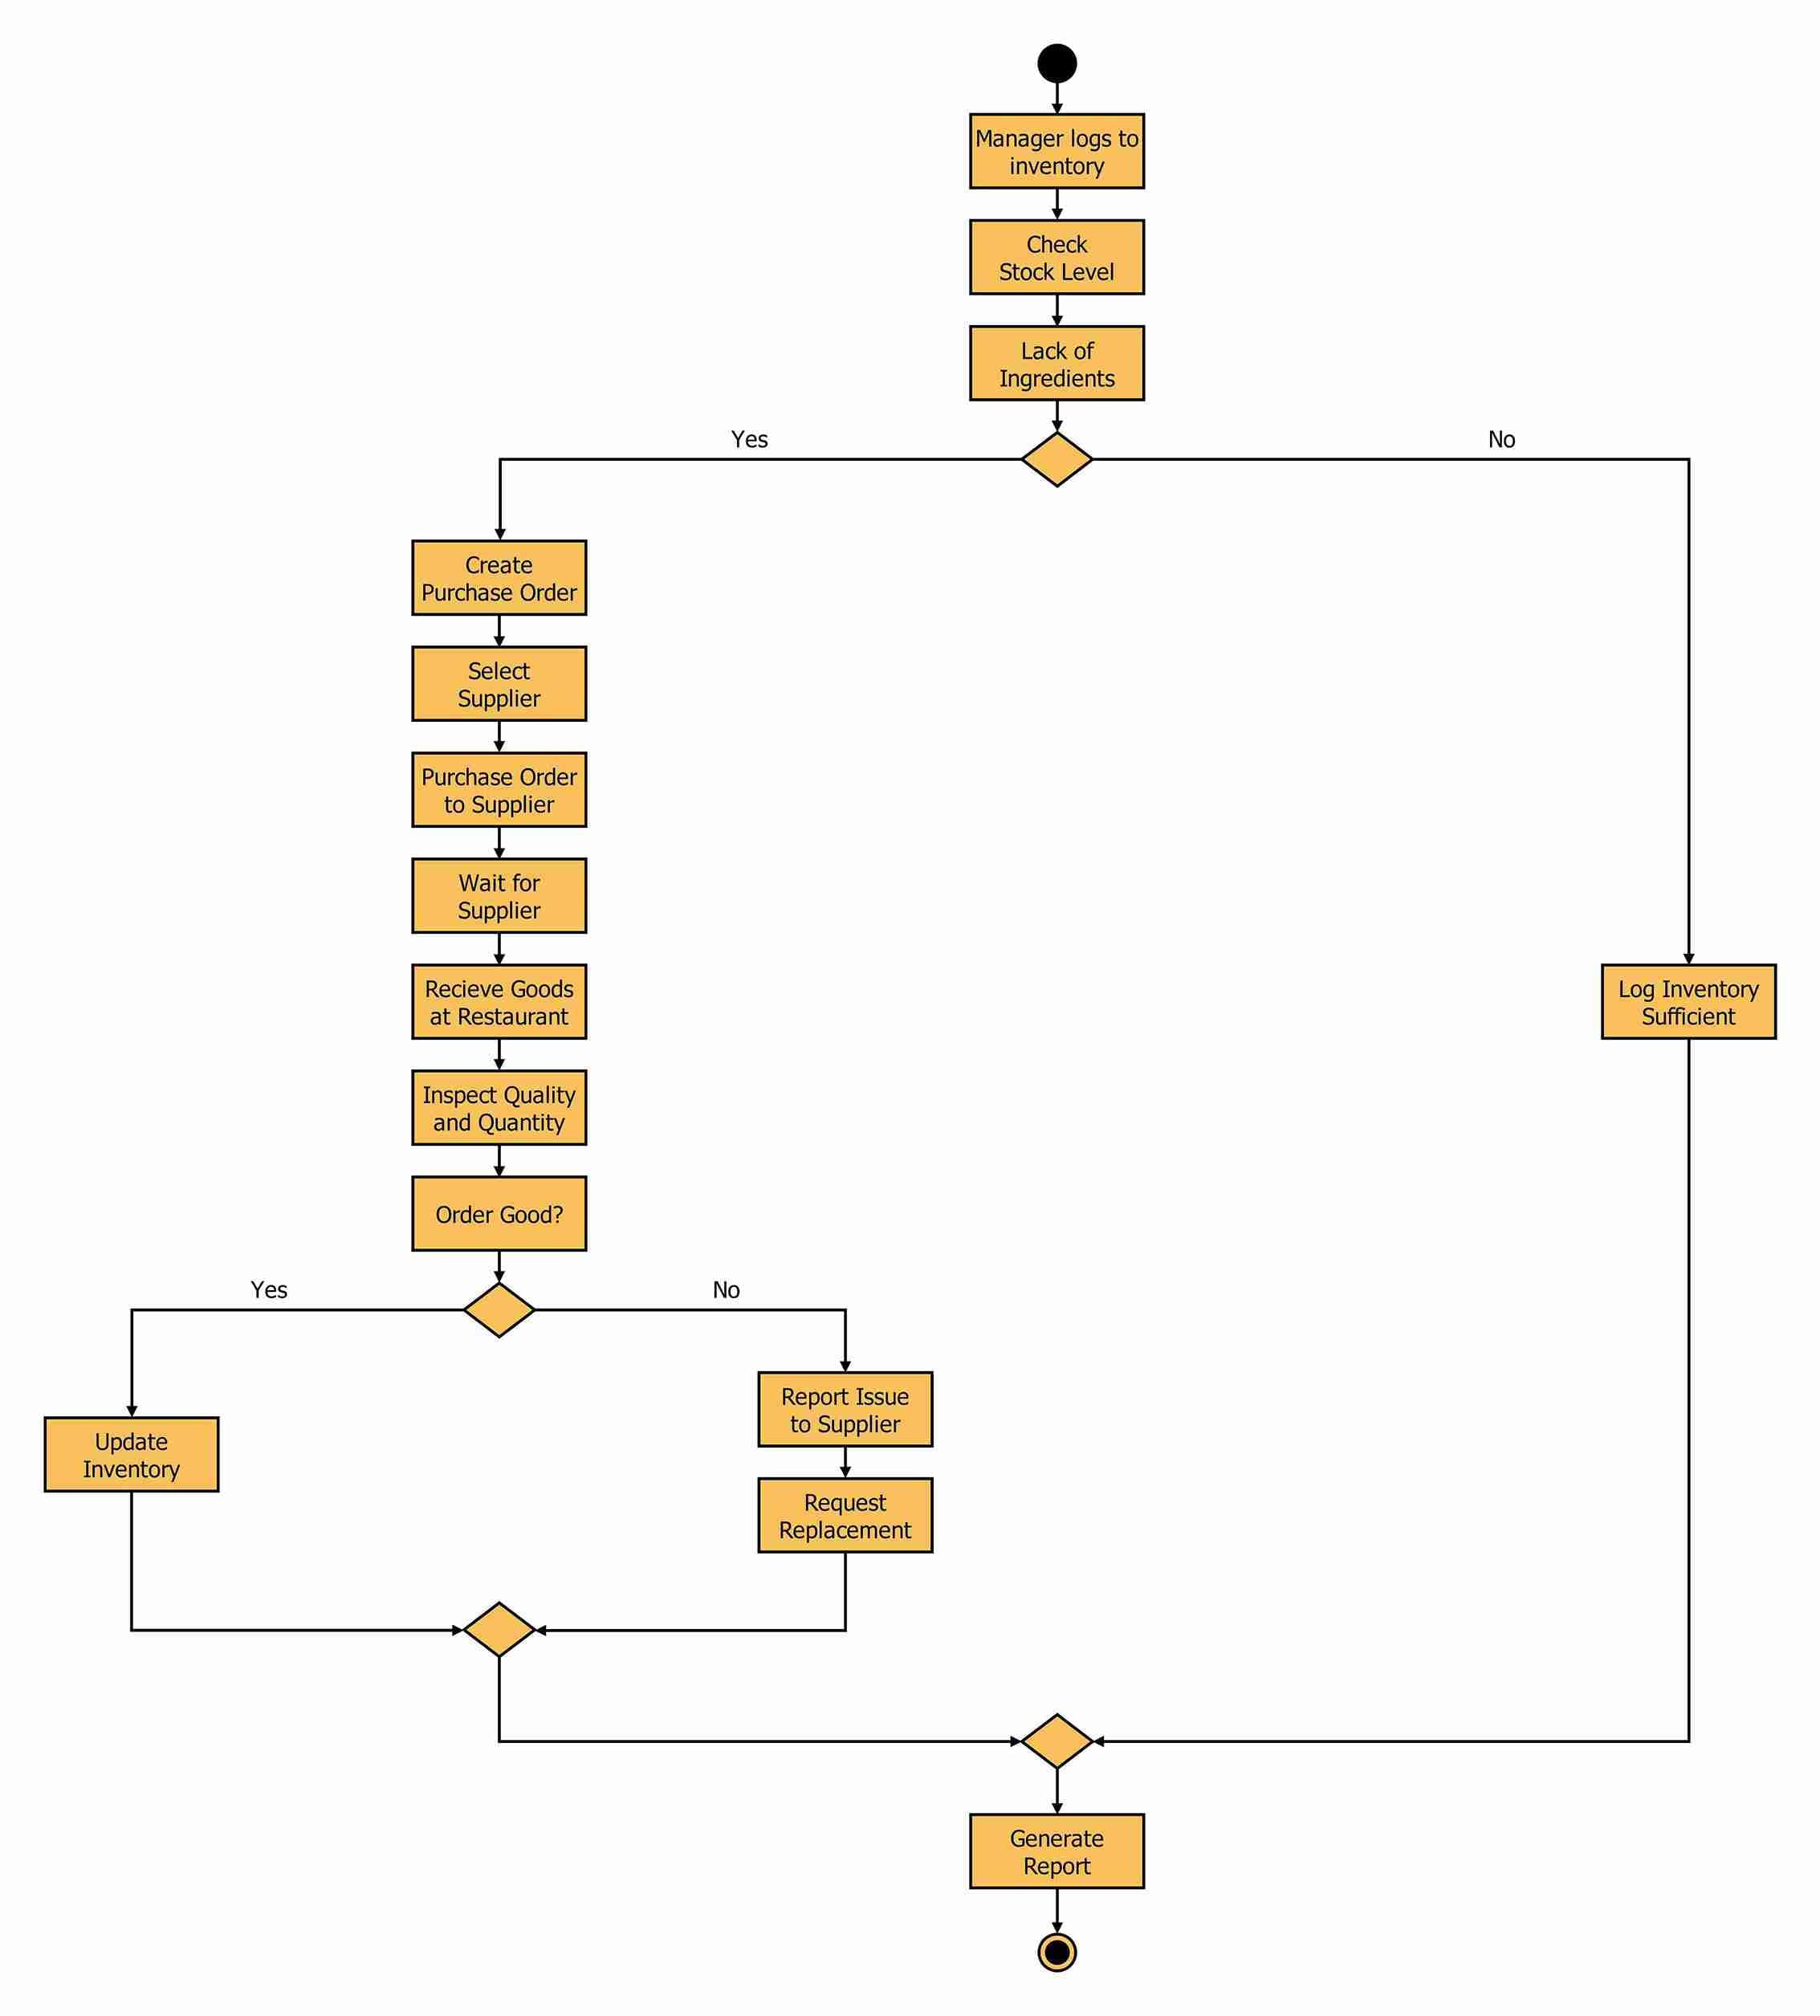
This diagram depicts the restaurant inventory process. The manager logs in to the system and verifies stocks with appropriate balances.
If there is a lack of components, it can create a purchase order to choose a supplier and place an order. Goods are received and checked for quality and quantity. If acceptable, the inventory is marked; if not, defects are noted and the items are replaced.
If there is enough stock, then it is simply marked as sufficient. It ends with a report on the restaurant's stock location, waste, and how smoothly the kitchen runs during purchasing.
Activity Diagram for Restaurant Order Management
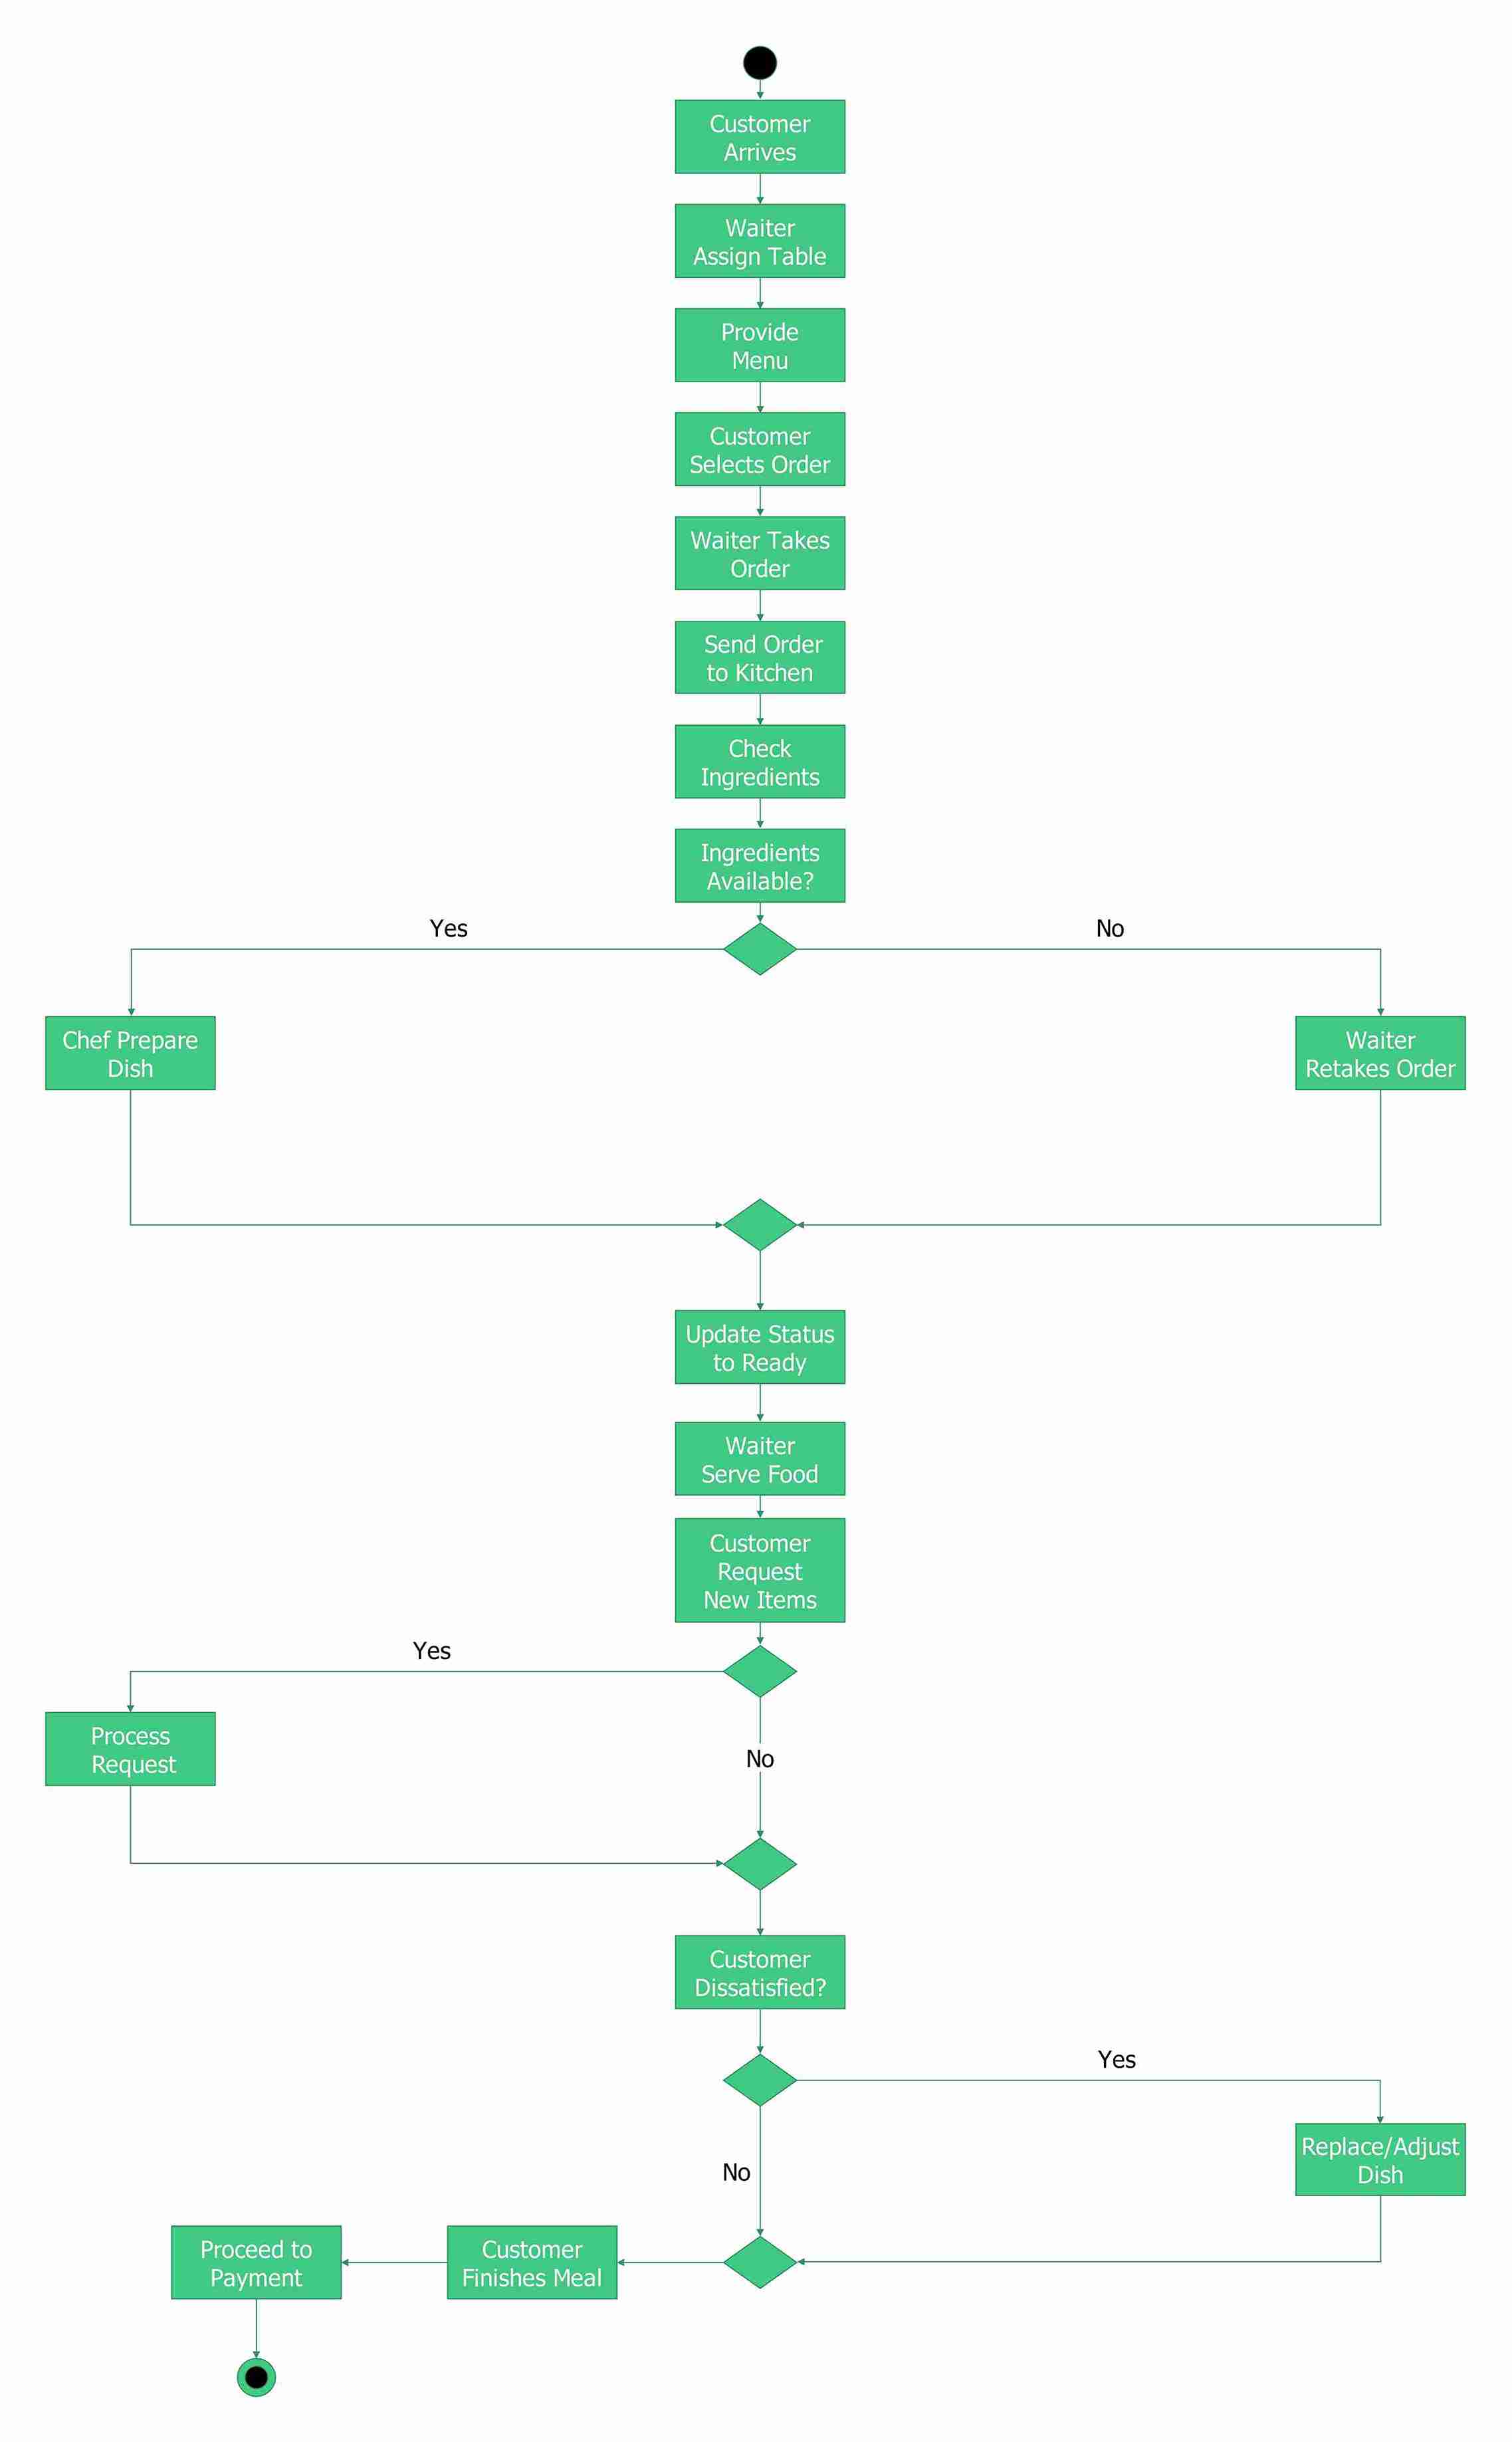
This diagram illustrates how customers order in a restaurant. It’s part of the customer order management flow. It begins when the guest arrives, is seated, and is given a menu. Once the items are ordered, the waiter will place the order. Then, the kitchen will check the ingredients. When the dish is in stock, great; when it is not, the waiter will take a second order.
If the order is found to be unsatisfactory, adjustments or replacements are made. This flow ensures order accuracy and helps staff and kitchen work well together. It also fosters a passion for customer happiness throughout the dining experience.
How to Create an Activity Diagram for a Restaurant Management System
Want to document your restaurant processes? EdrawMax makes it easy with a pre-made UML tool. Follow these six steps:
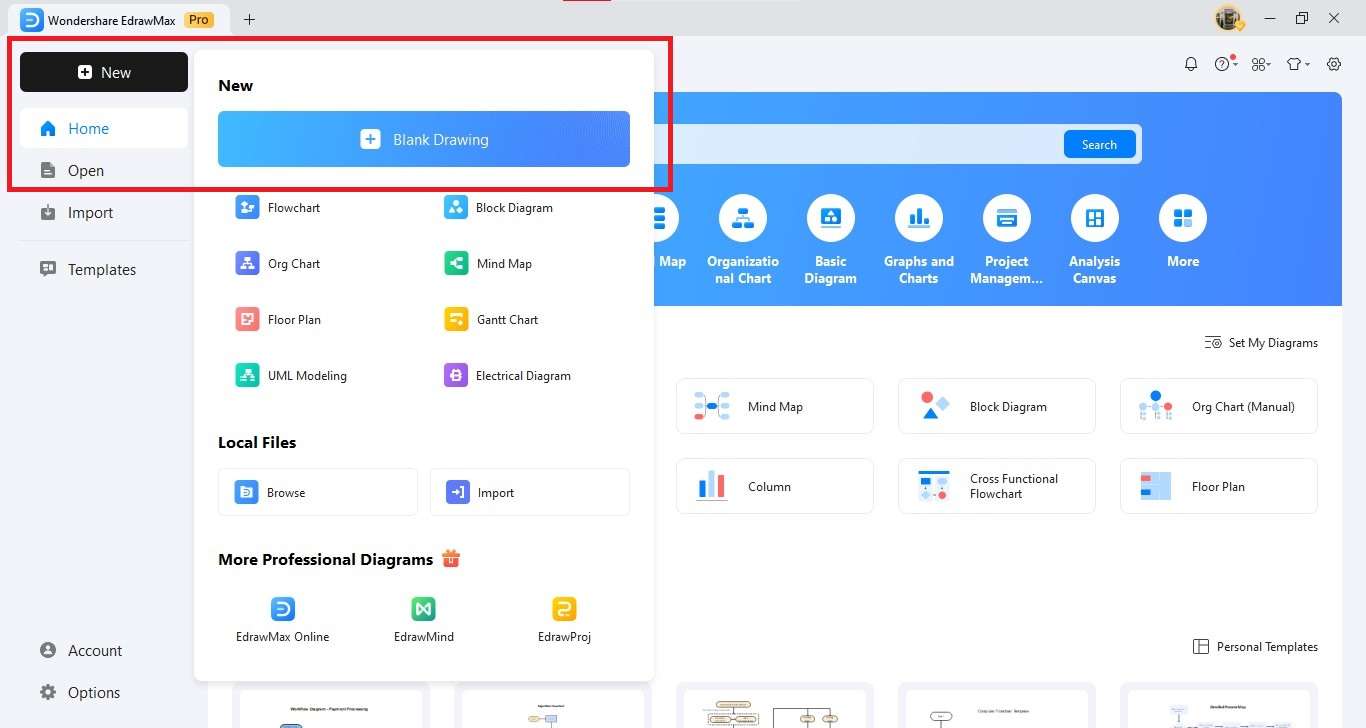
Step1 Open a New Canvas
- Open EdrawMax on your computer.
- Click New → Blank Drawing for a clean workspace.
Step2 Insert Activities (Actions)
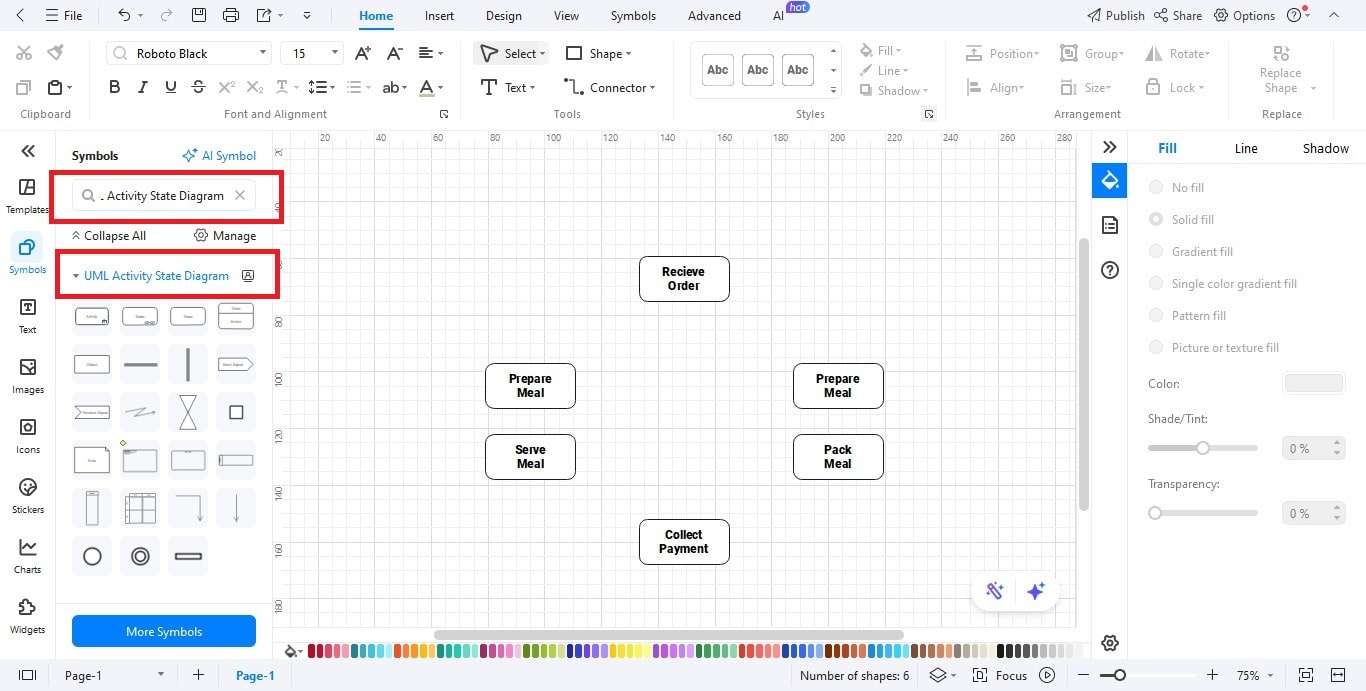
- Drag and drop the activity shapes (rounded rectangles) from the UML Activity Diagram library onto the canvas.
- An activity represents a single step in the process.
- This includes Receive Order, Prepare Meal, Serve Meal, and Collect Payment.
Step3 Add Start and End Points
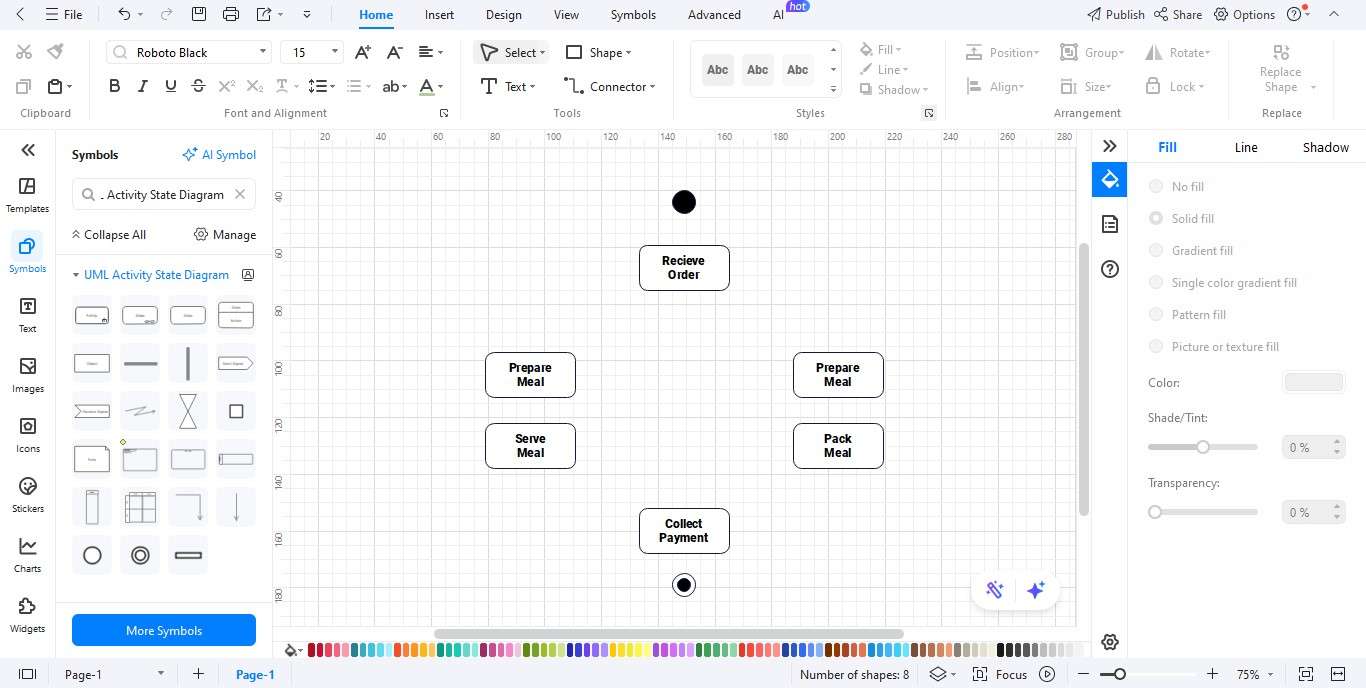
- Create the start or end point:
- Insert a full circle to represent the beginning of the process.
- Put the symbol for a bull’s-eye (a circle inside another circle) to show the endpoint.
Step4 Connect with Flows
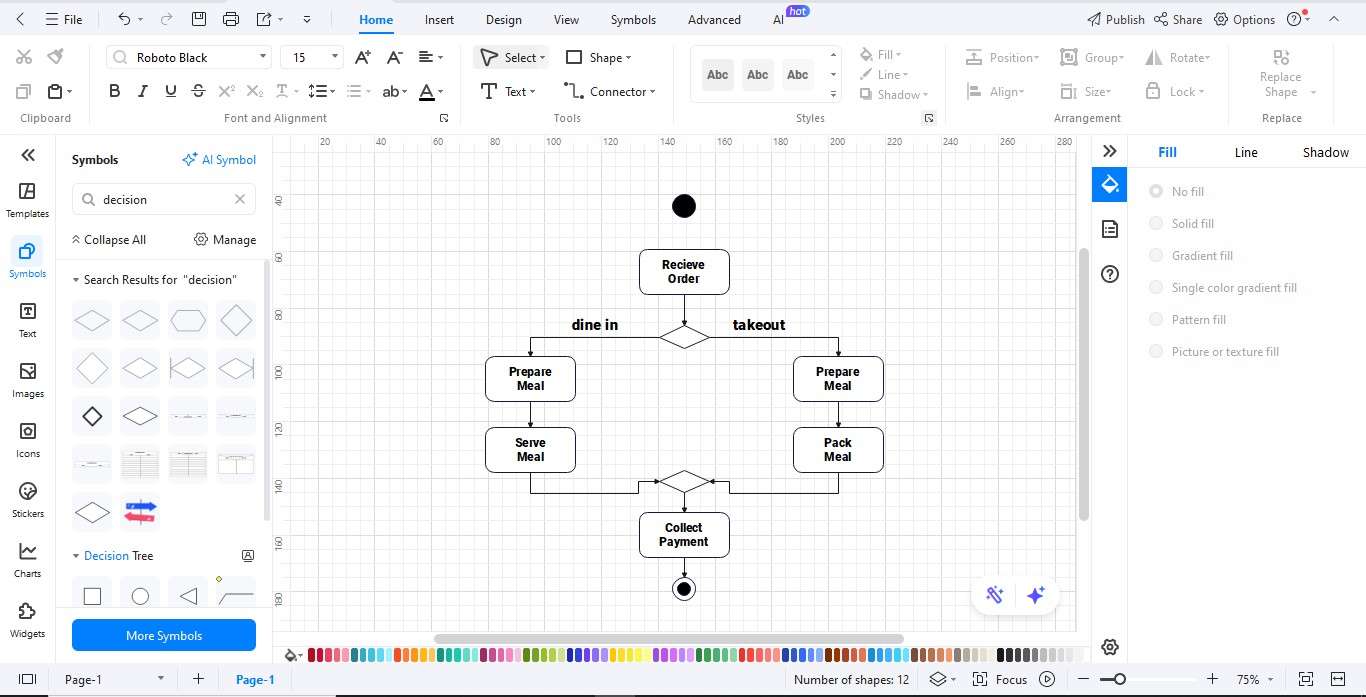
- Connect arrows to show the correct sequence of activities.
- Add decision diamonds for branching options (e.g., Dine-in vs. Takeaway).
Step5 Customize the Diagram
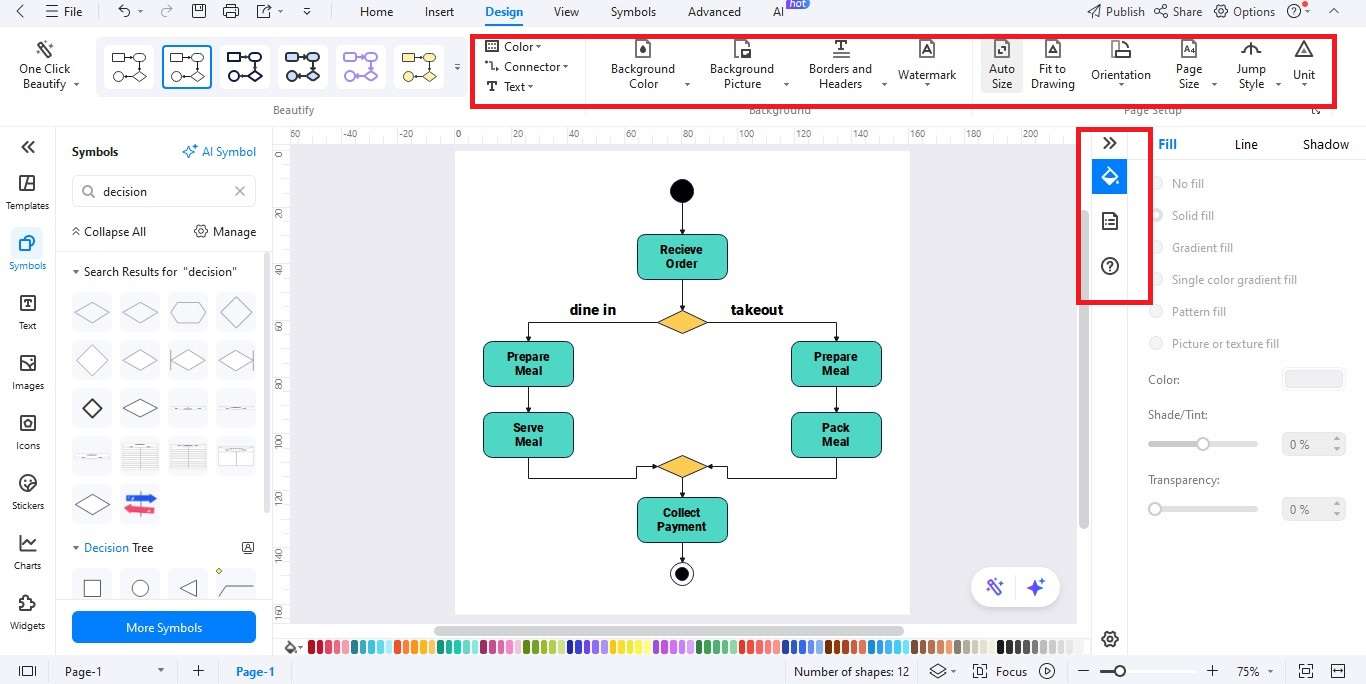
- Format your diagram using the Format toolbar.
- Use colors for role differences.
- Organize and format for a clear, professional diagram that's easy to read.
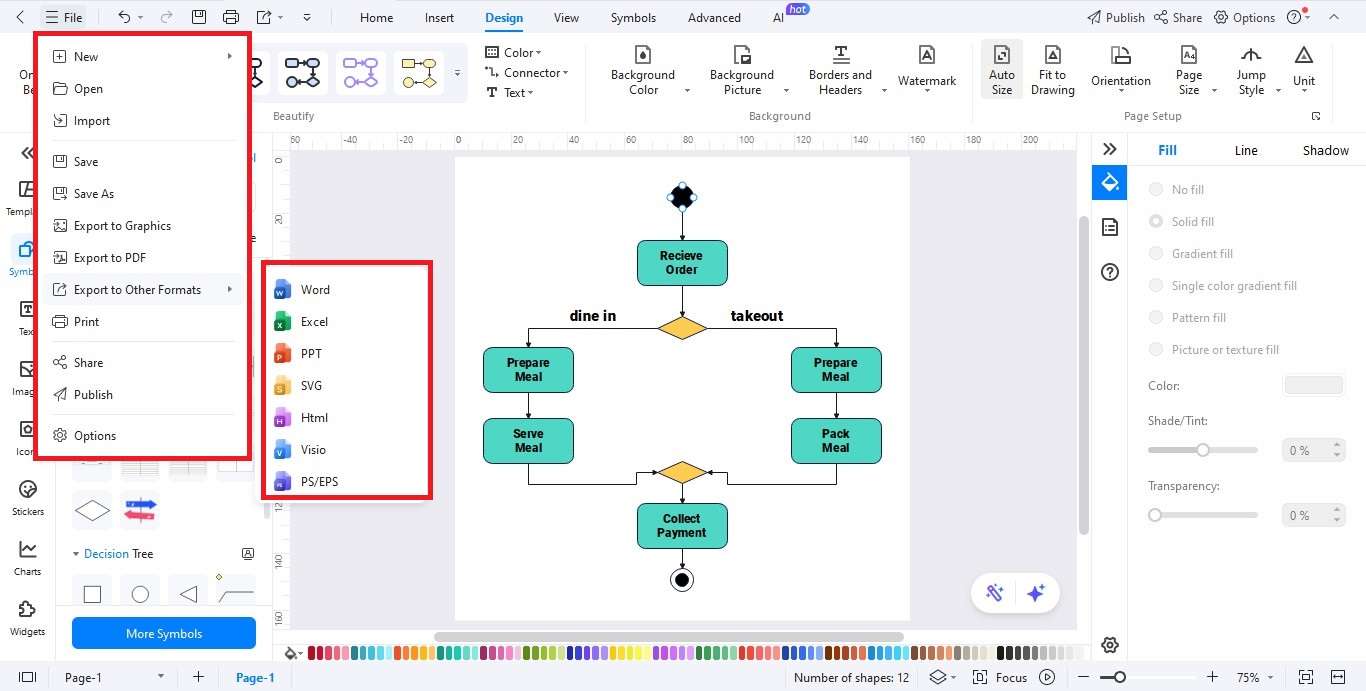
Step6 Export your Diagram
- When the diagram is finished, click Export.
- Select your desired file format to export your diagram. This includes PNG, JPG, PDF, Word, Visio, or SVG.
- Share it with restaurant managers, staff, or developers. This ensures everyone follows the same workflow.
Best Practices for Designing Restaurant Activity Diagrams
- Keep it Simple: Concentrate on basic routines for ordering, serving, and billing. Avoid unnecessary details.
- Use Swimlanes: Assign tasks to role (Customer, Waiter, Kitchen, Cashier). This clarifies responsibility.
- Use Parallel Flows: This means showing activities that occur at the same time, such as cooking multiple dishes.
- Color Coding: Use colors to differentiate between customer and staff and system activities.
- Test with Real Policies: Ensure transitions reflect how the restaurant operates.
- Collaborate with All Interested Parties: Include all the stakeholders. Use diagrams for clear accuracy.
These guidelines make sure the diagram is accurate and useful for learning and management.
Ending Notes
An activity diagram for a restaurant management system lets you visually track these workflows. They show who does what, and to whom, and in what order, and under what circumstances. Restaurants can make clear, professional diagrams using UML principles and tools like EdrawMax.
This helps reduce errors and boosts efficiency. Activity diagrams show processes such as ordering, kitchen workflow, and billing, and enhance the restaurant operations. These diagrams connect restaurant staff to POS and management systems.
They also link staff to the developers of those systems. In the competitive world of restaurants these days, it’s all about efficiency. The use of activity diagrams helps restaurants to support a more seamless service, improve customer experiences, and design smarter systems.
AI Diagram Generator
Enter your prompt. Upload files if needed. Generate diagrams, charts, or slides instantly.


