Free pyramid chart maker
Make clean and engaging pyramid charts using easy-to-edit templates for free.

Why Use EdrawMax Pyramid Chart Maker?
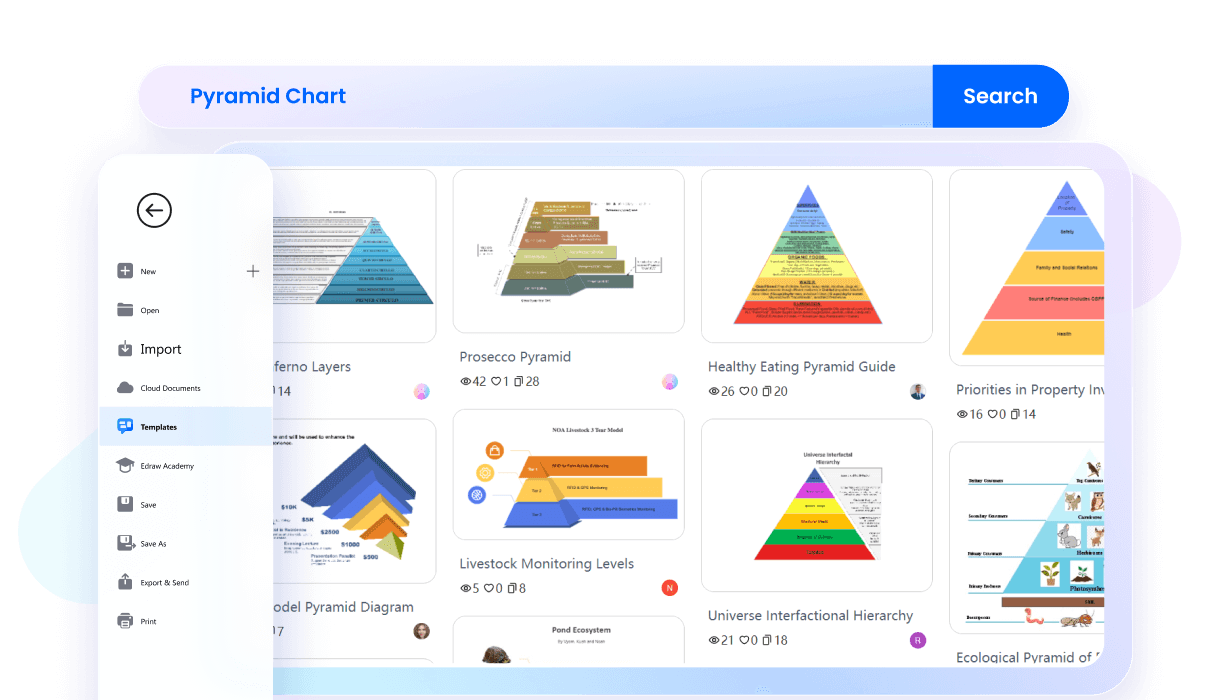
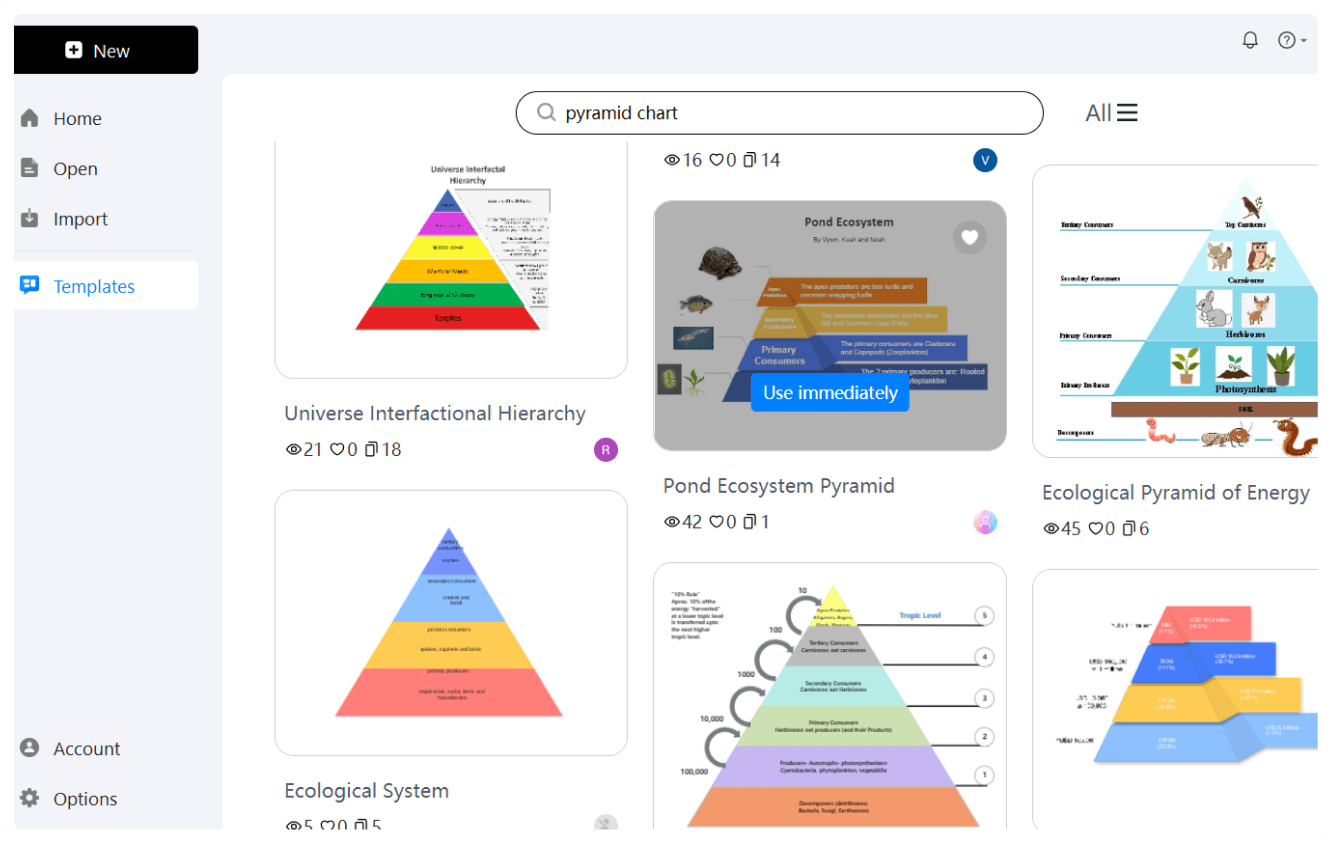
EdrawMax has numerous templates to get you a head-start. There are several styles, including pyramid shapes and cone 3D. All of these examples are fully customizable. You can change color, fonts, and sections as per your needs.
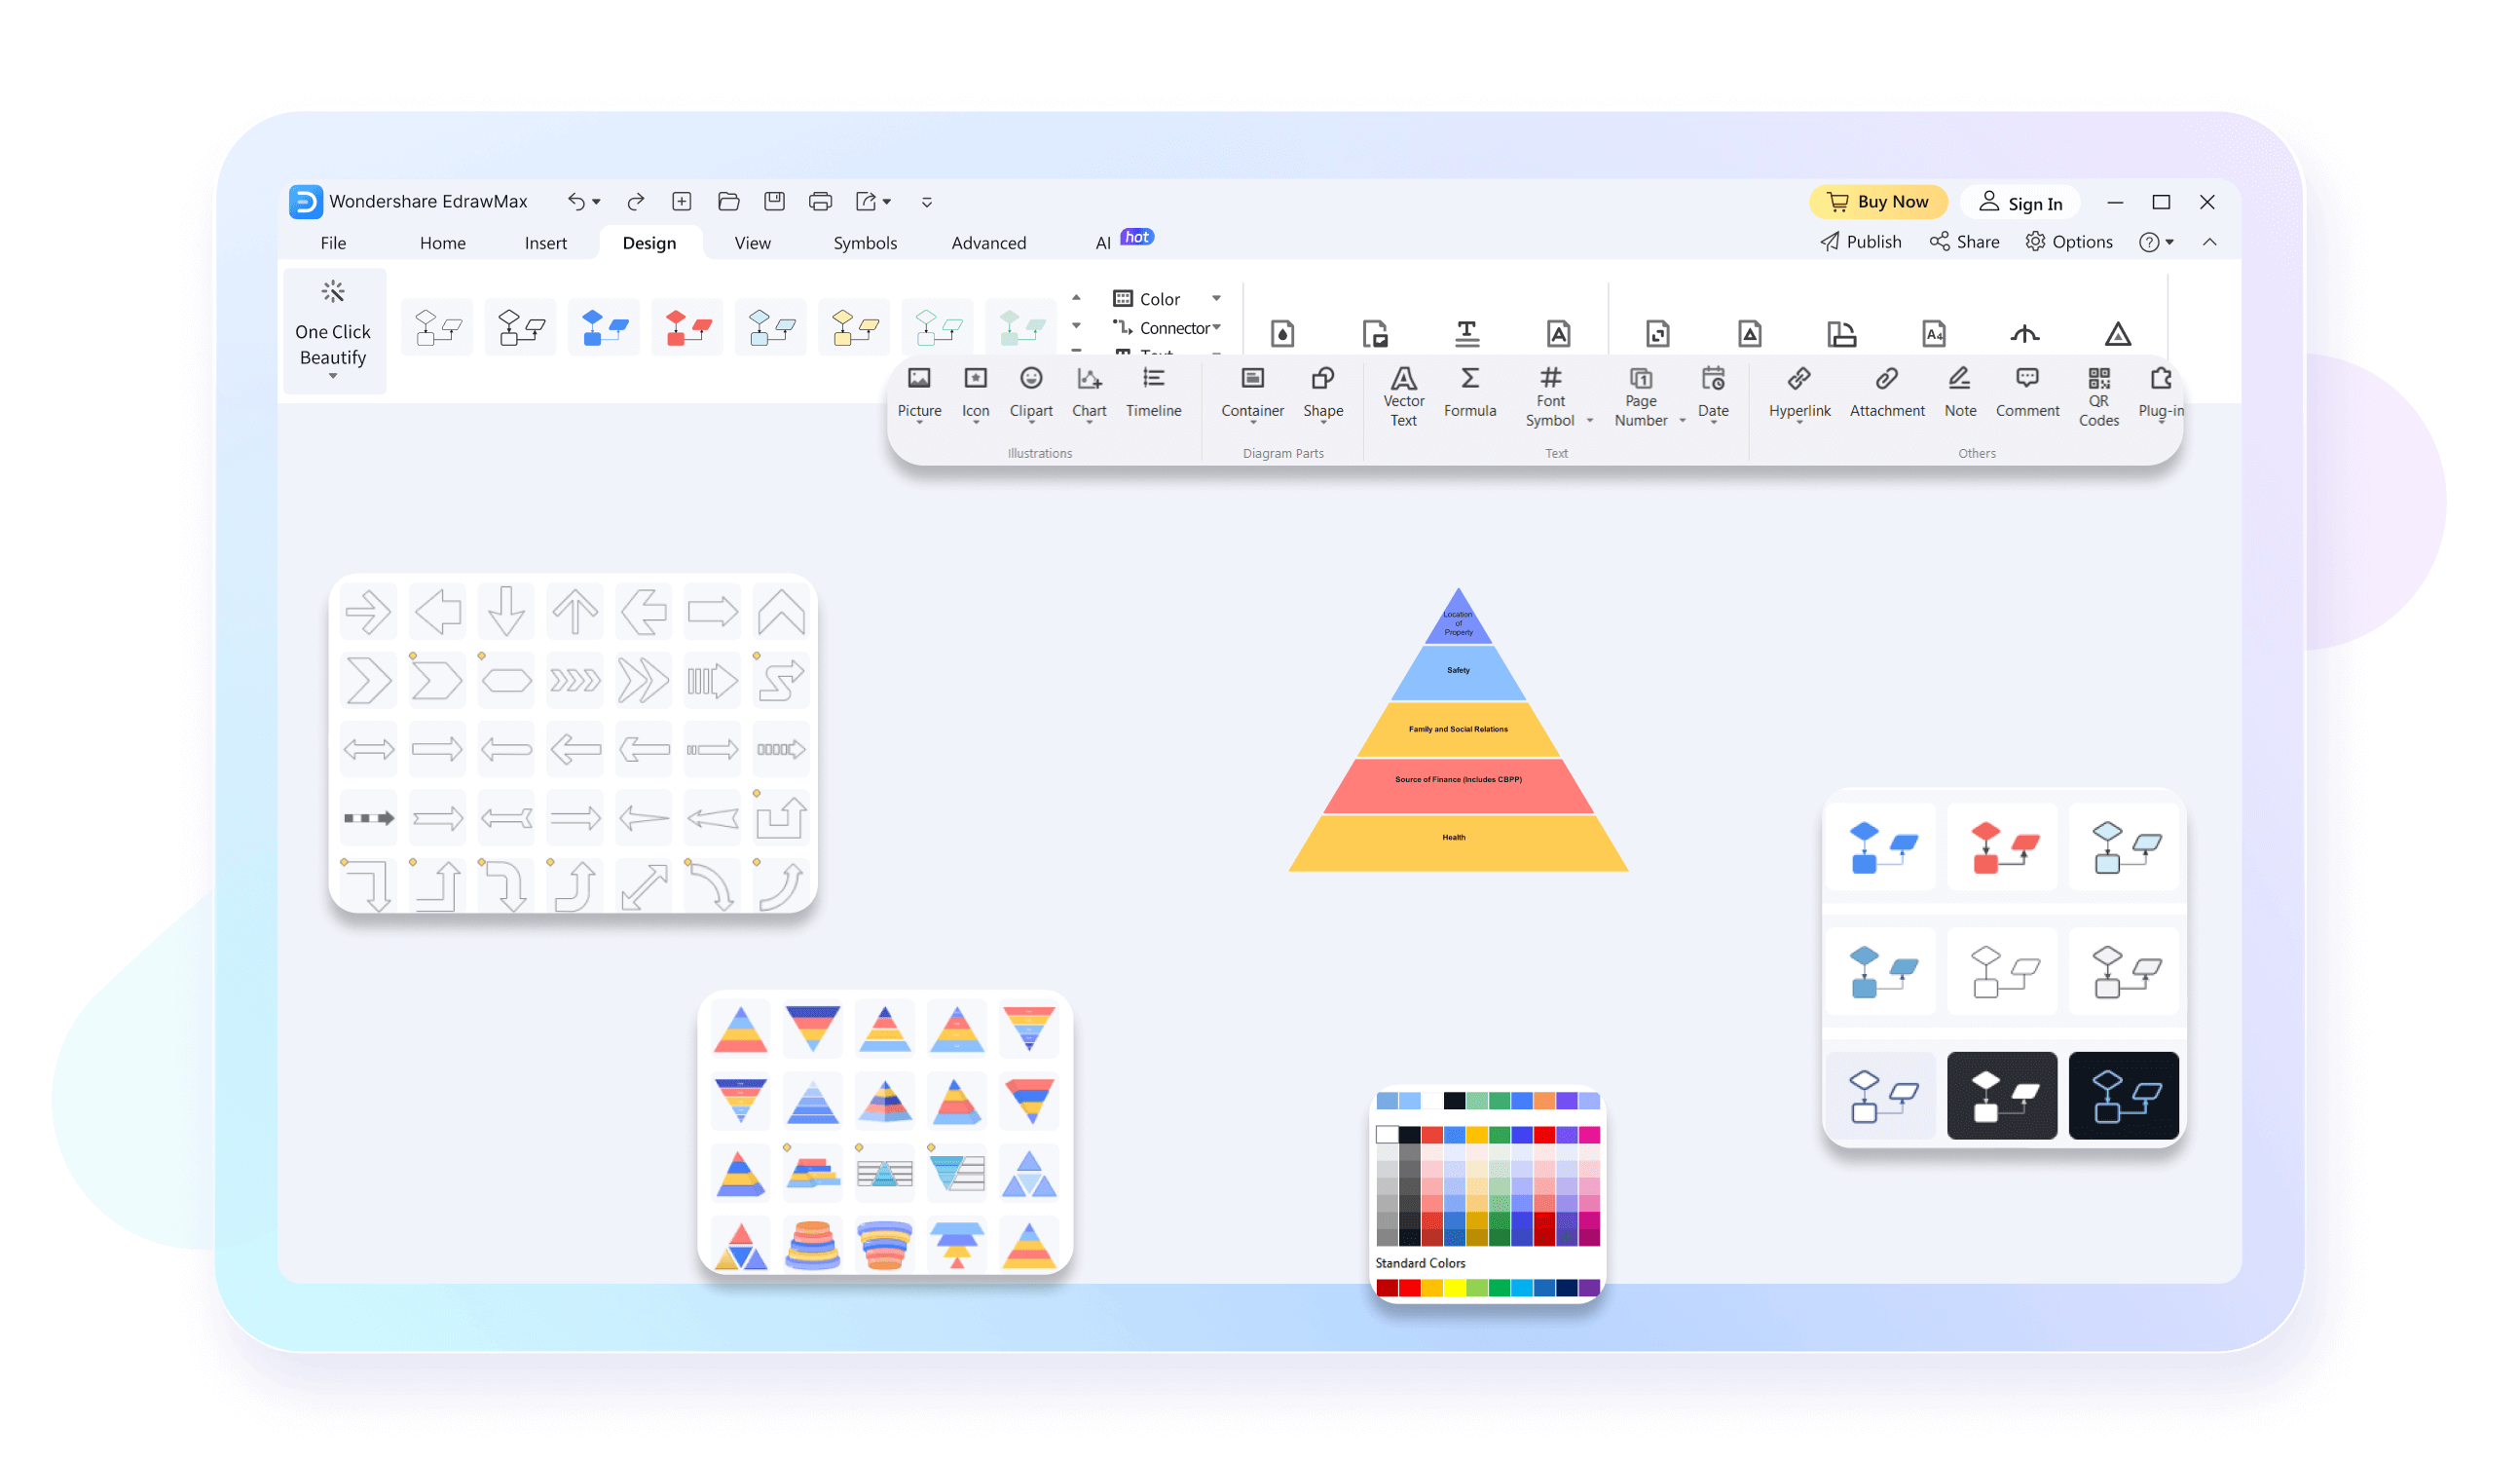
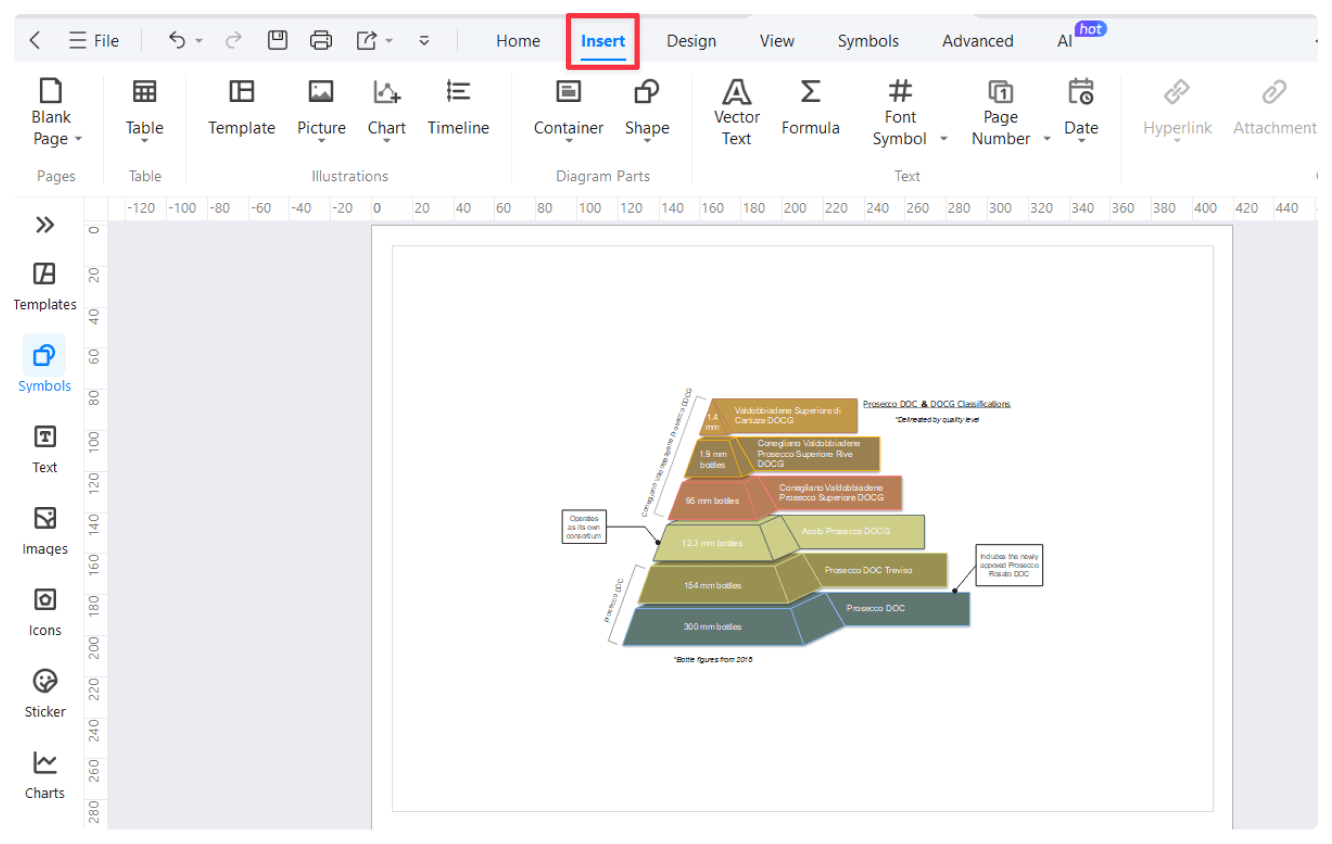
Even if you're a first-time chart maker, working with EdrawMax and its drag-and-drop interface is rather easy. The software is designed with ease in mind so that you can focus on the content at hand—not on the learning curve. You can add or remove sections, labels, or any other element easily by clicking once or twice on the element.
EdrawMax is a cross-platform tool. You can access it on Windows, Mac, and Linux. It means you can work on your pyramid charts from any device, be it at home, in the office, or traveling. Your work will be saved in the cloud for better collaboration with your colleagues if they are using other operating systems.

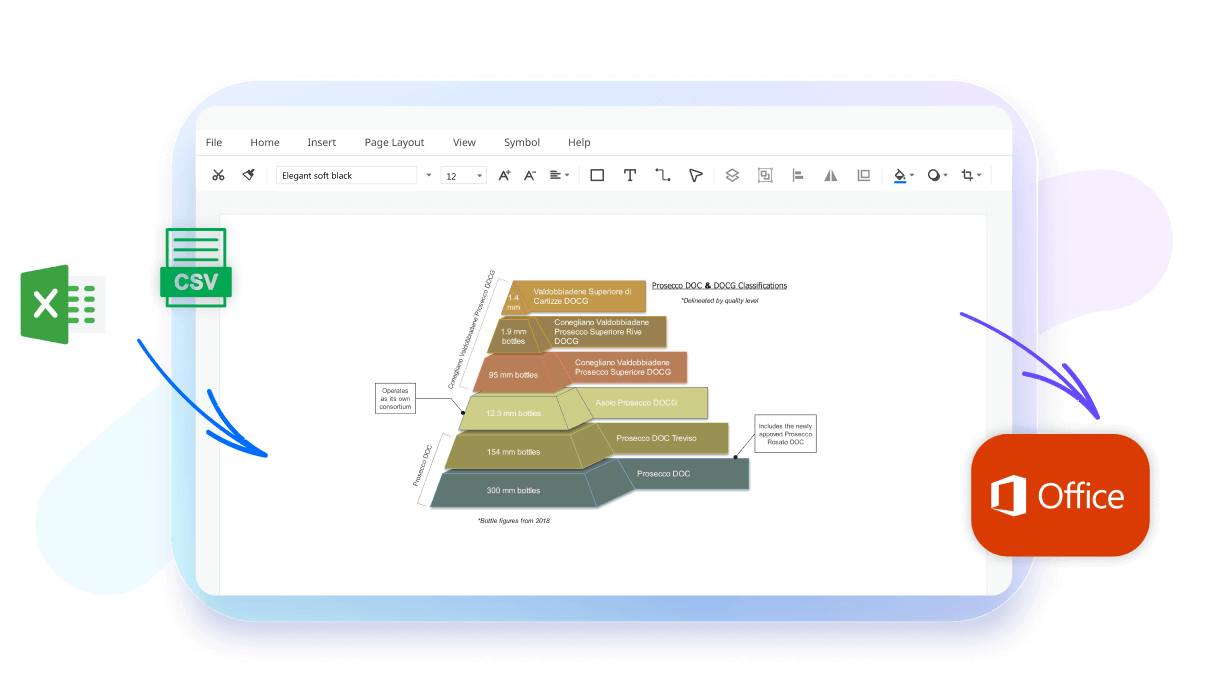
You can easily import all your data from Excel, CSV, or even Google Sheets into EdrawMax. This ensures that your pyramid charts are true and current. By default, the tool adjusts the chart according to your entered data. This will save you much time and energy.
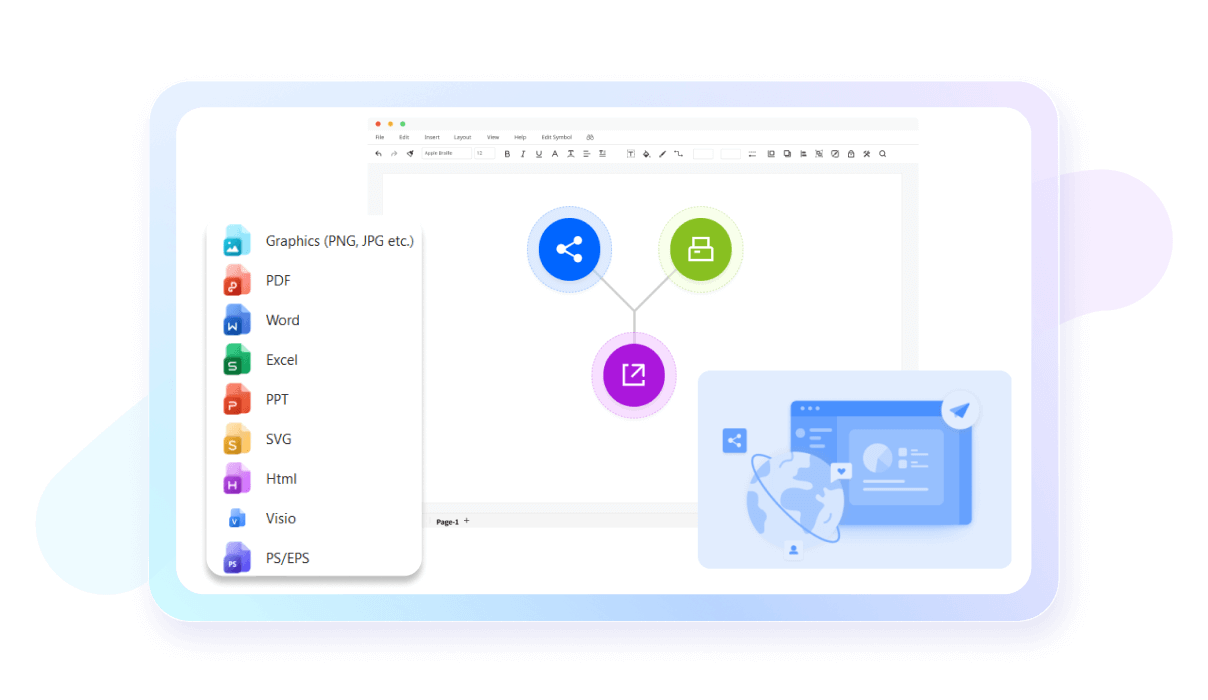
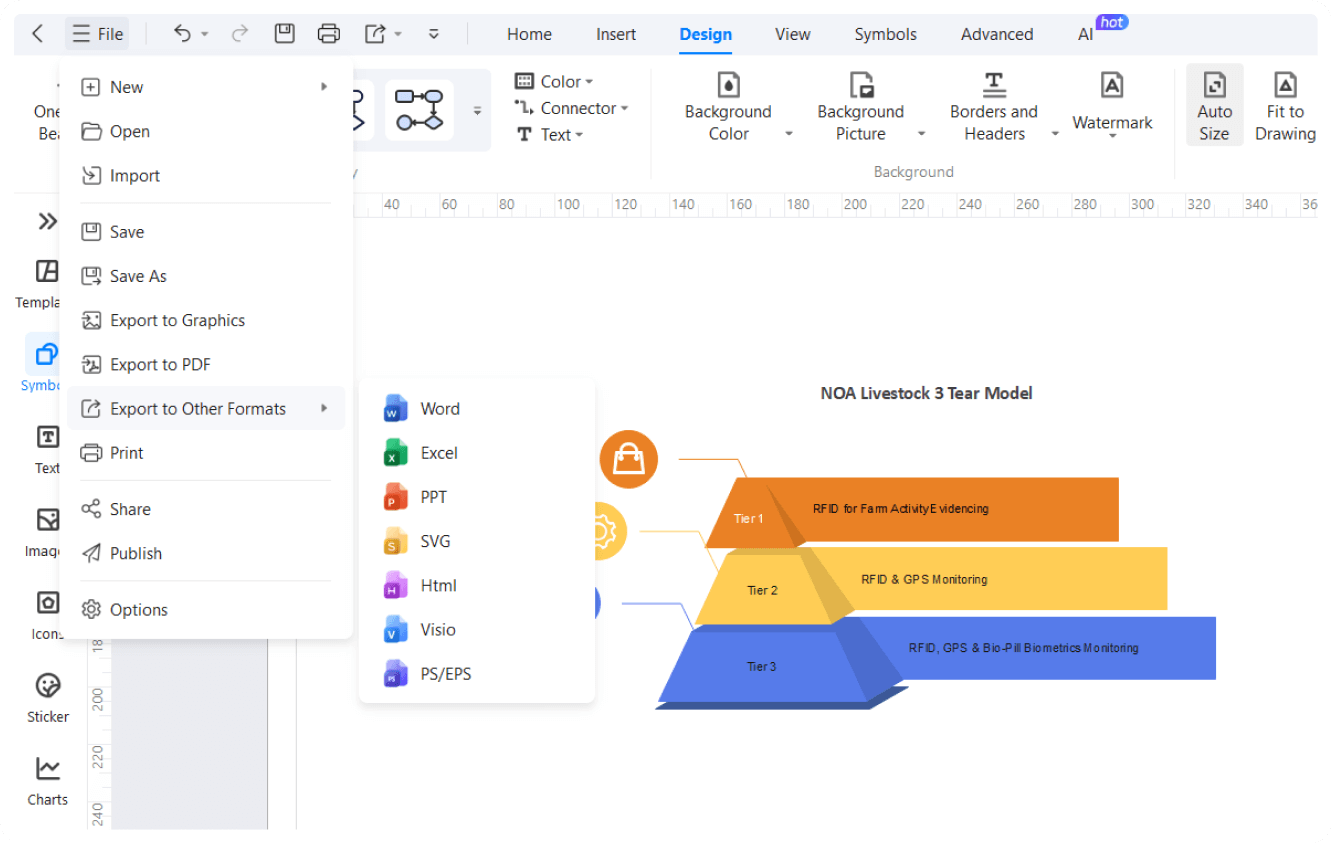
EdrawMax supports multiple export formats, such as PDF, PNG, SVG, etc. It means that you can share your work across different platforms easily. You can also embed your pyramid charts directly into any presentation, report, or website.
How to Make a Pyramid Chart in 3 Simple Steps
What our users say
More Pyramid Chart Tools
Discover more AI-powered diagram makers to boost your productivity.
FAQs About EdrawMax Pyramid Chart Tools
-
What is a pyramid chart and what does it represent?A pyramid chart is a visual representation used to show hierarchical data or processes that build upon each other. It is typically divided into horizontal sections, where the width of each segment represents a specific level or quantity. It effectively illustrates foundations, priorities, or steps in a sequential progression.
-
How does a pyramid chart differ from a funnel chart?While they look similar, a pyramid chart emphasizes hierarchy and foundation, starting from a broad base that supports the top. In contrast, a funnel chart represents a process where data decreases at each stage, such as a sales pipeline. Pyramids show structure, while funnels track movement through a system.
-
What is an inverted pyramid chart used for?An inverted pyramid chart flips the traditional structure to place the widest section at the top. This is often used in journalism to highlight the most critical information first or in business to show a narrowing focus. It suggests that the top layer is the most significant or inclusive part.
-
What is a population pyramidA population pyramid is a specific type of chart that shows the distribution of various age groups within a population. It typically displays males on one side and females on the other. It is crucial for demographers to analyze growth rates, aging trends, and future social planning needs effectively.
-
Can I include specific numerical data in a pyramid chart?Yes, you can include numerical values or percentages within each segment. This adds a quantitative layer to the visual hierarchy. However, ensure that the size of the segment roughly corresponds to the value it represents. Adding clear data labels helps the audience interpret the exact proportions of each level.
Learn about Pyramid Chart
Stop drawing. Start describing.
AI diagramming isn't just text-to-diagram.
AI now understands any input, fetches live data, adapts through dialogue, and works everywhere.
Free pyramid chart templates from EdrawMax