Free system architecture diagram maker
Build detailed maps with the EdrawMax system architecture diagram maker. It offers many ready-made templates and drag-and-drop tools to save you time. This software is perfect for designers and engineers who need to visualize software or hardware setups. Start designing your next big project with high-quality visuals now.
Make system structures with EdrawMax system architecture maker easily
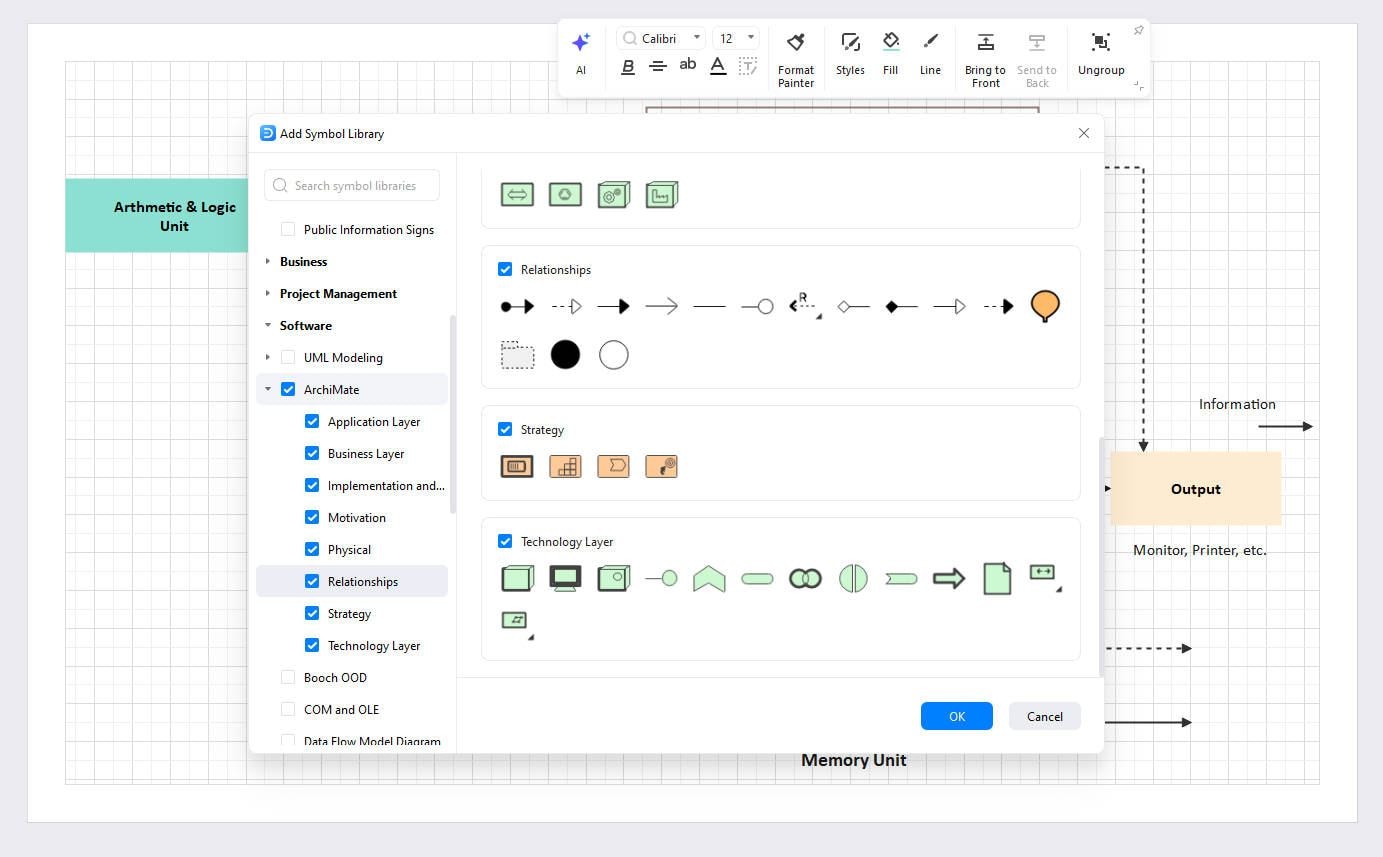
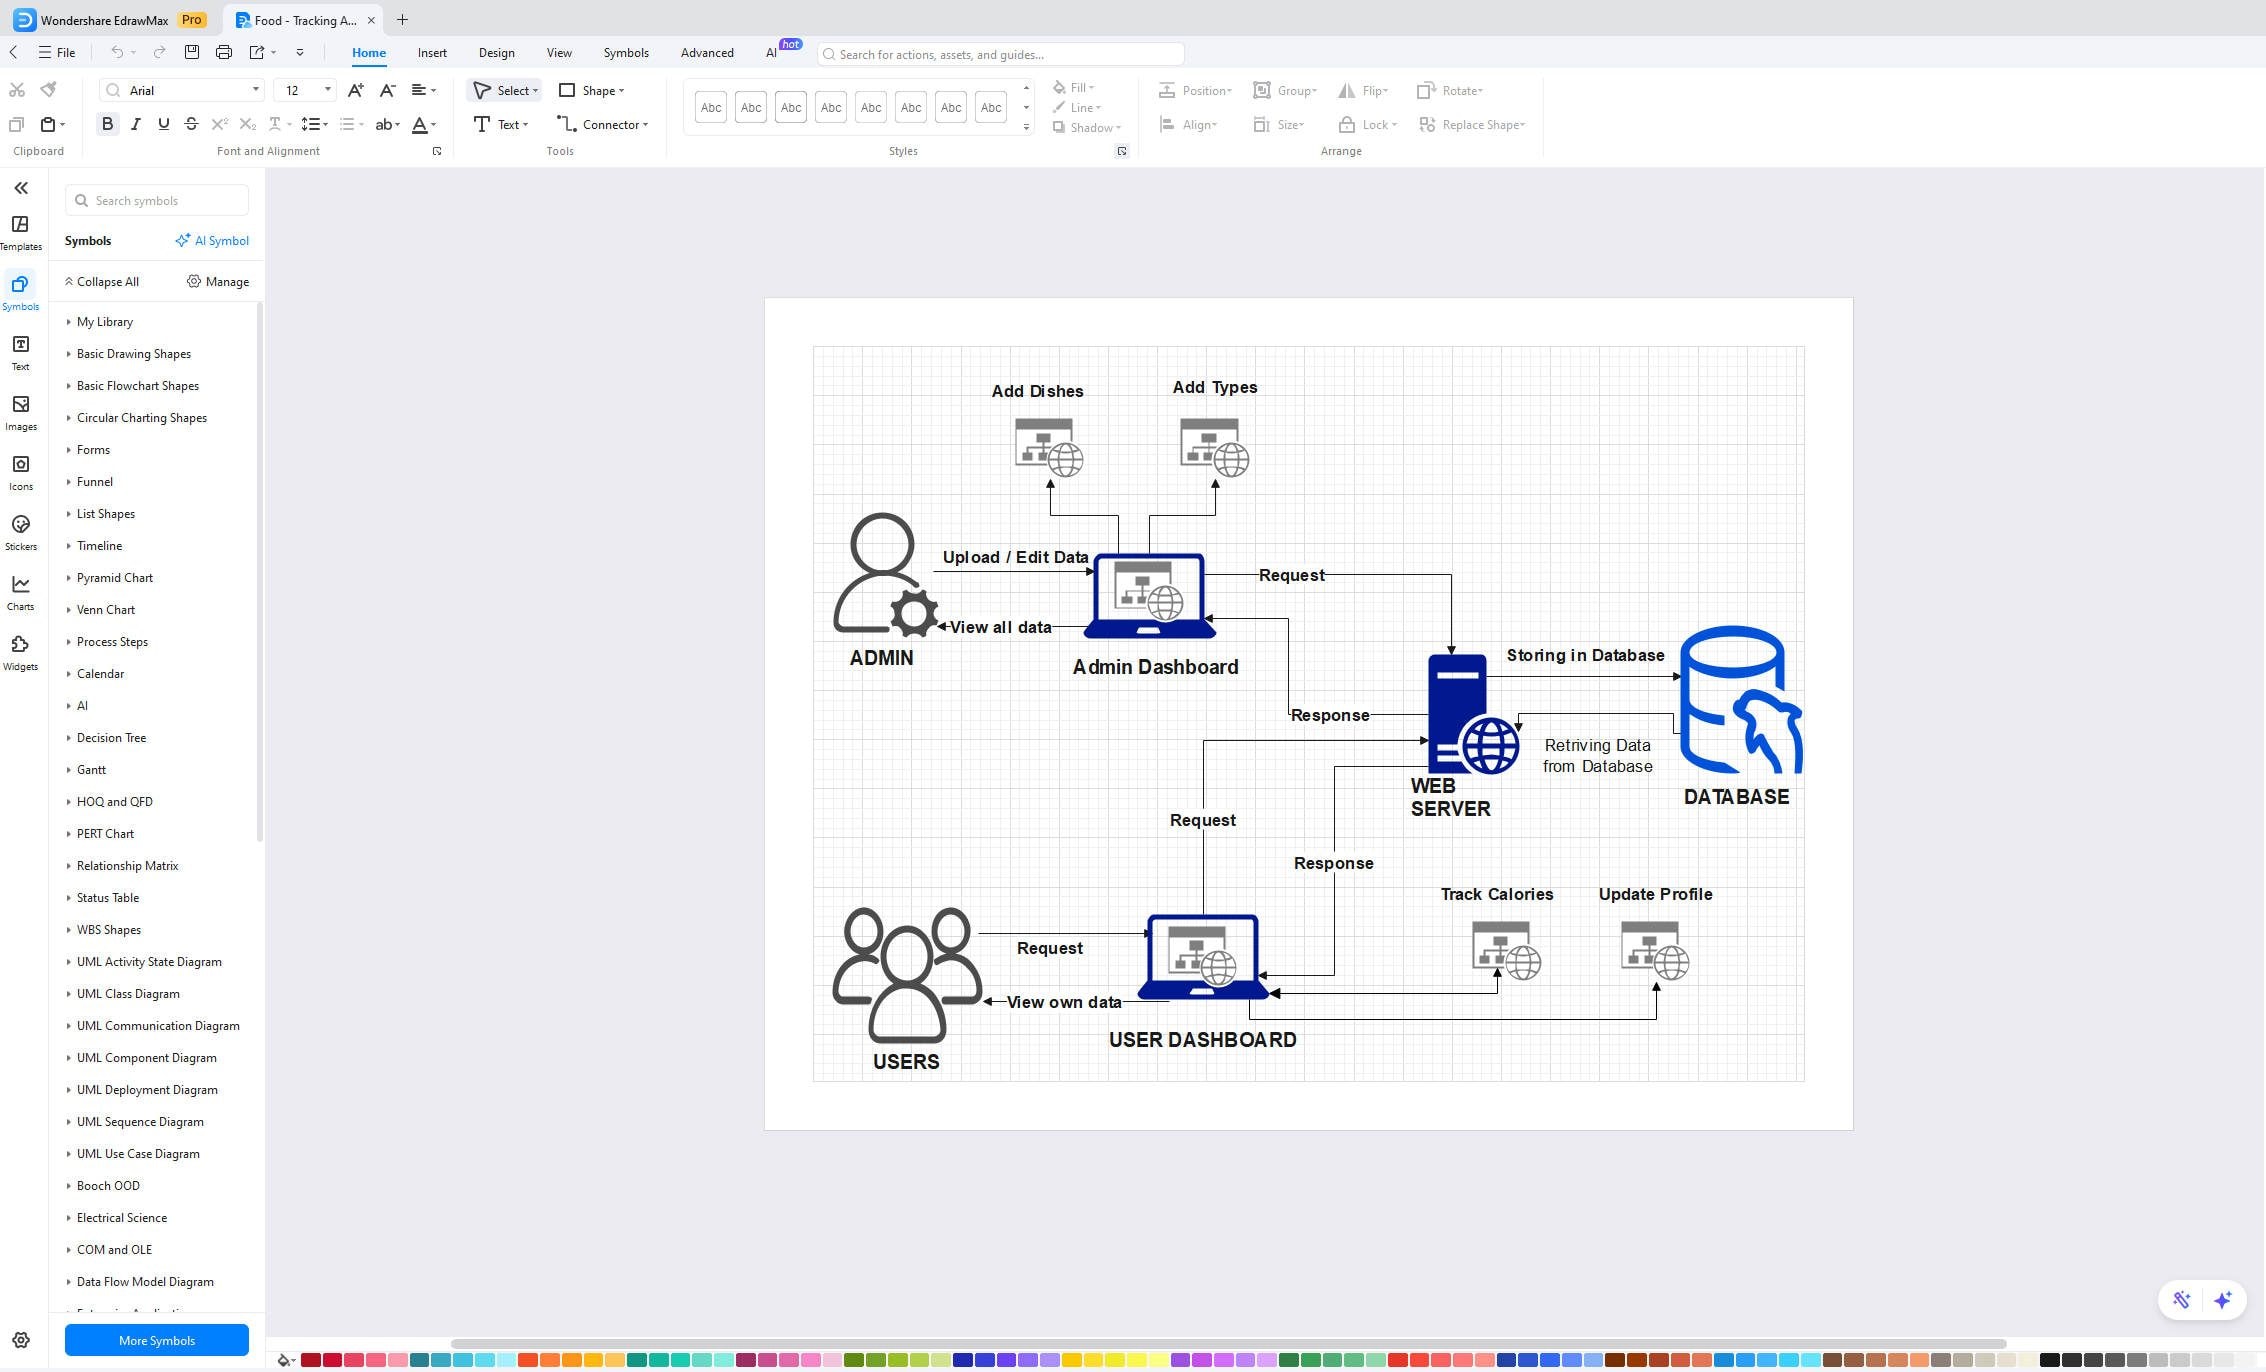
Enjoy a seamless drag-and-drop interface with smart snapping and auto-alignment for pixel-perfect precision. Access a library of over 26,000 vector symbols tailored for technical infrastructure.
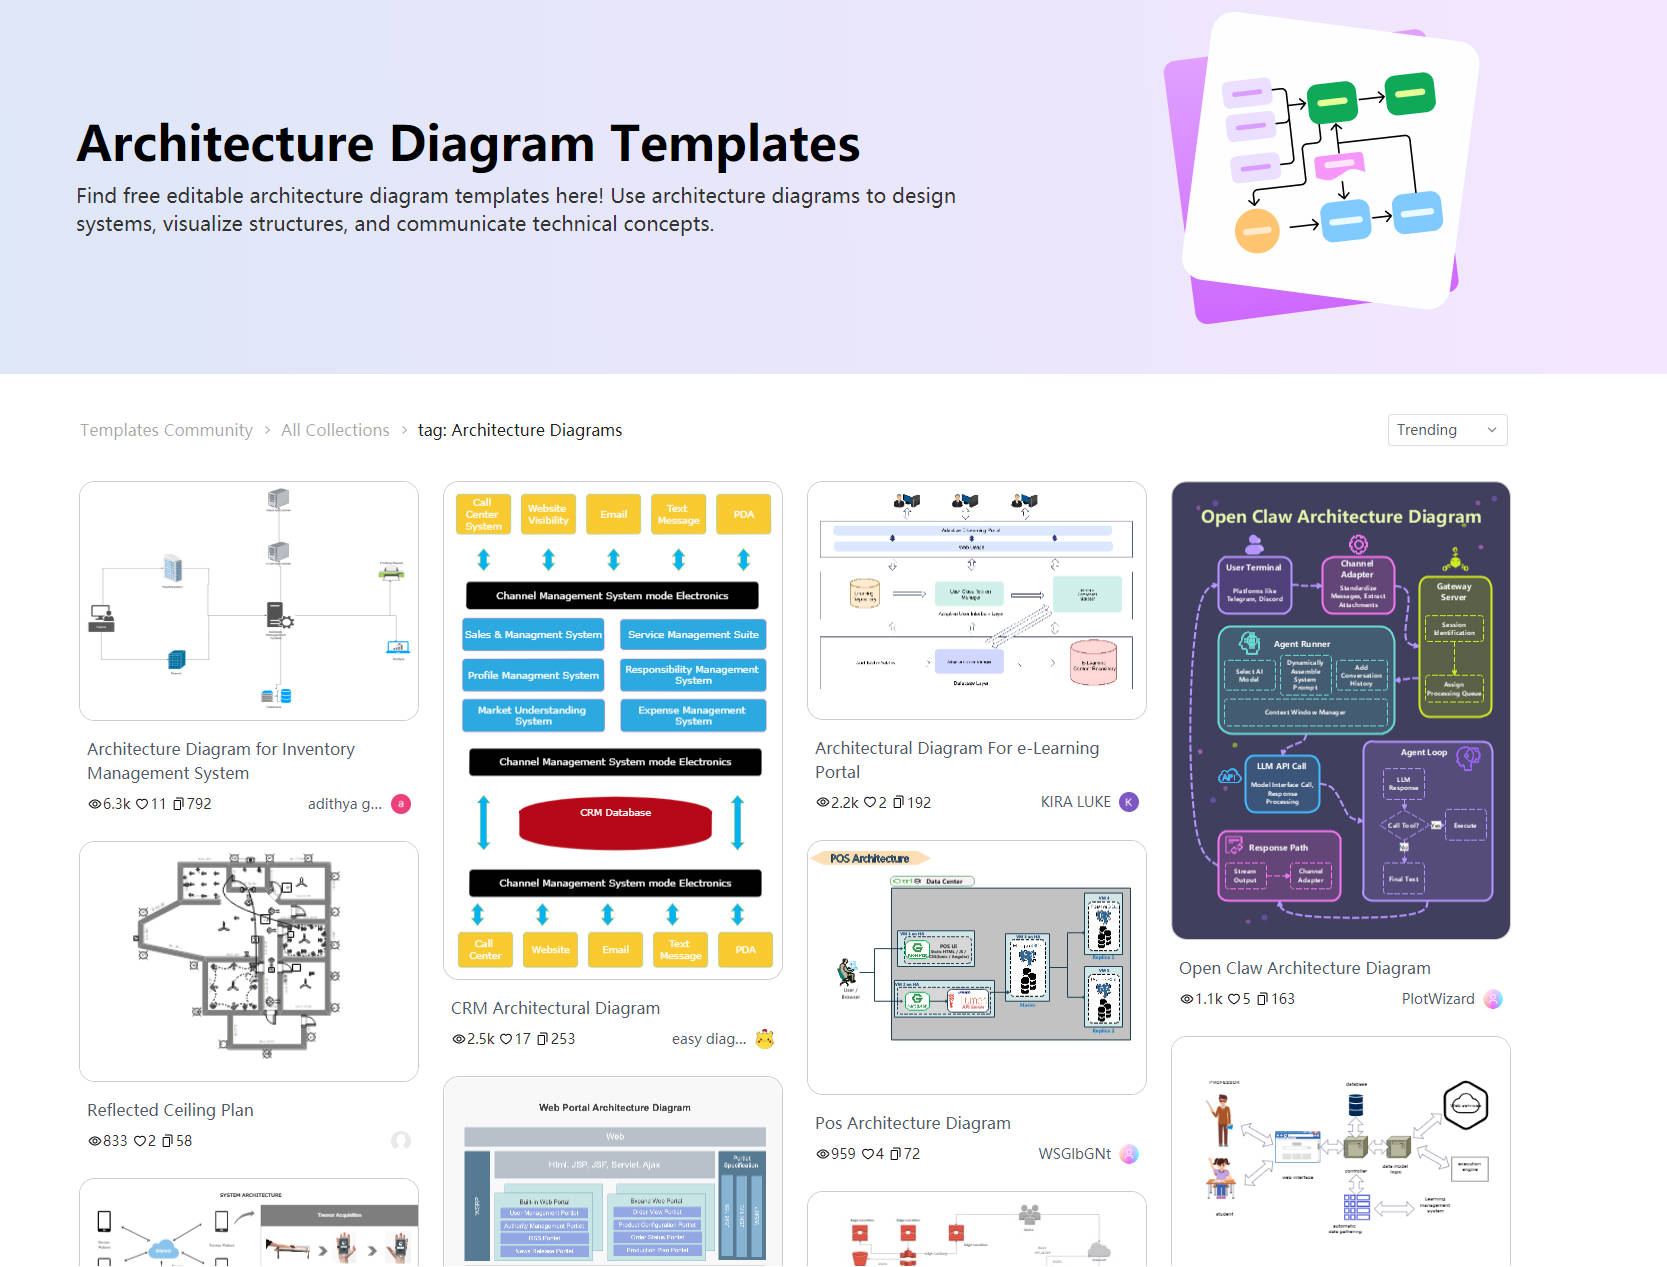
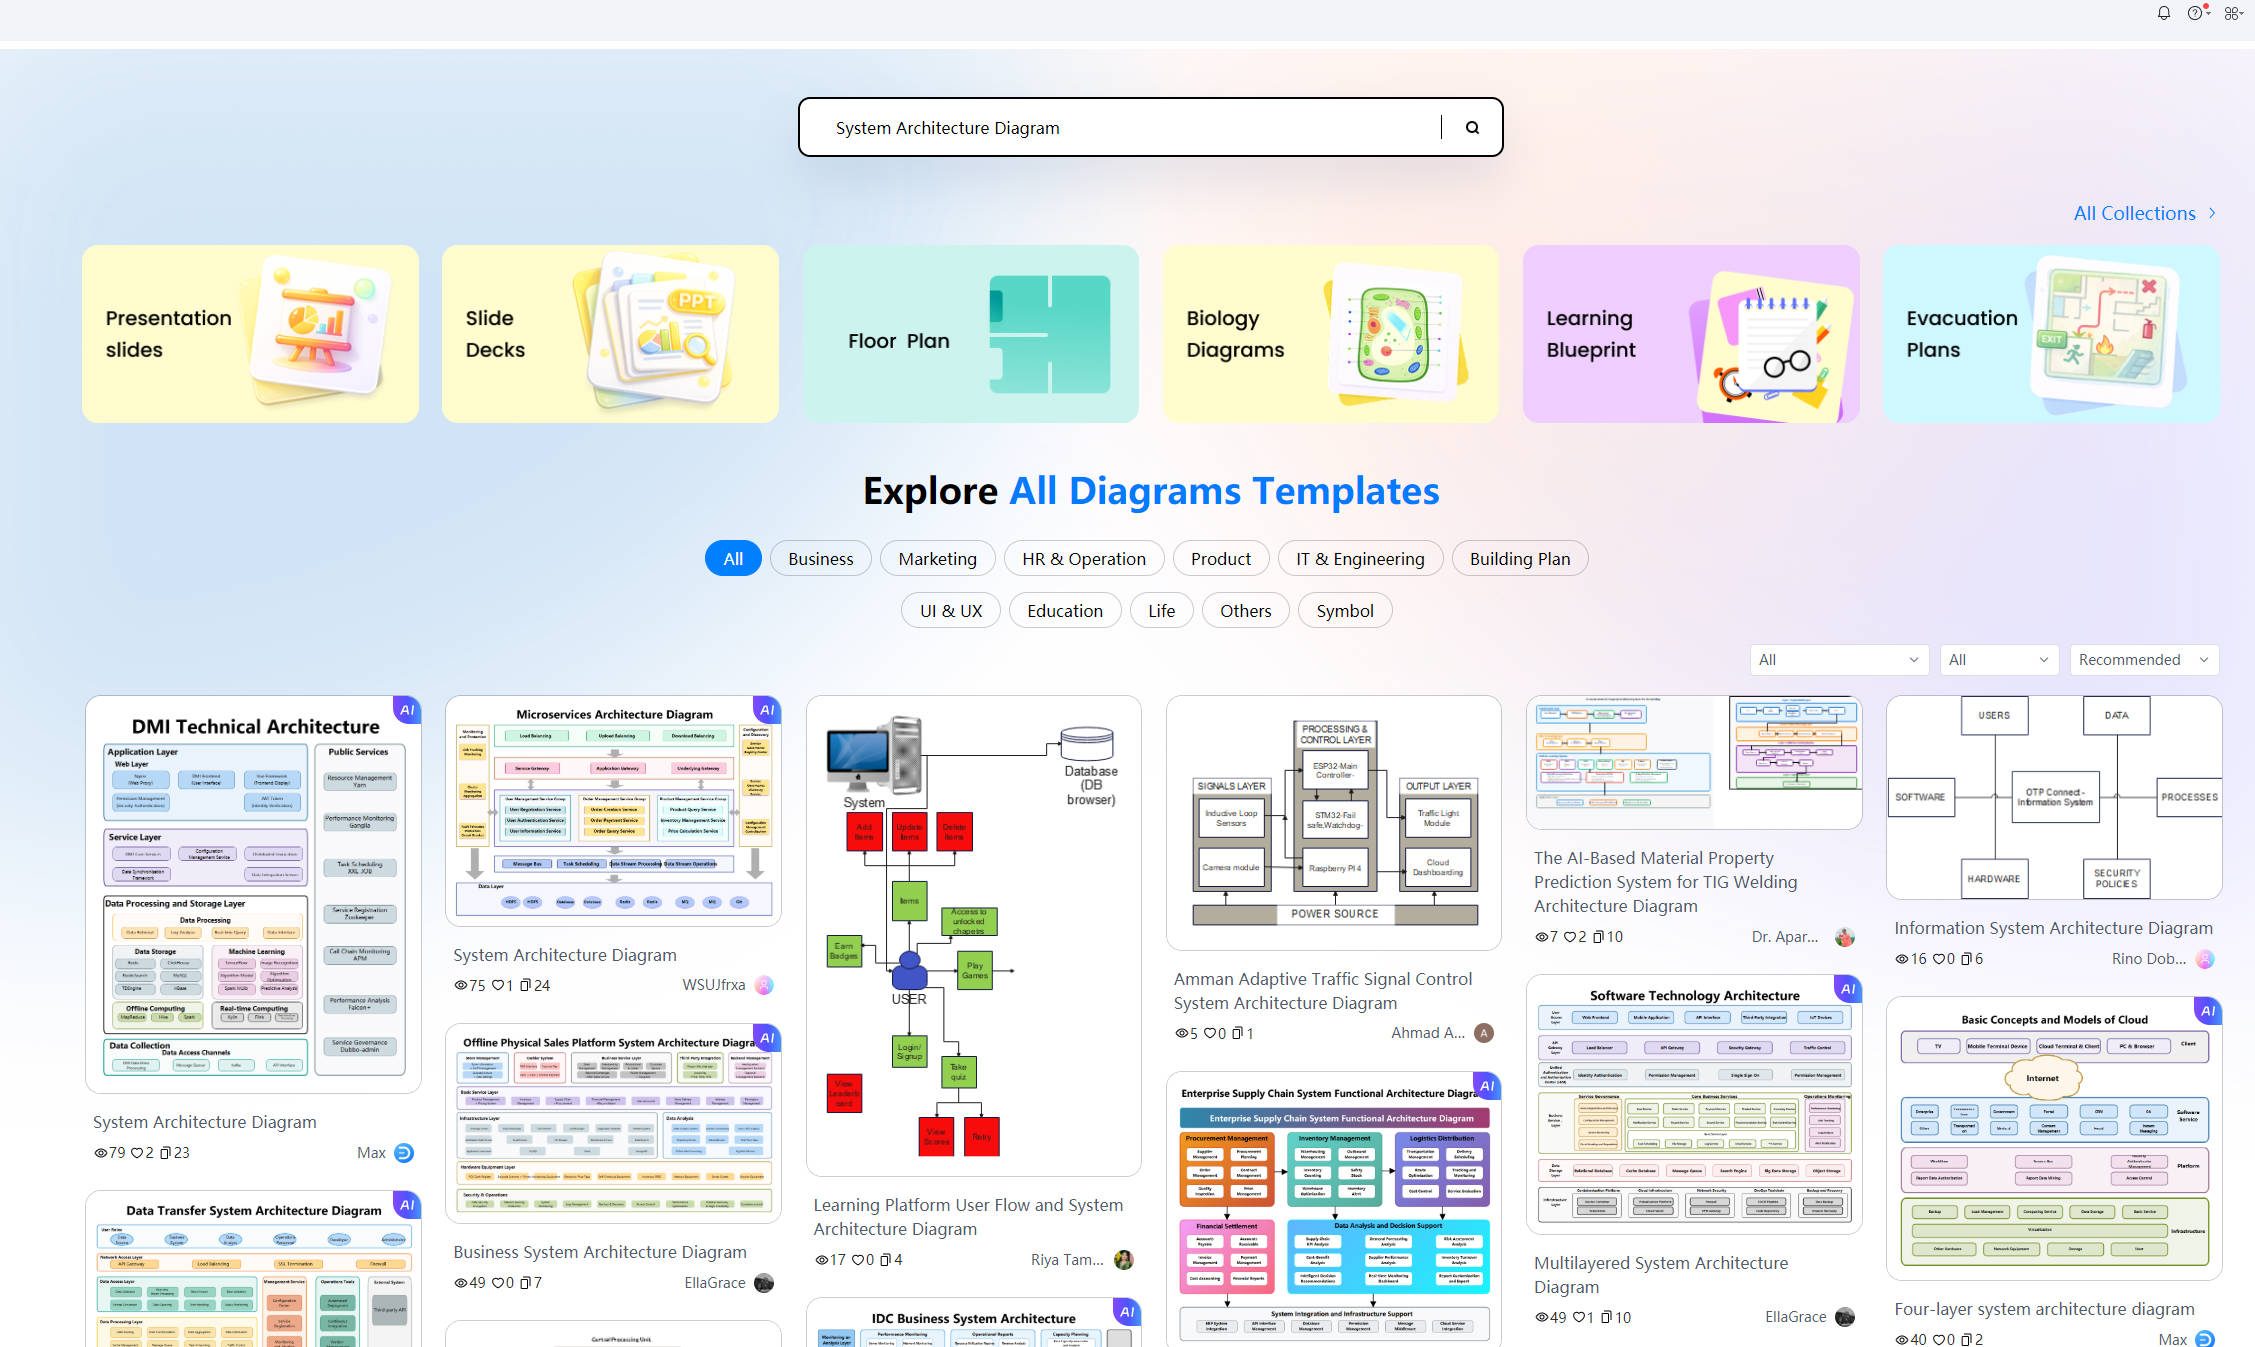
Choose from thousands of professional templates, including AWS, Azure, Google Cloud, and Microservices. Jumpstart your project in seconds instead of drawing from scratch.
Transform text prompts into structured architecture diagrams instantly using Edraw AI. Streamline your workflow with AI-powered layout optimization and smart content suggestions.

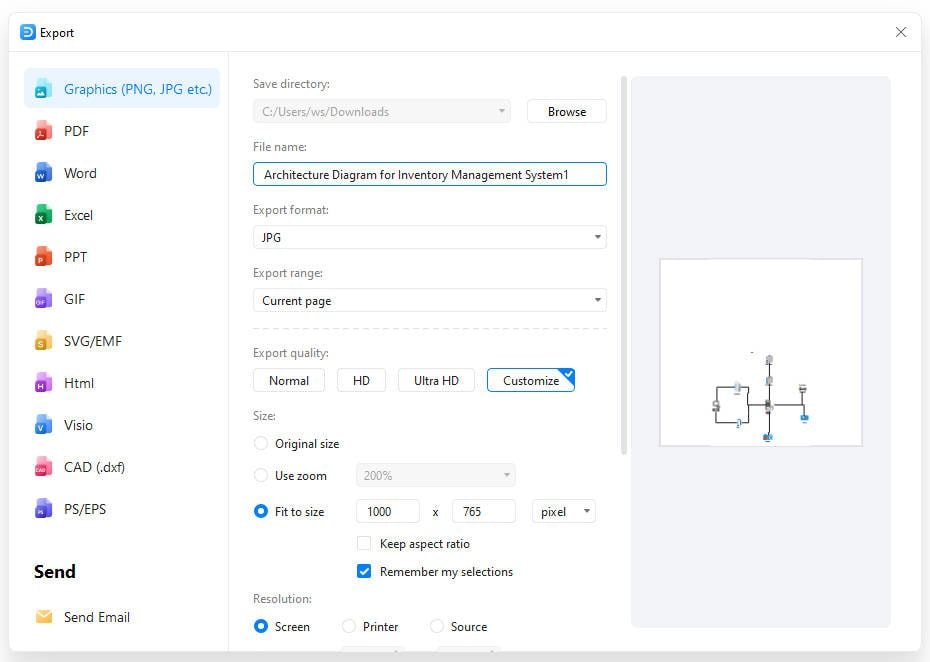
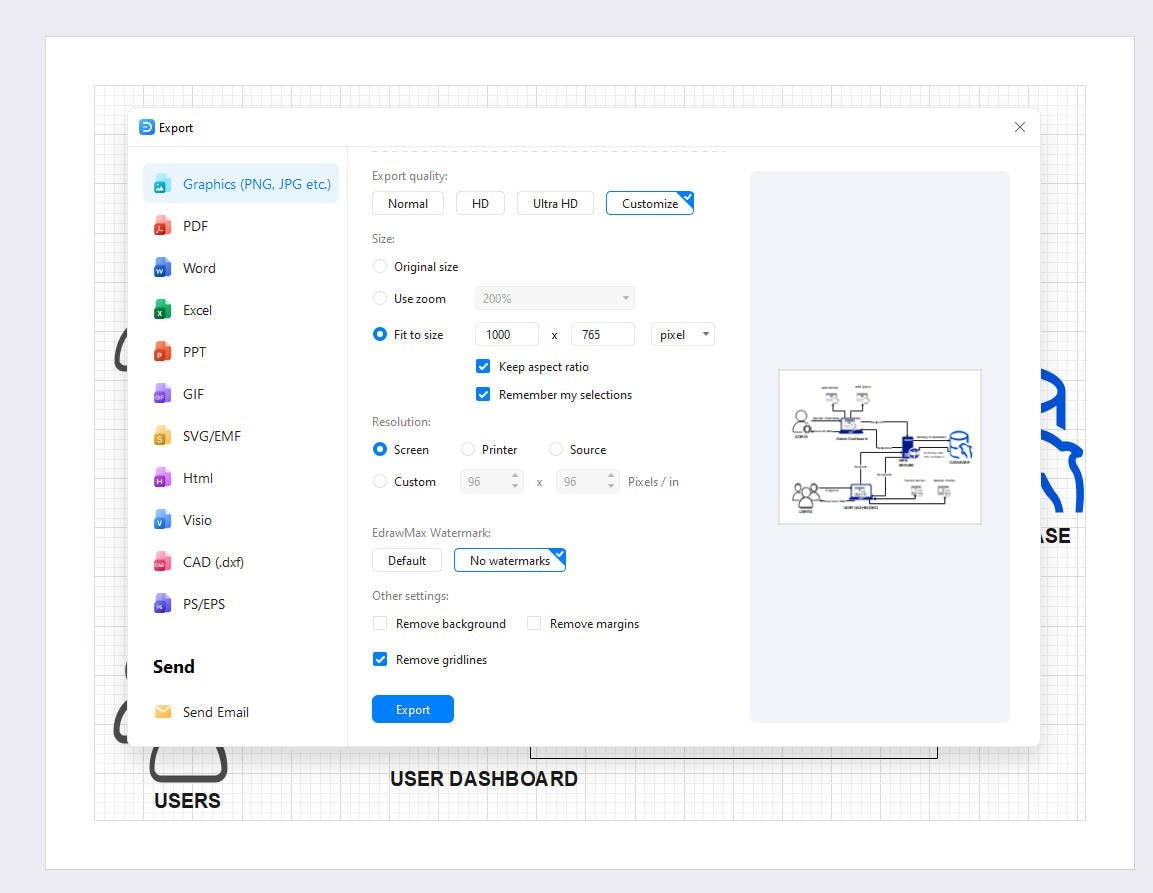
Export your designs to multiple formats including PNG, JPG, PDF, SVG, Word, and even Visio (VSDX). Share high-resolution diagrams for technical reviews or stakeholder presentations with one click.
How to Make a System Architecture Diagram in EdrawMax
What our users say
More Architecture Diagram Tools
Discover more AI-powered diagram makers to boost your productivity.
FAQs about system architecture diagram makers
-
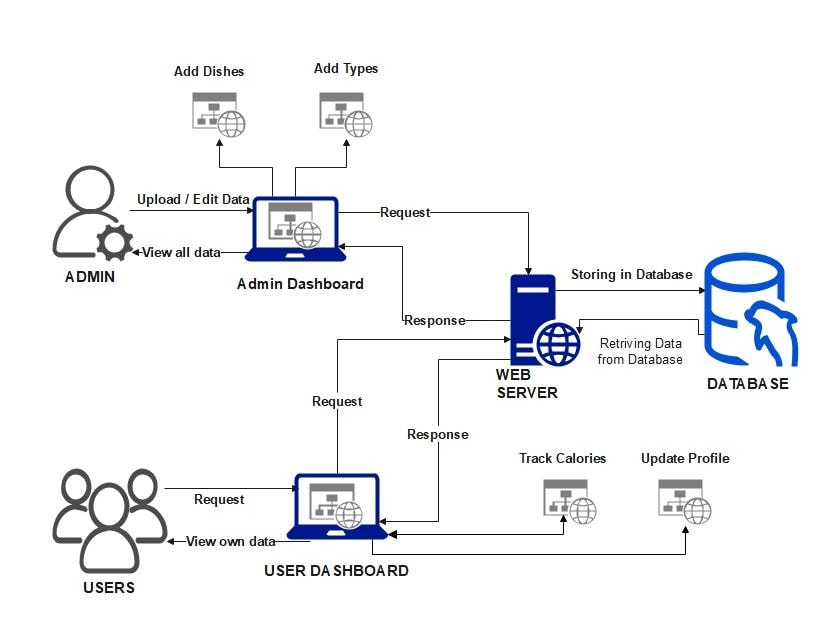
What is a system architecture diagram?A system architecture diagram is a visual representation that illustrates the structure, components, and interactions within a software system. It provides a high-level overview of how different parts of the system, such as servers, databases, and APIs, work together to deliver functionality and meet specific technical requirements or business goals.
-
Why are system architecture diagrams important for development?These diagrams are crucial because they serve as a blueprint for developers and stakeholders. They help identify potential bottlenecks, security risks, and integration points early in the design phase. By visualizing the system, teams can communicate more effectively, ensure technical alignment, and simplify the onboarding process for new team members.
-
What key components are typically included in these diagrams?A standard system architecture diagram usually features core components like web servers, application layers, databases, and external APIs. It also includes networking elements such as load balancers, firewalls, and content delivery networks. Arrows are used to indicate the flow of data and the nature of connections between these various components.
-
What are the different types of system architecture diagrams?There are several types, including logical, physical, and infrastructure diagrams. Logical diagrams focus on functional components and data flow, while physical diagrams show actual hardware and server locations. Infrastructure diagrams specifically detail cloud services and network configurations. Choosing the right type depends on whether you are documenting logic or deployment.
-
What are some best practices for designing clear diagrams?To ensure clarity, use standardized symbols and consistent color coding for different types of components. Keep the layout organized by minimizing crossing lines and grouping related elements together. Always include a legend to explain symbols and maintain a logical flow, typically from left to right or top to bottom.
Stop drawing. Start describing.
AI diagramming isn't just text-to-diagram.
AI now understands any input, fetches live data, adapts through dialogue, and works everywhere.