Free tree diagram maker
Build connections, explain relations, and brainstorm ideas, all with EdrawMax’s free tree diagram maker. Simplify complicated diagrams using EdrawMax’s user-intuitive interface.

Why Use EdrawMax Tree Diagram Maker?
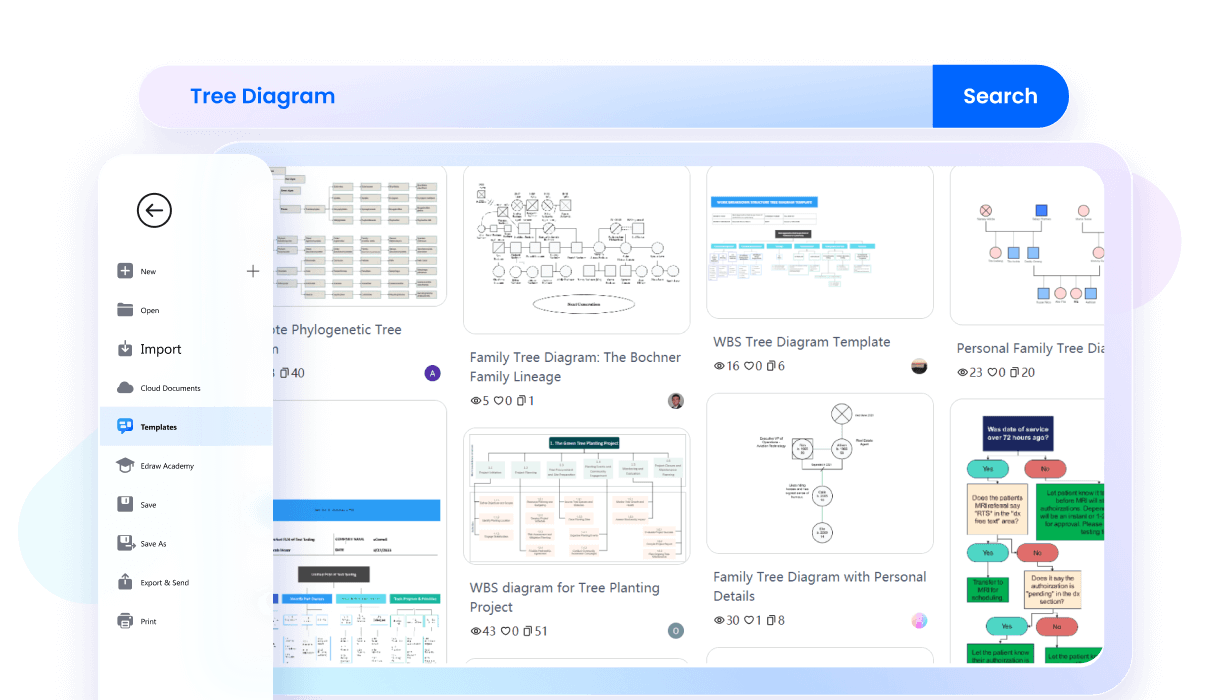
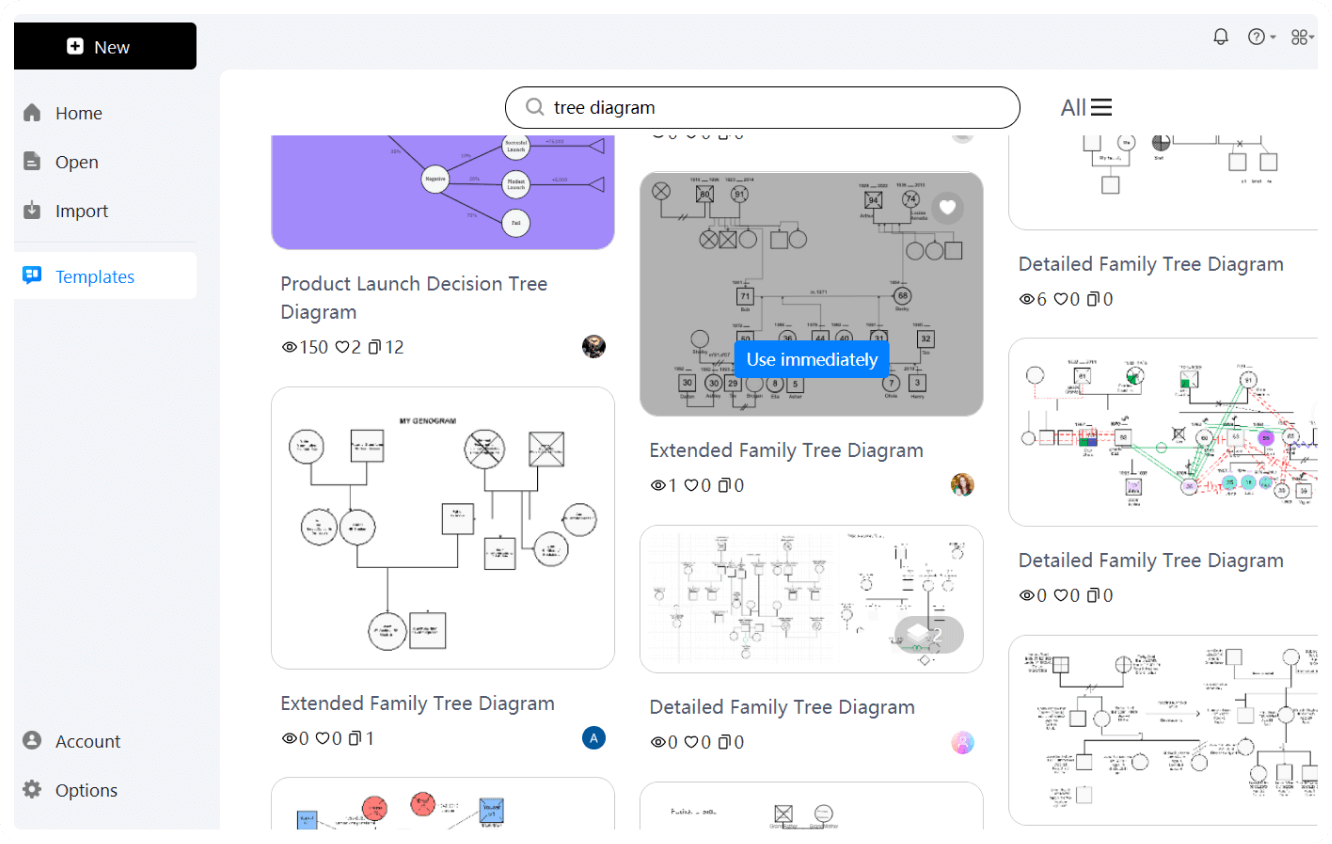
EdrawMax is simply the best way to create foolproof tree diagrams. While you can certainly construct your tree diagram from scratch, EdrawMax’s vast template community also allows you to design using a tree example. All you need is to find the right example that fits your needs and customize it away!
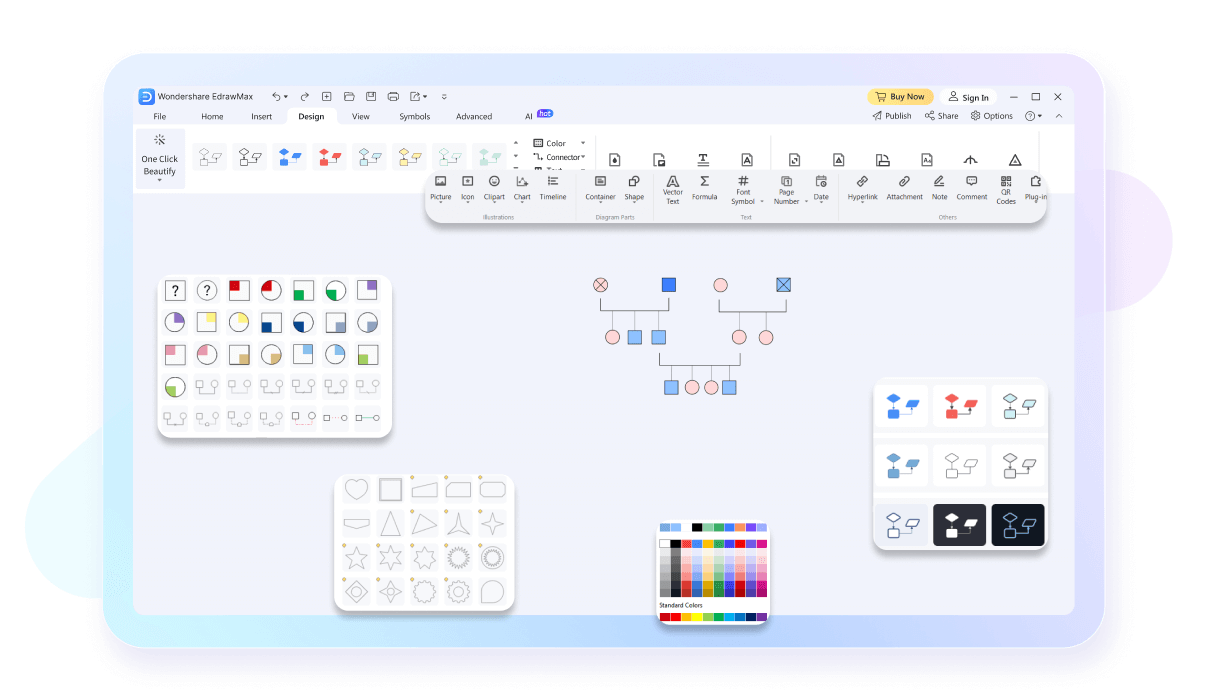
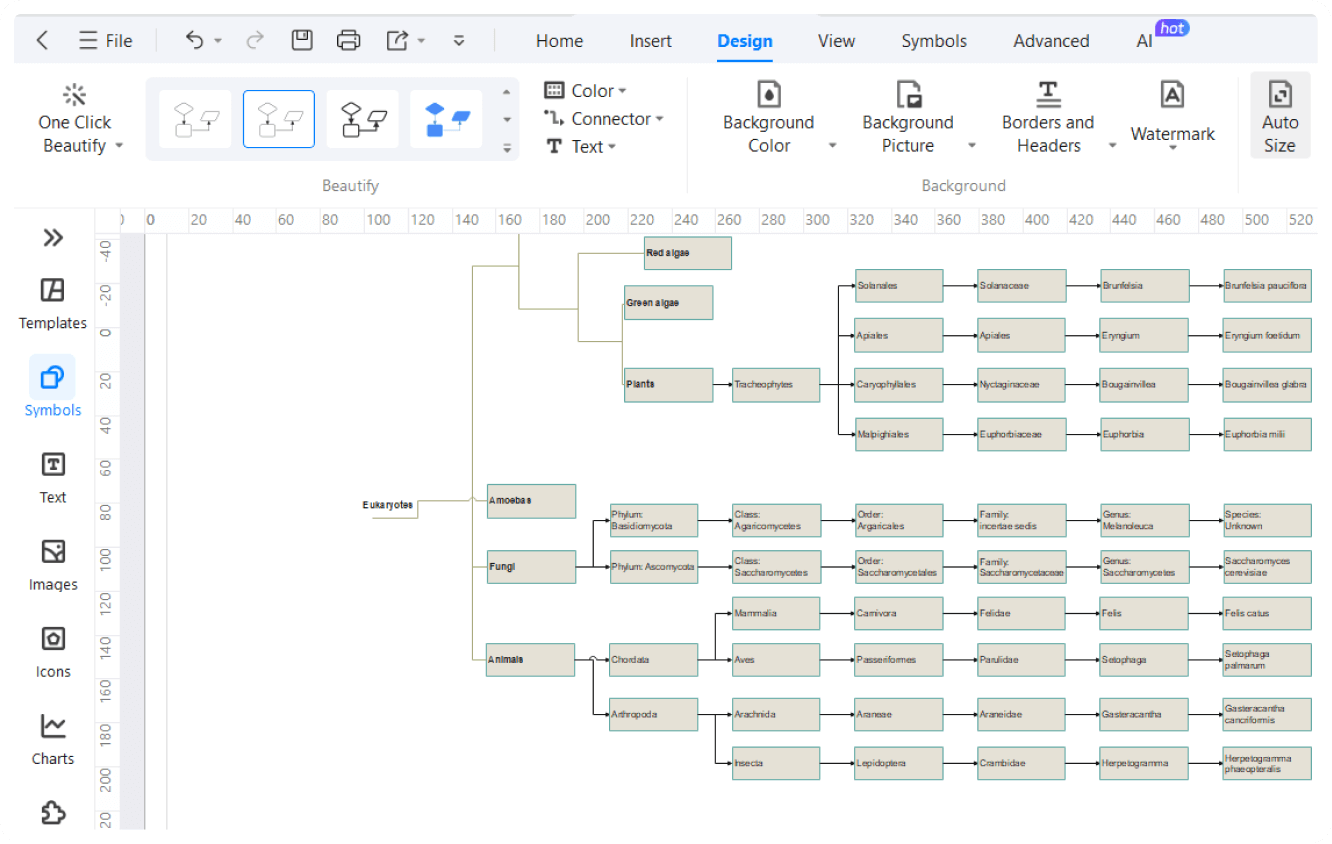
From basic to complex, EdrawMax has the features to create all types of decision tree diagrams. Compare information and visualize structures by adding formulas, and texts, and even create hierarchical data layers. Simplify and amplify your creation process even more through the AI tools, and give prompts to the AI chat assistant for faster, more innovative diagramming.

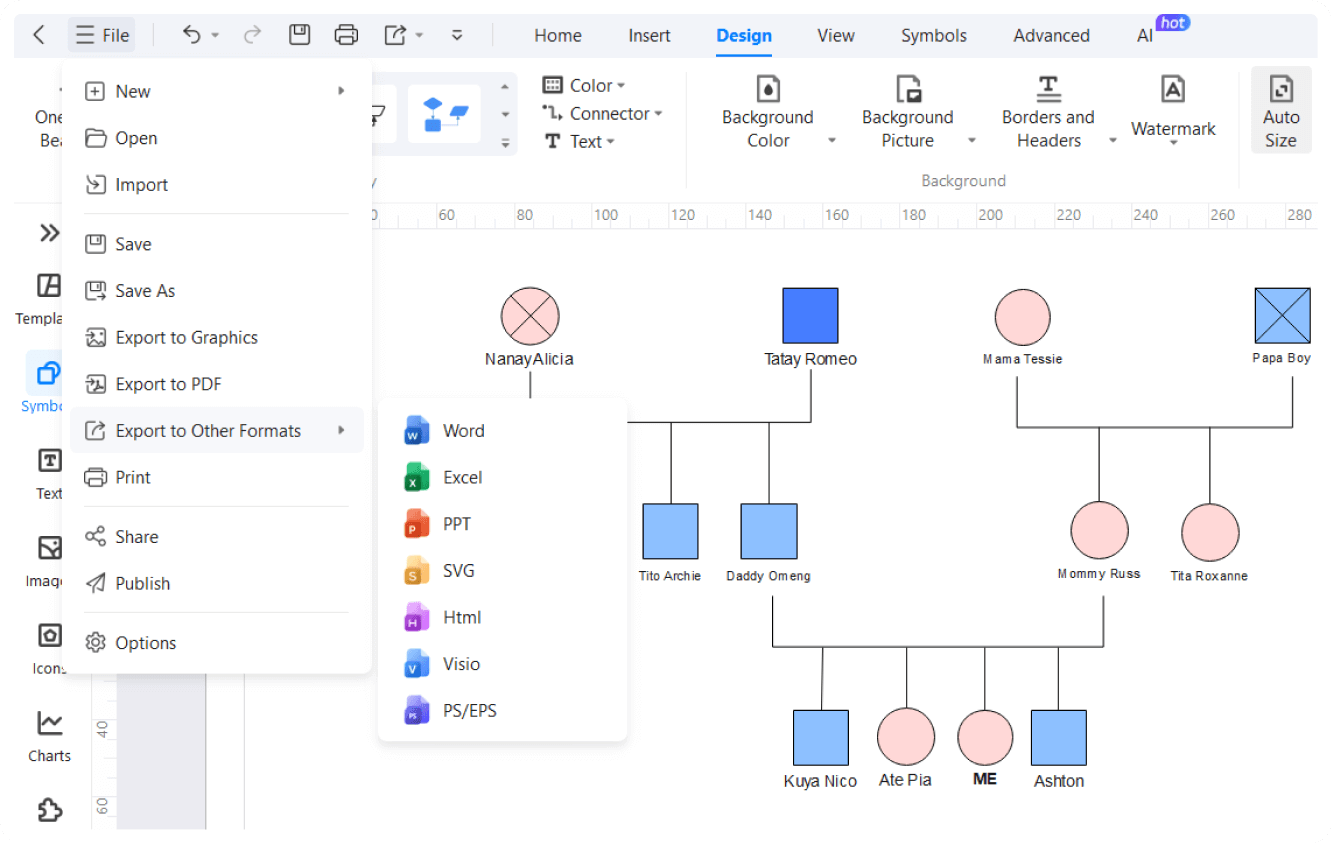
With over 26000 symbols, and the ability to resource pictures through Pixabay, EdrawMax has the flexibility to customize the diagrams however you like. Whether you need to add a node, connector, or branch to your tree chart, EdrawMax has it covered. Additionally, the interface uses easy drag-and-drop design tools keeping the non-tech users in mind.
EdrawMax provides its users with a collaborative workspace, allowing team members to comment, share ideas, and give instant feedback on your tree diagram. This allows the whole team to be aware of what’s new in your creation. You can also share your files on social media or publish them on websites.

How to Make a Tree Diagram in 3 Simple Steps
What our users say
More Tree Diagram Tools
Discover more AI-powered diagram makers to boost your productivity.
FAQs About EdrawMax Tree Diagram Tools
-
What is a tree diagram?A tree diagram is a visual tool used to represent a sequence of events, hierarchical structures, or possible outcomes of a probability experiment. It starts with a single node and branches out into multiple paths. Each branch represents a specific choice or event, making complex information easier to visualize and analyze.
-
What are the main components of a tree diagram?A tree diagram consists of nodes, which represent decision points or events, and branches, which represent the possible outcomes or paths. The "root" is the starting point, while "leaves" are the final outcomes at the end of the paths. Connecting these elements creates a clear, logical flow of information.
-
Can tree diagrams be used for linguistics?Yes, in linguistics, tree diagrams are used to illustrate the syntactic structure of sentences. They show how words group together into phrases and how those phrases combine to form a complete sentence. This visual representation helps linguists analyze the grammatical relationships and hierarchical organization within different languages and dialects.
-
What is the difference between a tree diagram and a flow chart?While both visualize processes, a tree diagram specifically focuses on hierarchical structures or branching outcomes from a single starting point. A flow chart is more versatile, showing sequential steps, loops, and decision points that may merge back together. Tree diagrams are strictly divergent, moving from one root to many ends.
-
How to create a tree diagram?Start by identifying the main topic or initial event as your root. Draw branches for each primary category or outcome, then continue branching out for sub-categories or subsequent events. Keep labels concise and ensure the logic flows consistently from left to right or top to bottom to maintain clarity.
Learn about Tree Diagram
Stop drawing. Start describing.
AI diagramming isn't just text-to-diagram.
AI now understands any input, fetches live data, adapts through dialogue, and works everywhere.
Free Tree Diagram templates from EdrawMax