3-set Venn diagram
This example illustrates a three-circle Venn diagram labeled A, B, and C.
- Templates
- Venn diagram templates
- 3 set venn diagram
About this template
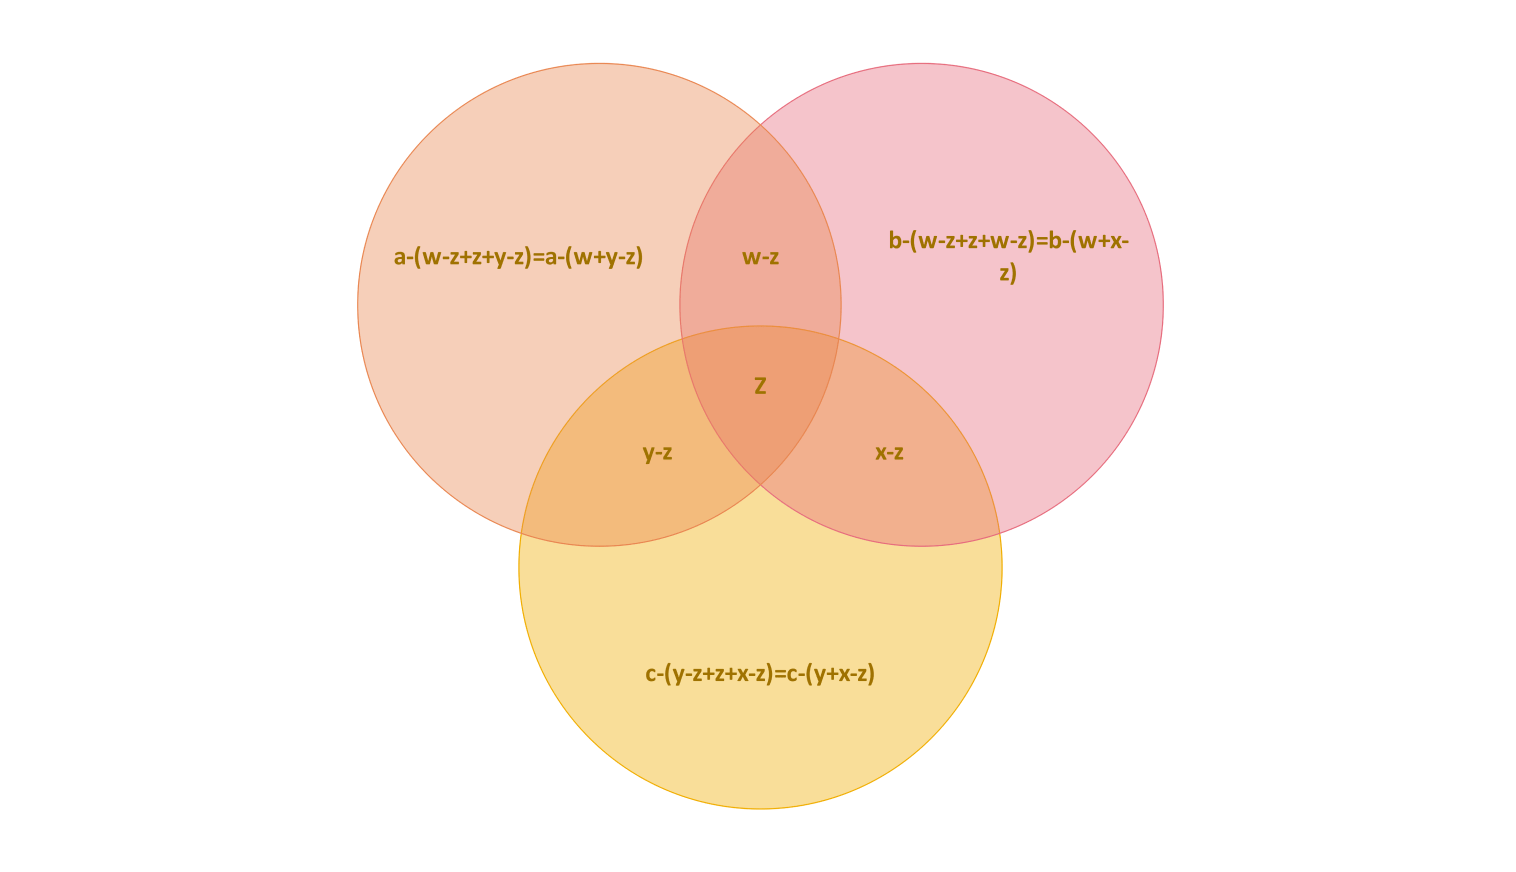
The Venn diagram formula is a mathematical tool to determine the relationships and overlaps between sets. This example illustrates a three-circle Venn diagram: A, B, and C.
Each section of the diagram represents a unique combination of the sets and their overlaps, making it easier to analyze complex relationships.
In this diagram:
- Elements exclusive to A are calculated as a - (w + y - z).
- For B, it’s b - (w + x - z), and for C, it’s c - (y + x - z).
The overlaps:
- Between A and B: w - z
- Between B and C: x - z
- Between A and C: y - z
- Common to all three sets: z
The formula for the total count across all sets is:
- [a - (w + y - z)] + [b - (w + x - z)] + [c - (y + x - z)] + (w - z) + (x - z) + (y - z) + z.
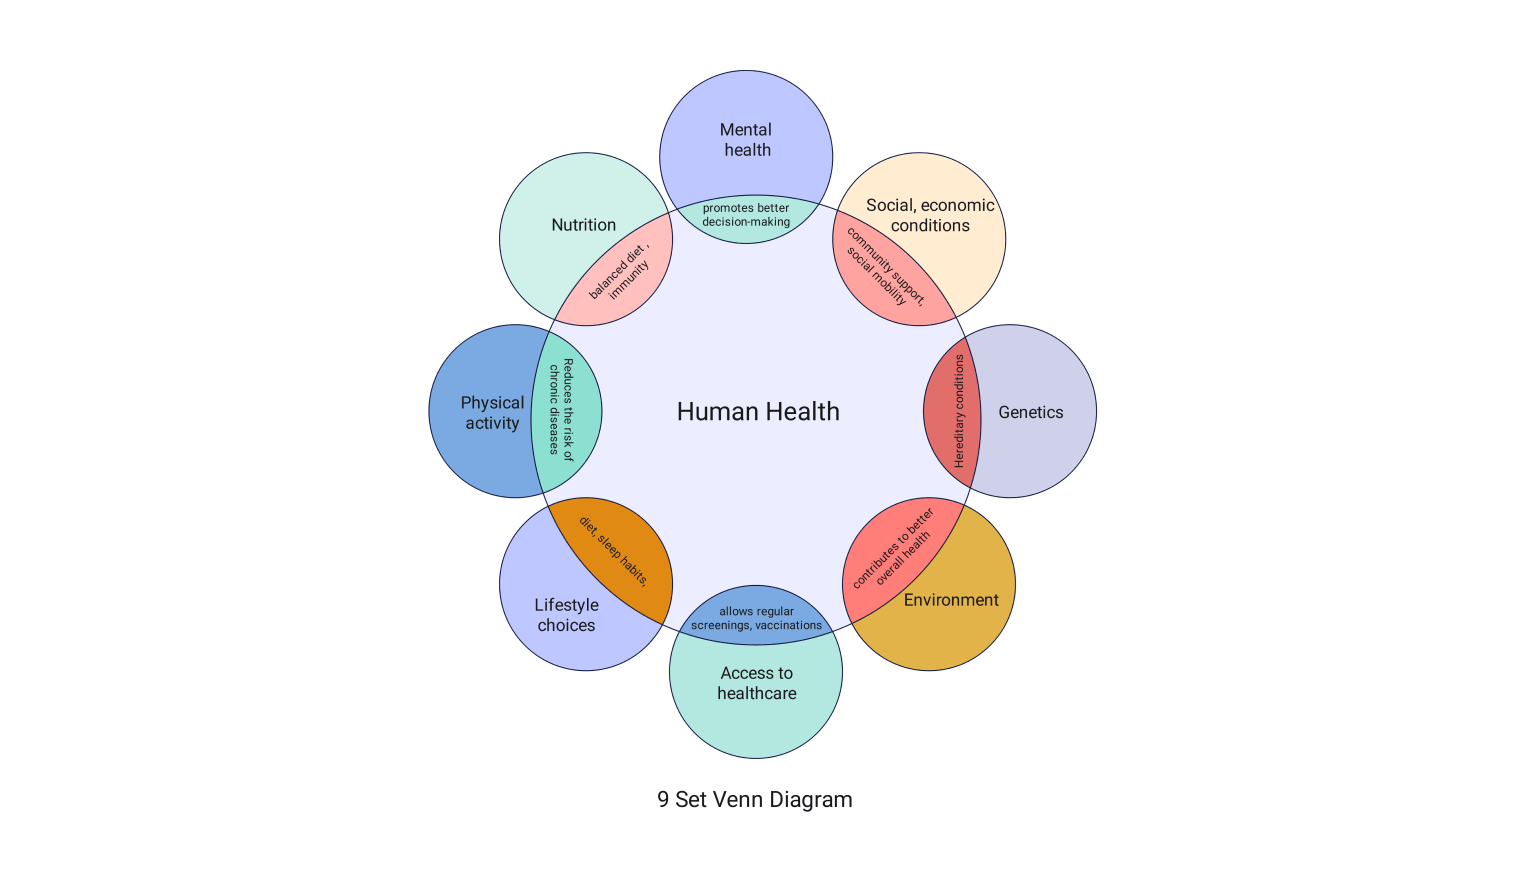
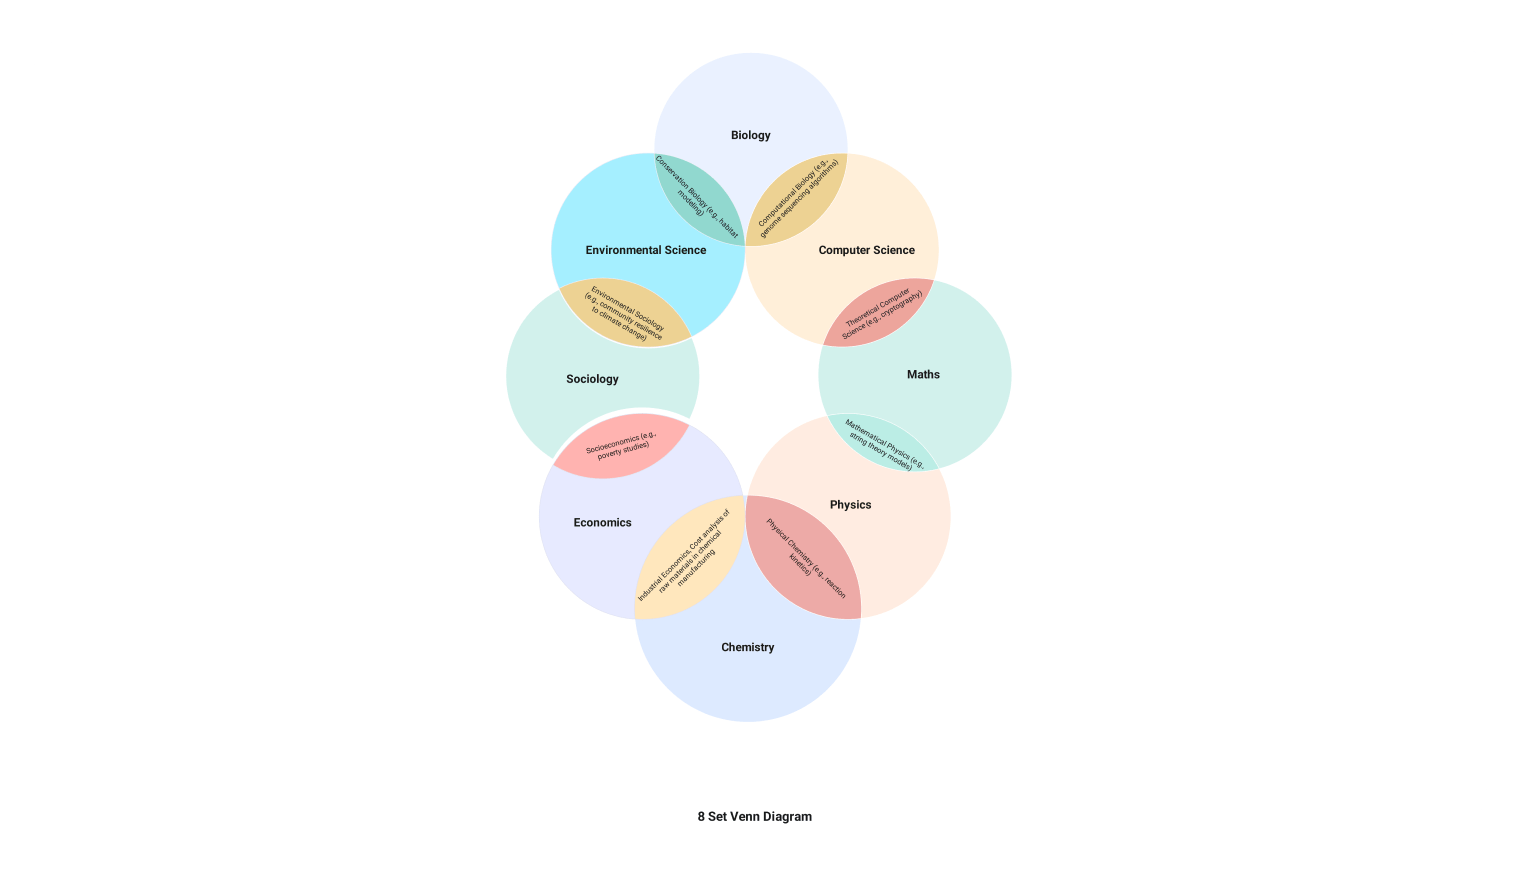
Venn diagrams, also called set diagrams or logic diagrams, are widely used across disciplines like mathematics, logic, computer science, business, and linguistics. Their visual representation simplifies understanding of relationships and overlaps in data.
Related templates

Get started with EdrawMax today
Create 210 types of diagrams online for free.
Free Download Free Download Draw a diagram free Draw a diagram free Draw a diagram free