5-set Venn diagram
Demonstrate more complex topics with this five-set Venn diagram template.
- Templates
- Venn diagram templates
- 5 set venn diagram
About this template
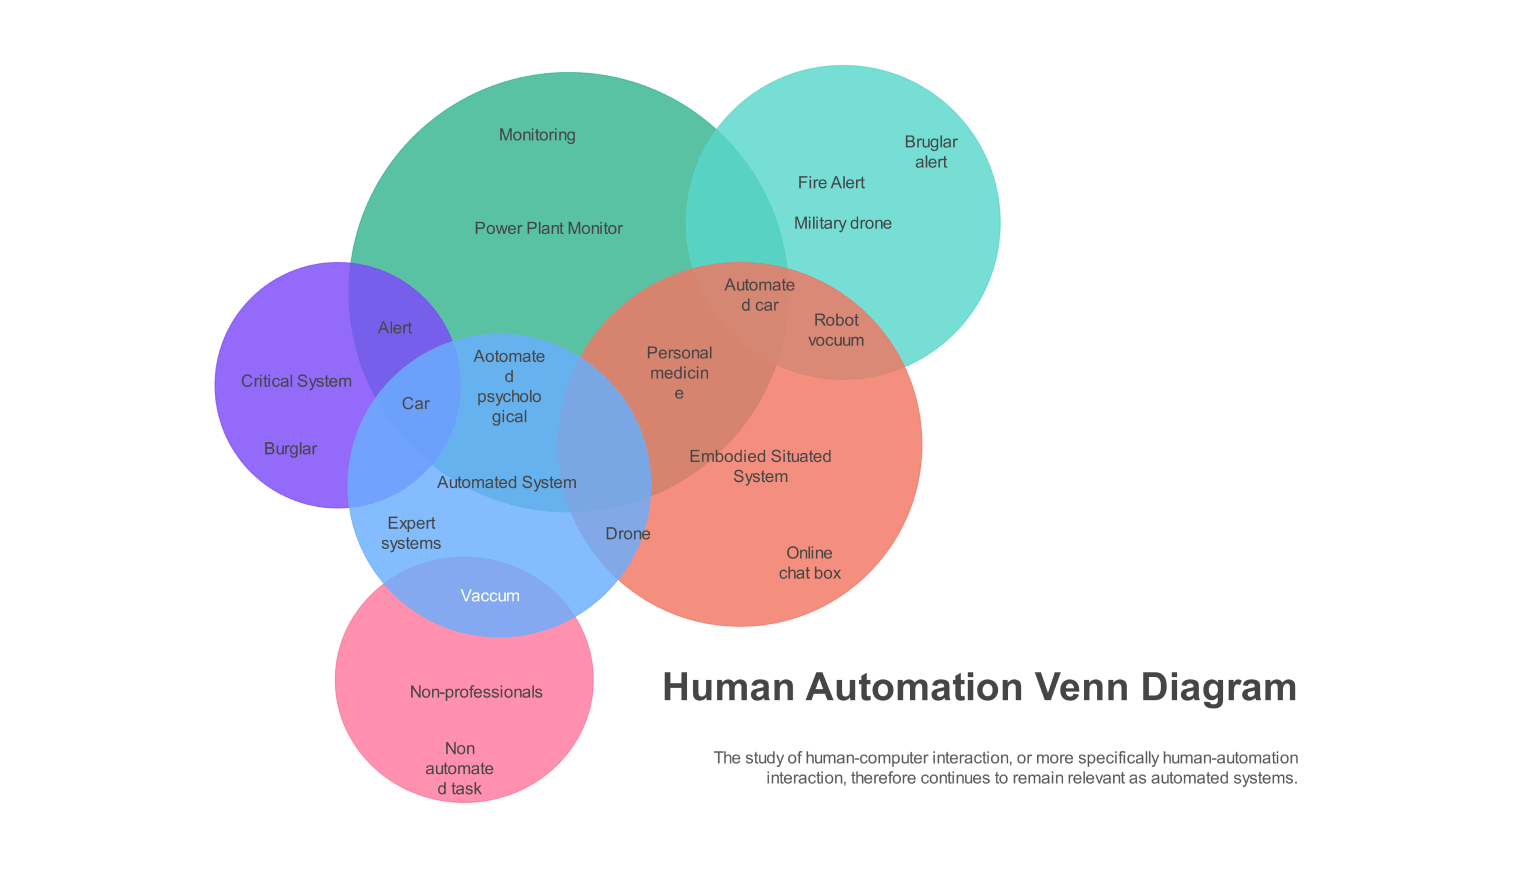
Five-set Venn diagrams represent one of the most complex yet valuable variations of the traditional Venn diagram concept. These diagrams can display up to 32 distinct intersections, making them useful tools for analyzing multiple overlapping data sets.
Unlike simpler two or three-set versions, five-set Venn diagrams require careful geometric arrangement to show all possible relationships. The circles must be positioned precisely to create proper overlapping regions. This complexity makes them particularly suitable for advanced data visualization in bioinformatics, systems analysis, and comparative studies.
The example shown demonstrates their application in human-automation systems. Each circle represents a distinct category, with overlapping areas showing relationships and shared characteristics between different systems. The design uses color coding to help distinguish between the main sets, making tracking relationships across multiple intersections easier.
However, these diagrams do have limitations. As the number of sets increases, the visual complexity can make interpreting them challenging. The small intersection areas in some regions might be difficult to label clearly. Despite these challenges, they remain valuable tools for complex analysis.
In modern applications, software tools have made creating these diagrams more accessible. Digital versions can be interactive, allowing users to highlight specific intersections or extract data from particular overlapping regions. This adaptability has expanded their use in data science, research presentations, and systems analysis.
Related templates
Get started with EdrawMax today
Create 210 types of diagrams online for free.
Free Download Free Download Draw a diagram free Draw a diagram free Draw a diagram free