About this Activity Diagram for Stock Management System template
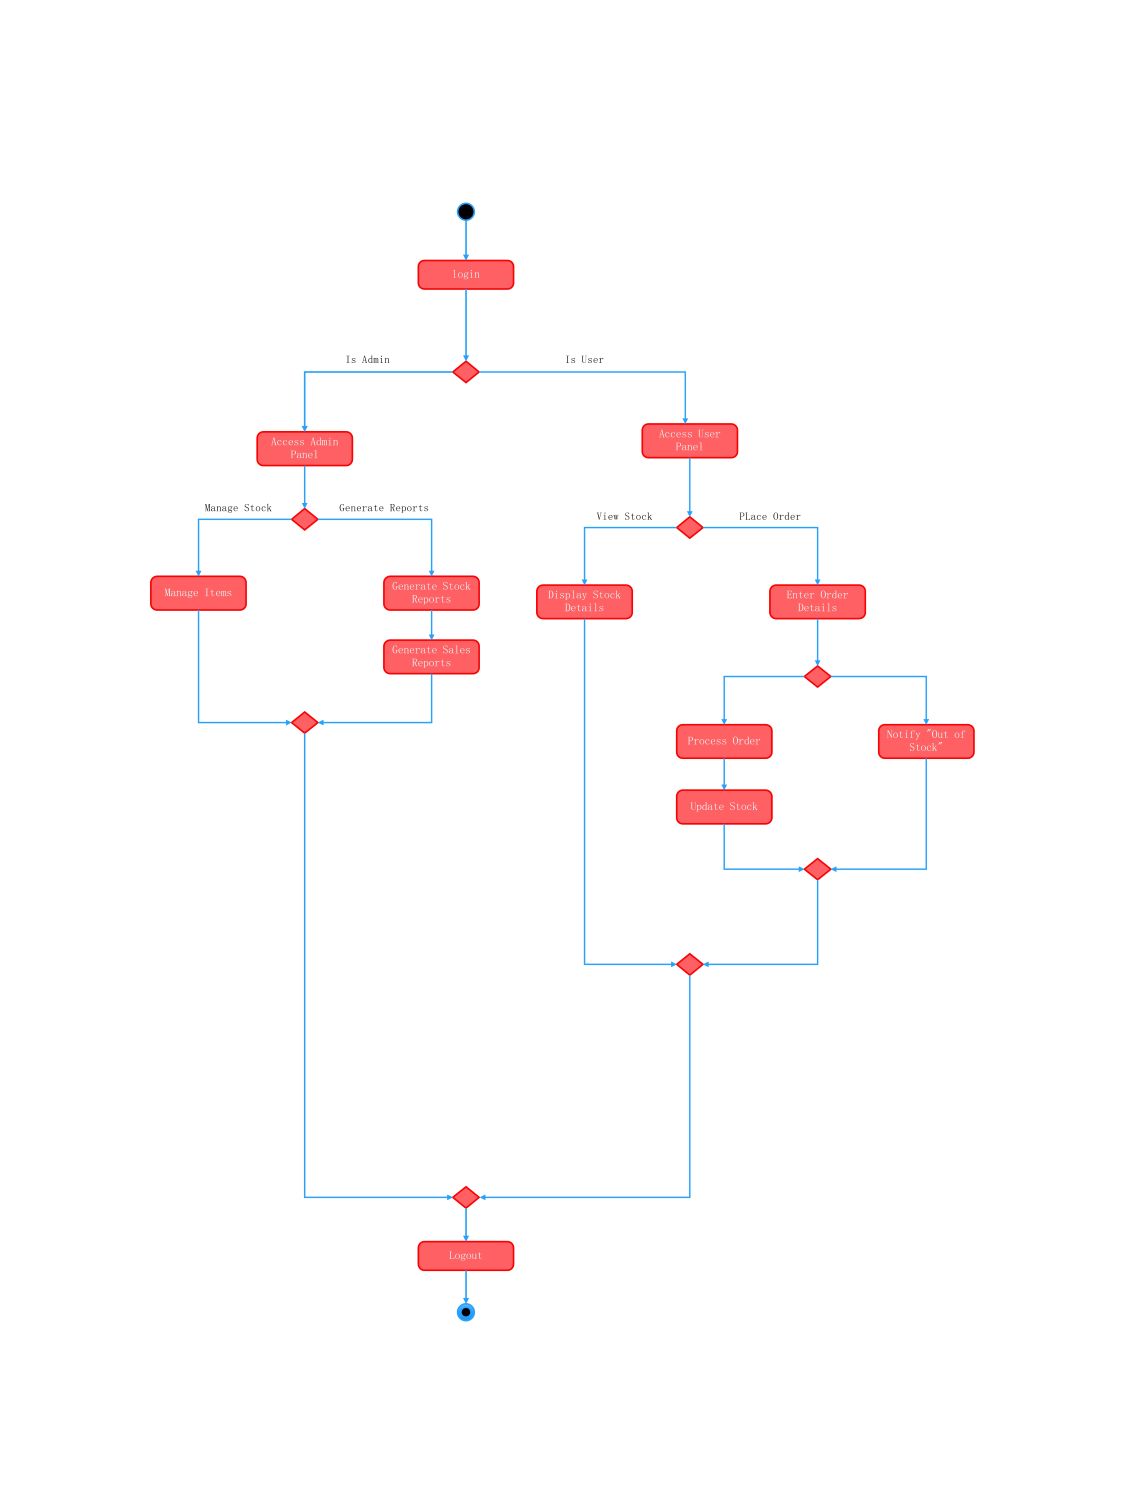
This template provides a clear visual guide for building or analyzing an inventory software. It outlines specific paths for administrators and customers to ensure smooth operations from login to logout.
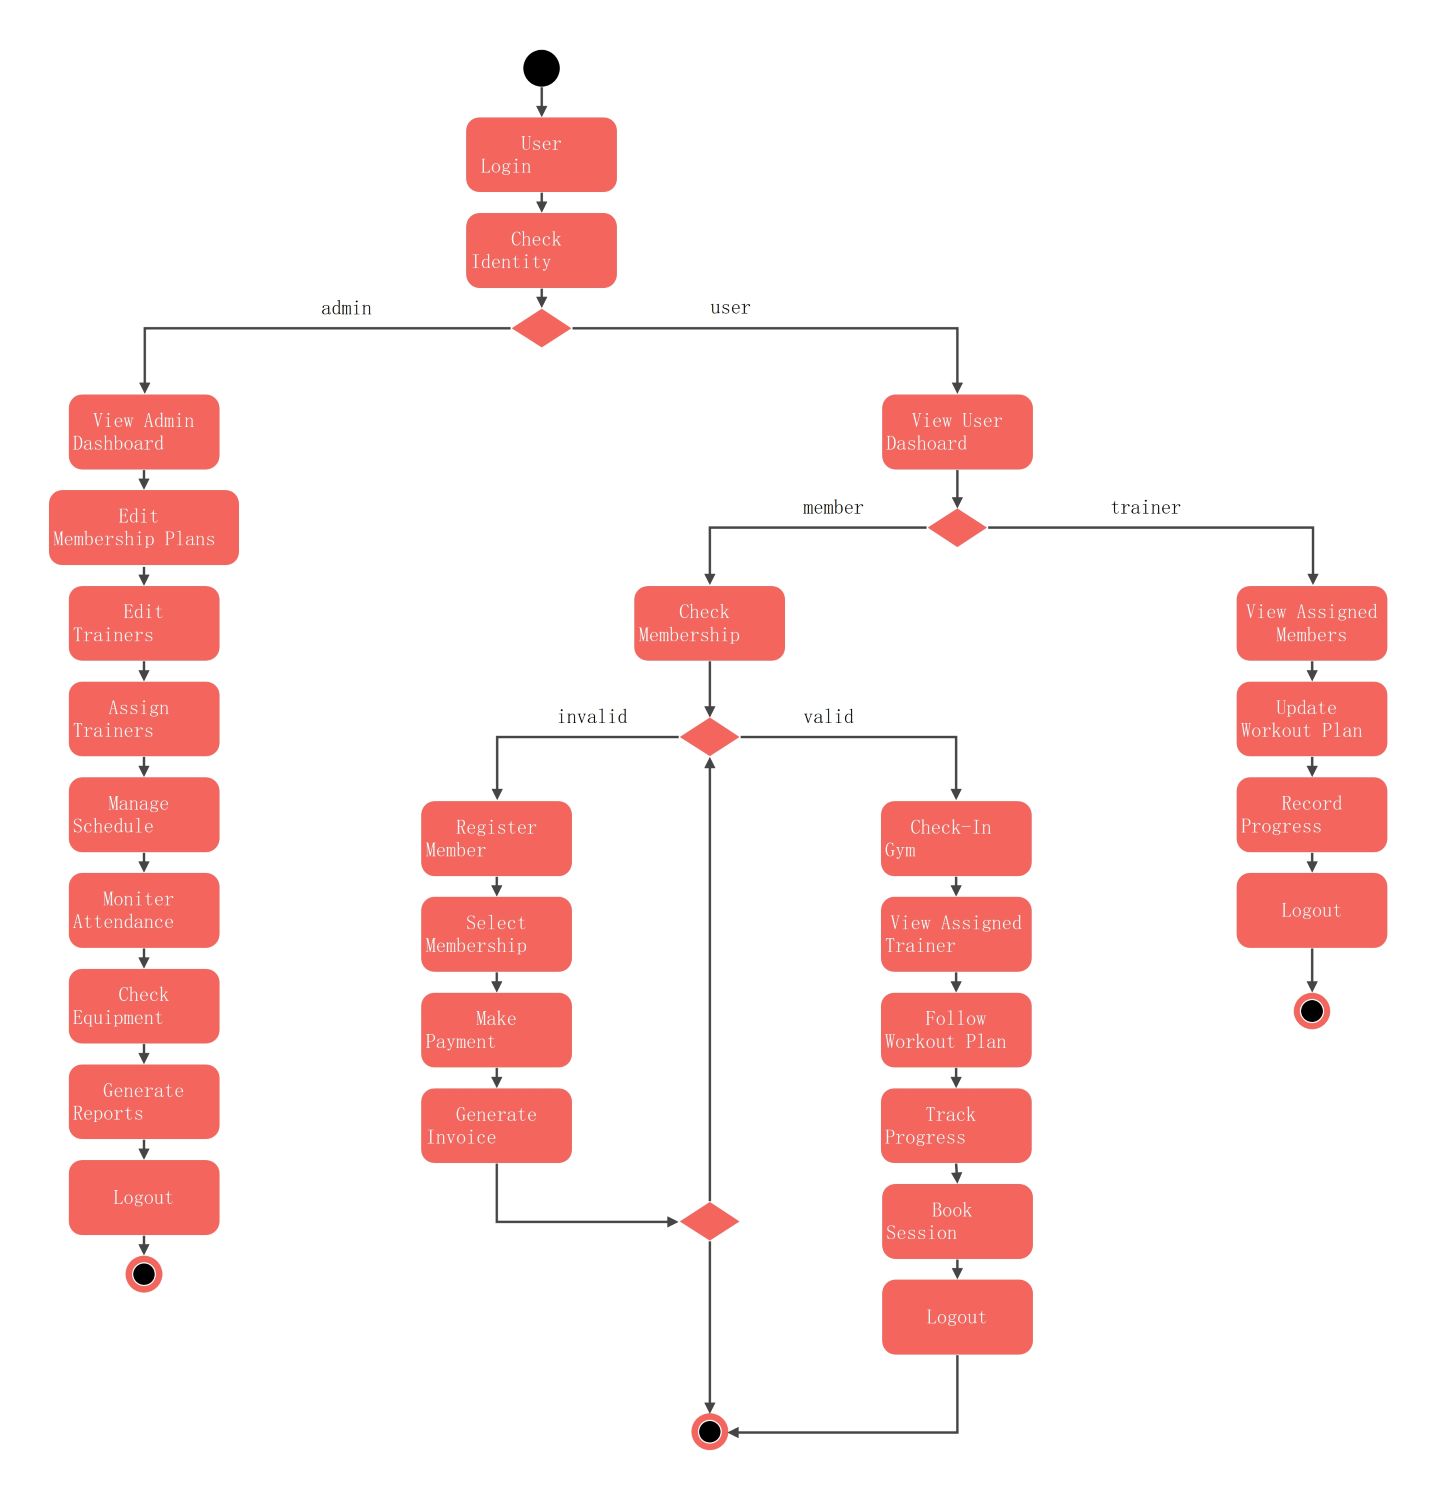
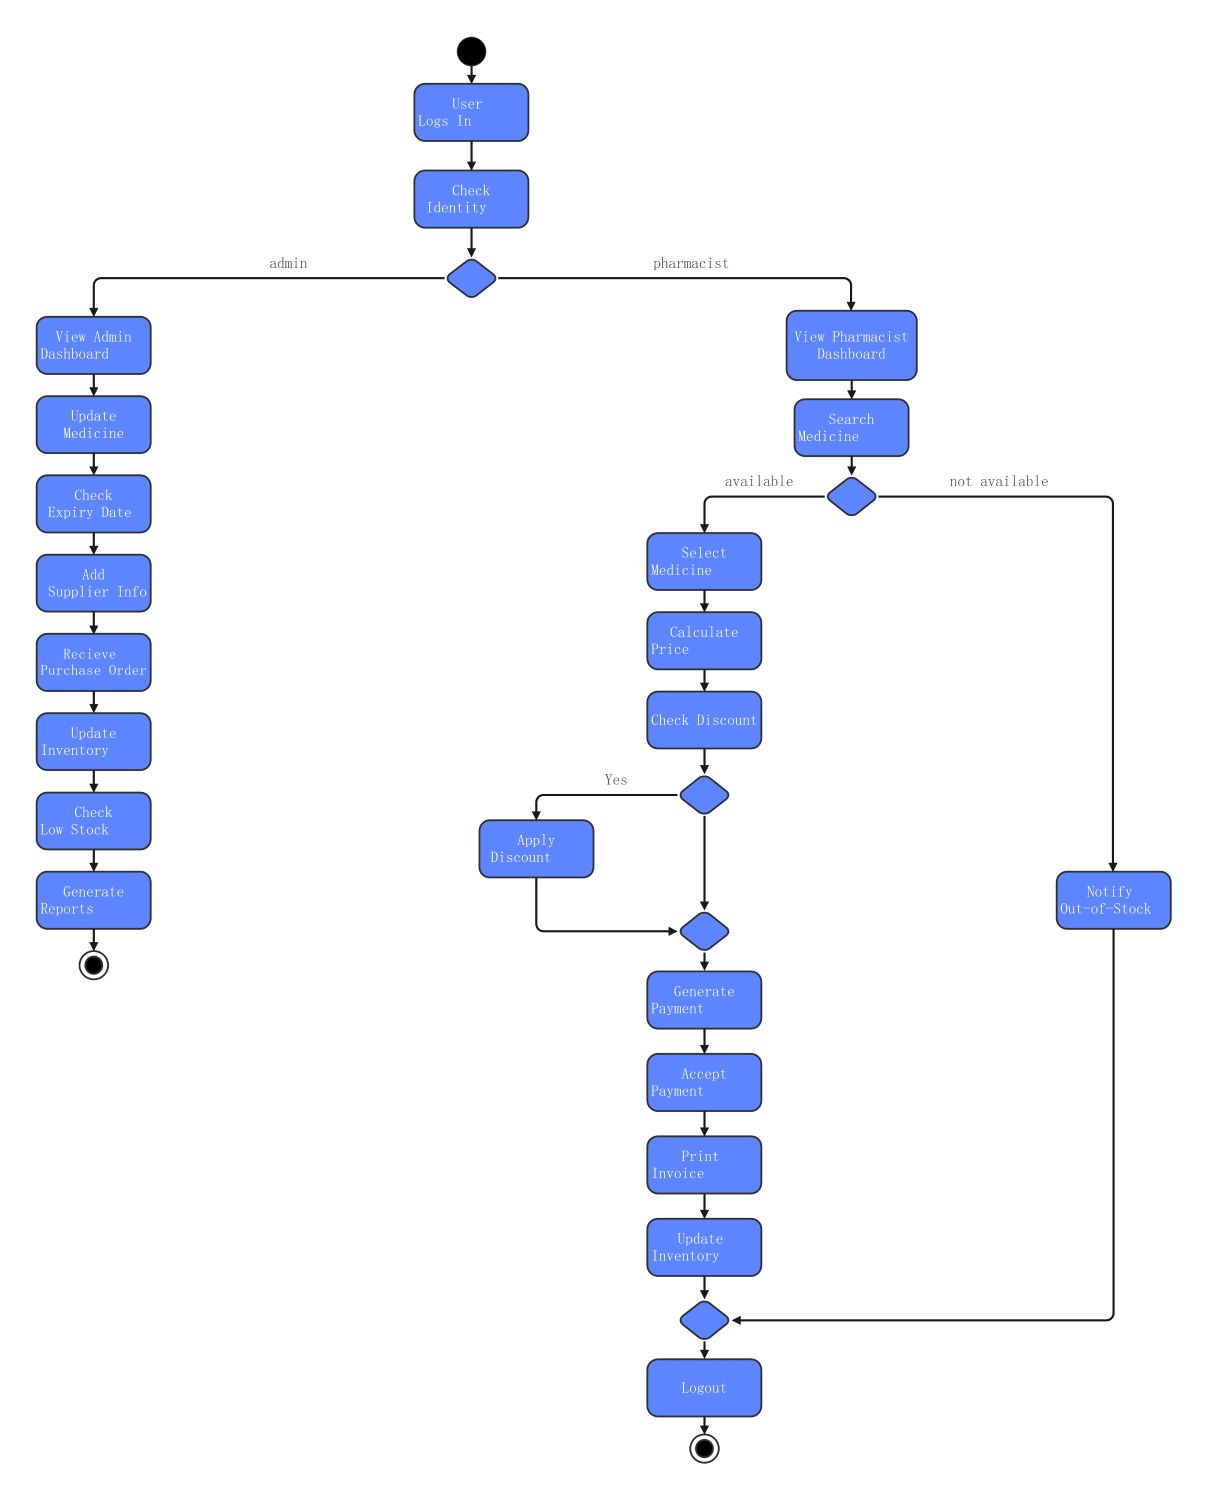
Authentication and Role Selection
The system begins with a secure login process that directs users based on their credentials. This stage ensures that only authorized personnel access the administrative tools while regular users see the customer-facing panel.
- Login credentials entry
- Role verification check
- Access Admin Panel for staff
- Access User Panel for customers
Administrative Management Actions
Administrators have the power to maintain the inventory and review performance through data exports. This section focuses on backend control to keep the stock levels accurate and provide insights via detailed reports.
- Manage items in inventory
- Generate stock status reports
- Generate sales data reports
- Update product information
User Ordering and Inventory Interaction
Customers or users interact with the system to browse available goods and make purchases. The flow handles stock availability checks automatically to prevent orders of items that are currently unavailable in the warehouse.
- Display stock details
- Enter order information
- Process valid orders
- Update stock levels post-purchase
- Notify about out-of-stock items
FAQs about this Template
-
What is the primary purpose of an activity diagram in stock management?
The primary purpose is to visualize the step-by-step workflow of the inventory system. It helps stakeholders understand how data flows between different actors, such as admins and users. By mapping out processes like order placement and report generation, developers can identify potential bottlenecks or logic errors before the actual coding phase begins in the project.
-
How does the system handle out-of-stock scenarios in this diagram?
In this activity diagram, the system includes a decision node specifically for stock availability. When a user enters order details, the system checks the current inventory levels. If the item is unavailable, it triggers a notification to the user stating the item is out of stock. This prevents order processing errors and ensures that customers receive immediate feedback.
-
Why are separate paths created for admins and users?
Separate paths are essential for security and functional clarity within a stock management system. Administrators require access to sensitive tasks like item management and sales report generation. Users, however, only need to view products and place orders. Separating these flows ensures that regular users cannot modify inventory data, maintaining the integrity and security of the entire business database.