Simple Venn diagram
This diagram allows you to compare different concepts and analyze them together.
- Templates
- Venn diagram templates
- Basic venn diagram
About this template
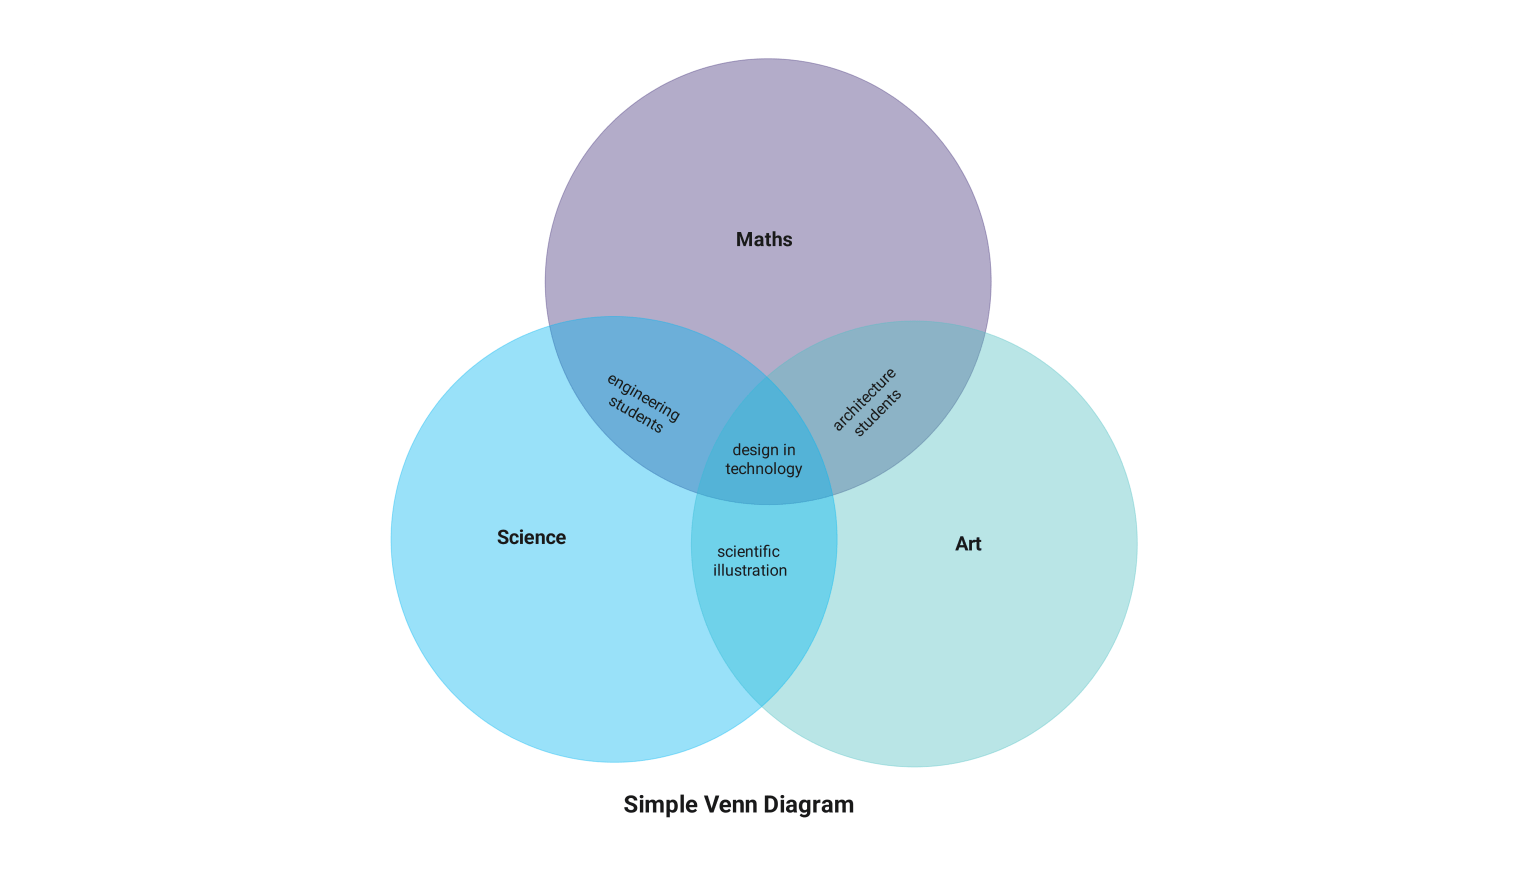
Simple three-set Venn diagrams represent the classical approach to visualizing relationships between overlapping categories. The structure consists of three intersecting circles, each representing a distinct domain. The example illustrates the interconnections between Mathematics, Science, and Art.
This template can reveal intersections between fields. The overlapping regions highlight specialized areas where disciplines converge.
Engineering students occupy the space between Mathematics and Science. Architectural studies bridge Mathematics and Art. Scientific illustration emerges where Science and Art intersect. At the center, design in technology represents the convergence of all three domains.
This template employs a subtle color palette of purple, blue, and mint green. The gentle tones maintain visual distinction while allowing the text to remain legible. The circular arrangement ensures equal emphasis on each domain, avoiding hierarchical implications between fields.
The design is simplistic while elegant. Each circle maintains equal size and spacing, creating balanced overlaps. Text placement within sections follows a clear hierarchy, with main categories prominently displayed and intersecting concepts noted in smaller text.
Modern applications extend beyond academic categorization. Business strategists use similar diagrams to map market segments. Project managers visualize resource allocation. Research teams identify interdisciplinary opportunities.
This versatile template makes it useful in a wide range of professional settings. Its simple diagram structure forms the basis for more advanced set theory visualizations while still a great tool to help you better analyze and understand different concepts.
Related templates
Get started with EdrawMax today
Create 210 types of diagrams online for free.
Free Download Free Download Draw a diagram free Draw a diagram free Draw a diagram free