Carroll diagram
Sort data or shapes into categories using this Carroll diagram template.
- Templates
- Venn diagram templates
- carroll diagram
About this template
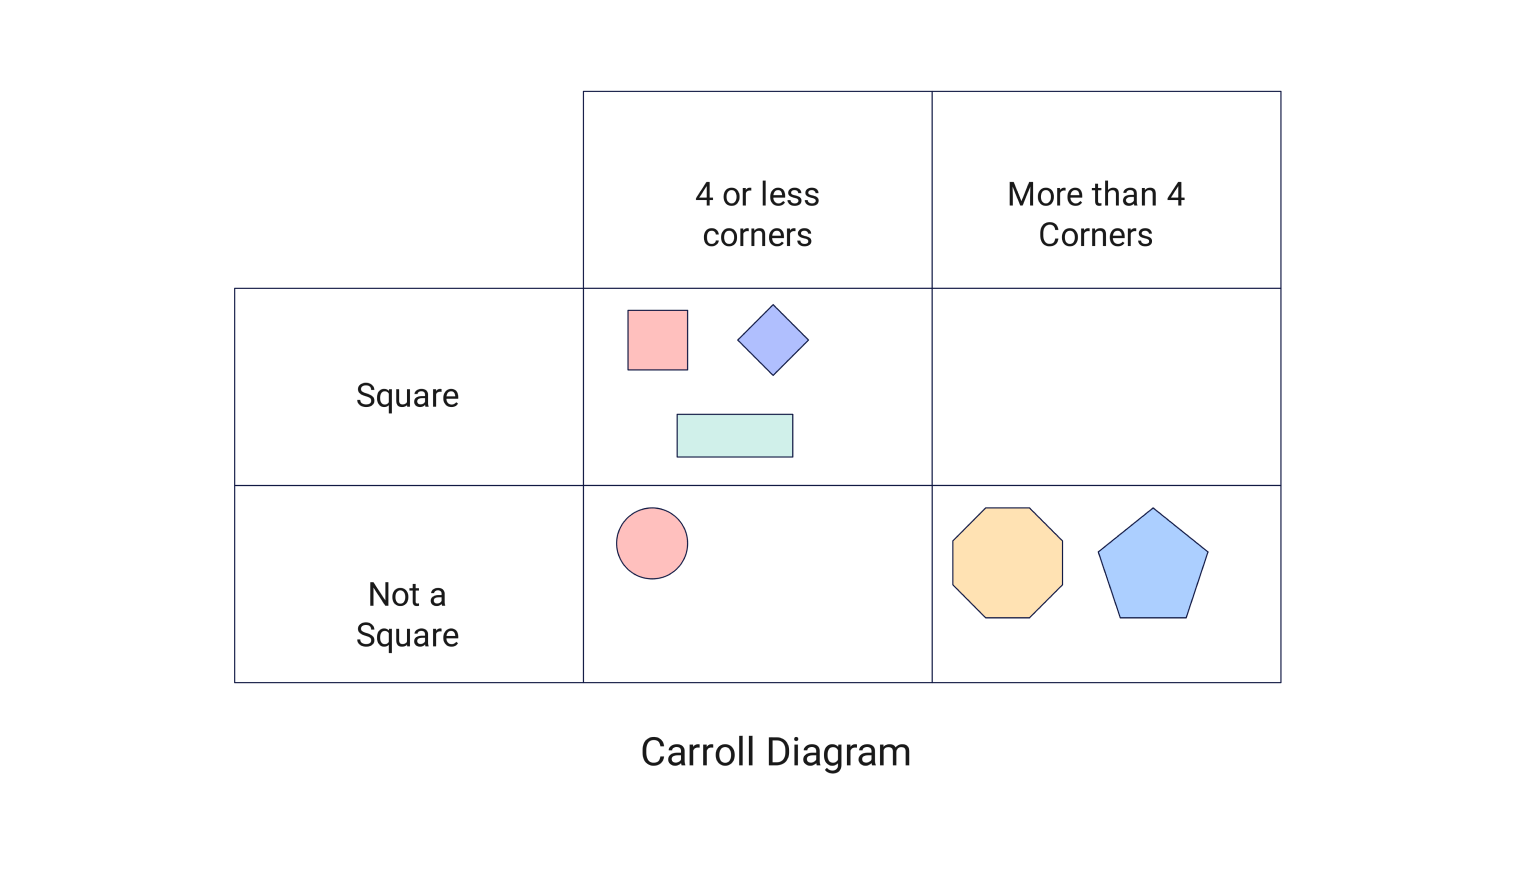
A Carroll Diagram is a simple chart to sort objects or data based on two criteria. Here, the first rows and columns represent the chosen criteria. Then, items are placed in the grid where the criteria intersect.
This tool is widely used in classrooms to teach sorting and logic skills. Teachers often use it for lessons involving numbers, shapes, or objects. It helps students focus on logical classification instead of guesswork. Outside of school, it is also useful for organizing simple data sets in daily tasks.
A Carroll diagram differs from a Venn diagram in how it displays relationships. A Venn diagram uses overlapping circles to highlight similarities or intersections. In contrast, a Carroll diagram uses a grid, which is better when you need to apply strict, non-overlapping categories.
To use this template, identify the two criteria you want to classify first. The diagram is divided into four sections. At the top, you have “4 or less corners” and “More than 4 corners.” On the side, you have “Square” and “Not a square.”
In the above example, shapes are sorted based on their properties. Squares with four or fewer corners go in one box, while those that aren’t squares but have more than four corners go in another.
Carroll diagrams tie into math concepts like set theory and logic. These areas involve organizing and grouping objects based on defined rules, which is what the diagram does. You can practice with this template to strengthen foundational skills for more complex math topics like data analysis and problem-solving.
Related templates
Get started with EdrawMax today
Create 210 types of diagrams online for free.
Free Download Free Download Draw a diagram free Draw a diagram free Draw a diagram free