About this Enterprise Technology Architecture Overview
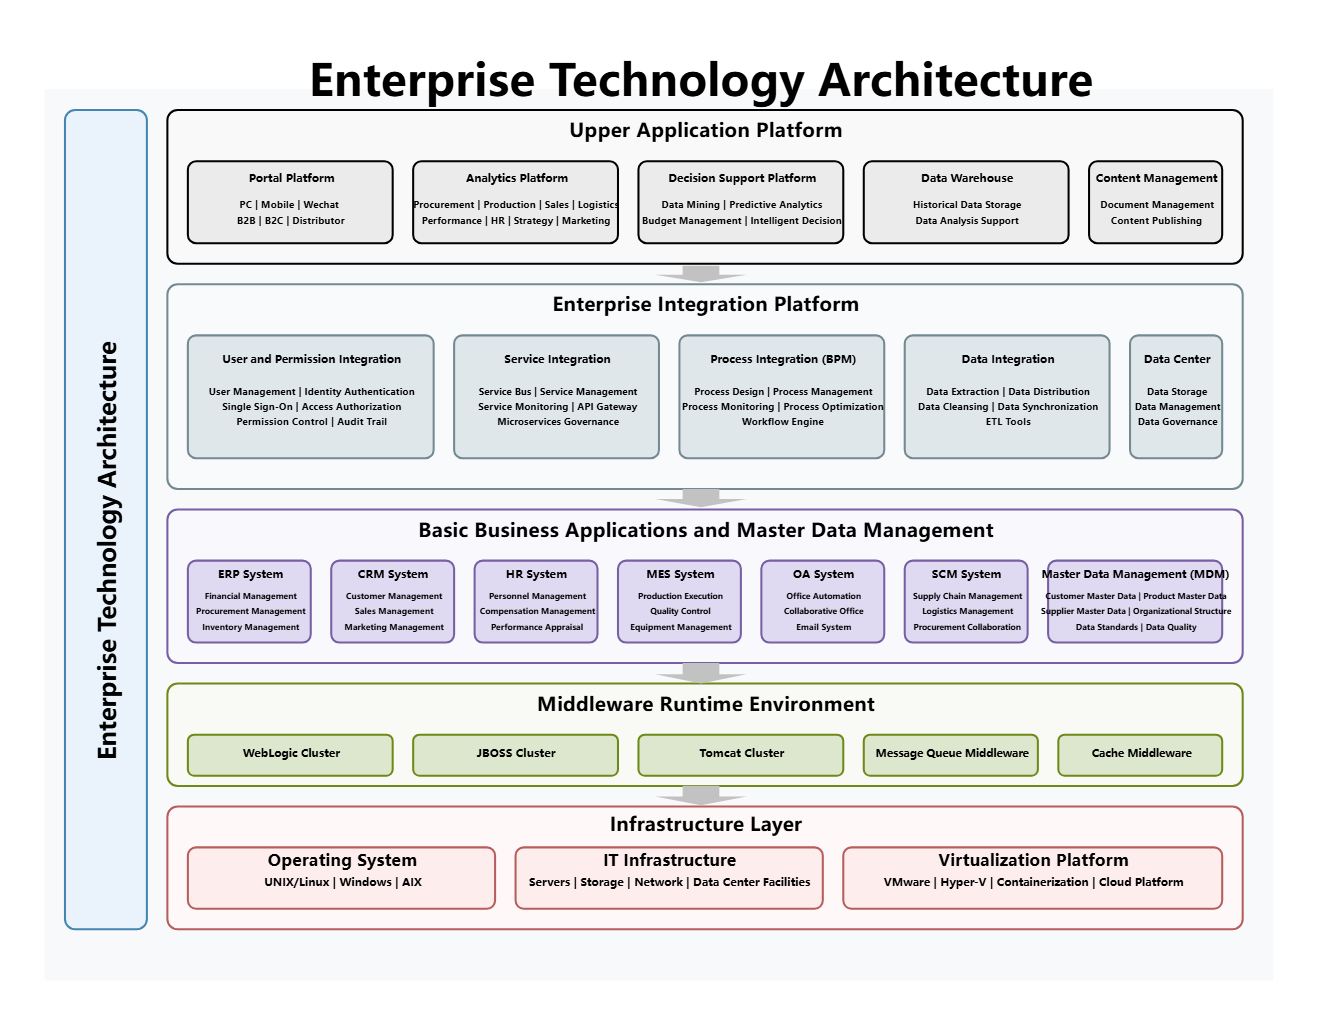
This diagram shows enterprise technology architecture overview in a clearer structure, so the main layers or modules are easier to explain.
Workflow Engine
The Workflow Engine section marks one visible part of the architecture. In this diagram, it includes Process Monitoring | Process Optimization, Process Design | Process Management, Process Integration (BPM), Data Cleansing | Data Synchronization, so the section reads as a specific functional block rather than a generic label.
- Process Monitoring | Process Optimization
- Process Design | Process Management
- Process Integration (BPM)
- Data Cleansing | Data Synchronization
- Data Extraction | Data Distribution
- ETL Tools
- Data Integration
- Enterprise Integration Platform
ERP System
The ERP System section marks one visible part of the architecture. In this diagram, it includes Financial Management, Procurement Management, Inventory Management, Permission Control | Audit Trail, so the section reads as a specific functional block rather than a generic label.
- Financial Management
- Procurement Management
- Inventory Management
- Permission Control | Audit Trail
- Single Sign-On | Access Authorization
- User Management | Identity Authentication
- WebLogic Cluster
- User and Permission Integration
CRM System
The CRM System section marks one visible part of the architecture. In this diagram, it includes Customer Management, Sales Management, Marketing Management, Basic Business Applications and Master Data Management, so the section reads as a specific functional block rather than a generic label.
- Customer Management
- Sales Management
- Marketing Management
- Basic Business Applications and Master Data Management
- Performance | HR | Strategy | Marketing
- Procurement | Production | Sales | Logistics
- Enterprise Technology Architecture
HR System
The HR System section marks one visible part of the architecture. In this diagram, it includes Personnel Management, Compensation Management, Performance Appraisal, Middleware Runtime Environment, so the section reads as a specific functional block rather than a generic label.
- Personnel Management
- Compensation Management
- Performance Appraisal
- Middleware Runtime Environment
- Microservices Governance
- Service Monitoring | API Gateway
- JBOSS Cluster
- Service Bus | Service Management
MES System
The MES System section marks one visible part of the architecture. In this diagram, it includes Production Execution, Quality Control, Equipment Management, OA System, so the section reads as a specific functional block rather than a generic label.
- Production Execution
- Quality Control
- Equipment Management
- OA System
- Office Automation
- Collaborative Office
- Email System
- Tomcat Cluster
FAQs about this Template
-
Which diagram type is best for documenting microservices?
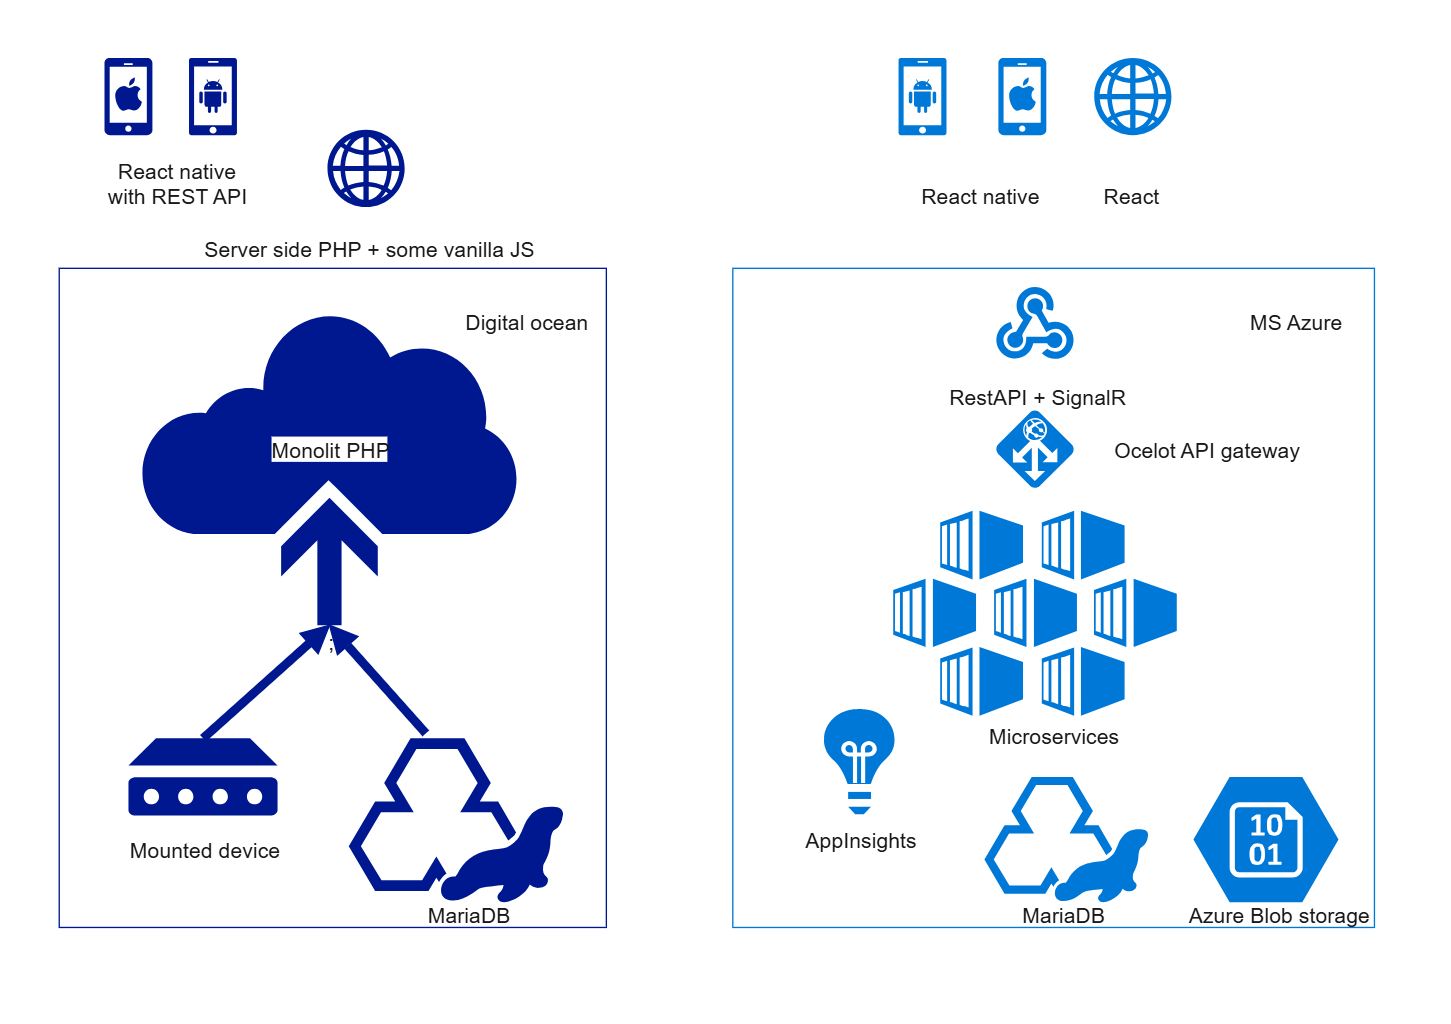
A high-level microservices architecture diagram is usually the best starting point because it shows service boundaries, gateways, data stores, and supporting infrastructure in one view. It helps teams explain how independent services relate to each other before they add lower-level sequence, event flow, deployment, observability, or support diagrams for implementation detail.
-
How do teams visualize microservices architecture clearly?
Teams usually visualize microservices architecture by separating client entry points, service layers, data stores, and messaging or infrastructure support. This makes it easier to review ownership, service boundaries, and dependencies across sections such as Workflow Engine, ERP System, and CRM System, especially when many small services need to cooperate without becoming one tightly coupled system.
-
What is the difference between microservices architecture and monolithic architecture?
Microservices architecture breaks a system into smaller independent services, while monolithic architecture keeps most application logic inside one larger codebase or deployment unit. Microservices diagrams are more useful when teams need to explain service boundaries, API relationships, data separation, scaling decisions, operational ownership, and failure isolation across a distributed application environment.
-
What should a microservices architecture diagram include?
A strong microservices architecture diagram should include service boundaries, API gateways or entry points, data stores, and the main request or event flow. It should also show where authentication, messaging, monitoring, deployment infrastructure, or support tooling fit, so readers can understand how the distributed system is coordinated and where operational responsibilities sit.
-
Can AI generate microservices architecture diagrams automatically?
Yes, AI can generate a draft microservices architecture diagram, but the result still needs engineering review. AI is useful for proposing service groupings and flow structure, while architects should confirm real domains, APIs, data ownership, failure boundaries, infrastructure dependencies, and support assumptions before the diagram is used in delivery planning or design review.