Euler diagram
Display the relationships between different sets or concepts in this template.
- Templates
- Venn diagram templates
- Euler diagram
About this template
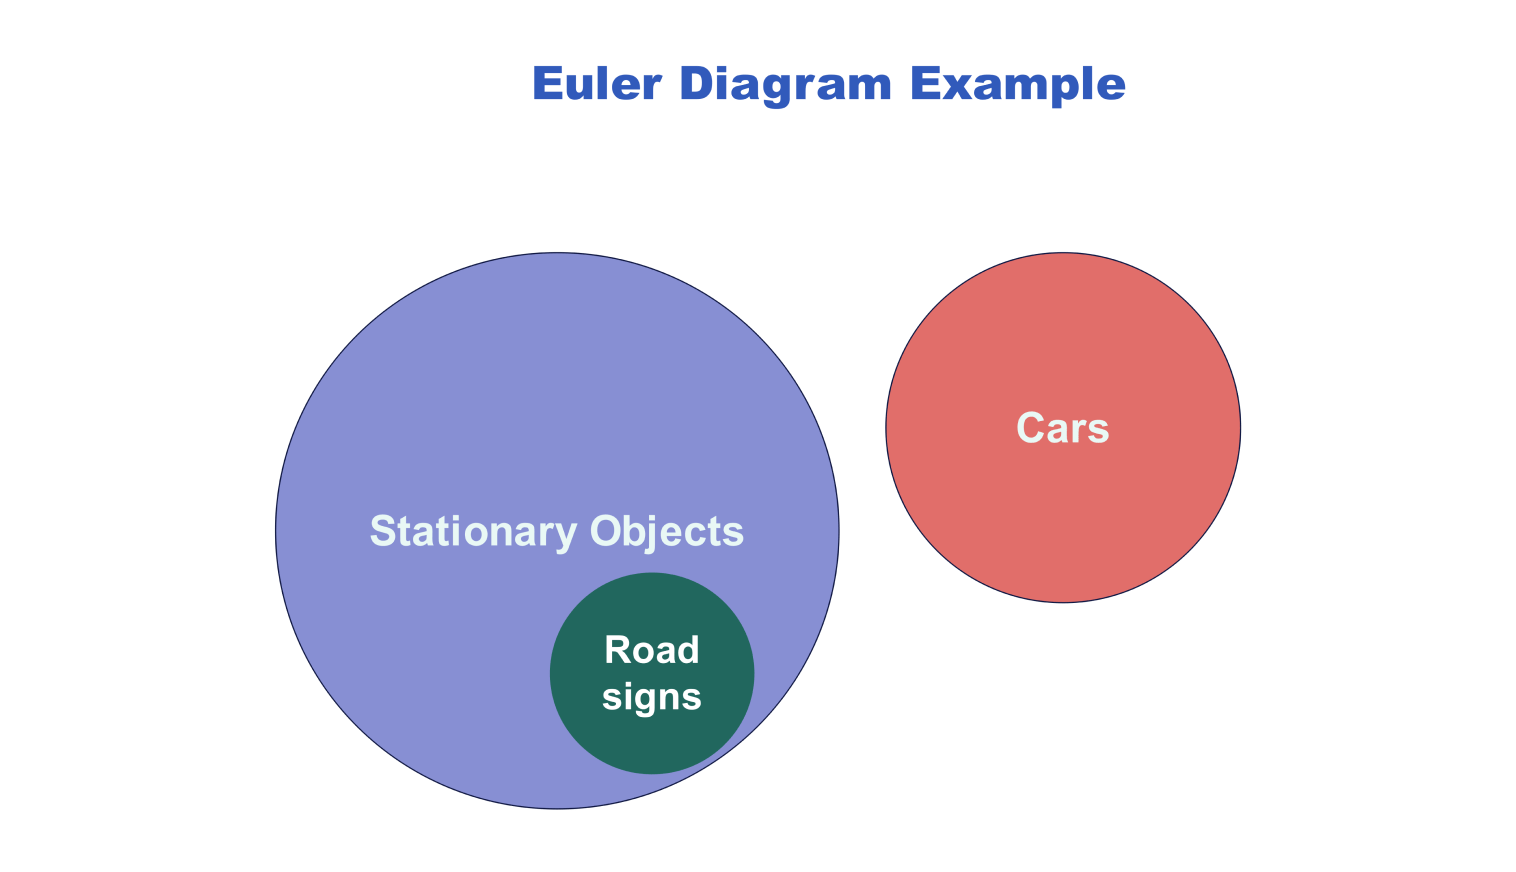
An Euler Diagram is a visual tool that shows relationships between different sets or categories. It uses circles or shapes to represent these sets. However, unlike a Venn diagram, an Euler Diagram only includes overlaps if a relationship exists. For example, if two categories have nothing in common, their circles won’t overlap.
These diagrams are helpful in many areas. You can use them for data analysis, logic problems, or even organizing ideas for a project. They are often used in classrooms, business meetings, or research presentations. For example, this diagram works well if you want to compare different products or explain how concepts overlap.
It’s also easy to use this template. Start by identifying the categories or sets you want to compare. In the example image, the large circle represents stationary objects, and the smaller circles highlight road signs and cars.
Once you know your categories, place each category in its own circle. Overlapping sections show where two or more groups are related. Non-overlapping areas show unique categories. You can also adjust the size of the shapes to match the importance or size of each category.
This Euler diagram template makes it simple to share your ideas. You can use it for presentations, data organization, or teaching. It’s customizable and clear, so you don’t have to spend too much time explaining your diagram.
Related templates
Get started with EdrawMax today
Create 210 types of diagrams online for free.
Free Download Free Download Draw a diagram free Draw a diagram free Draw a diagram free