About this Network Diagram for IOT Agriculture System template
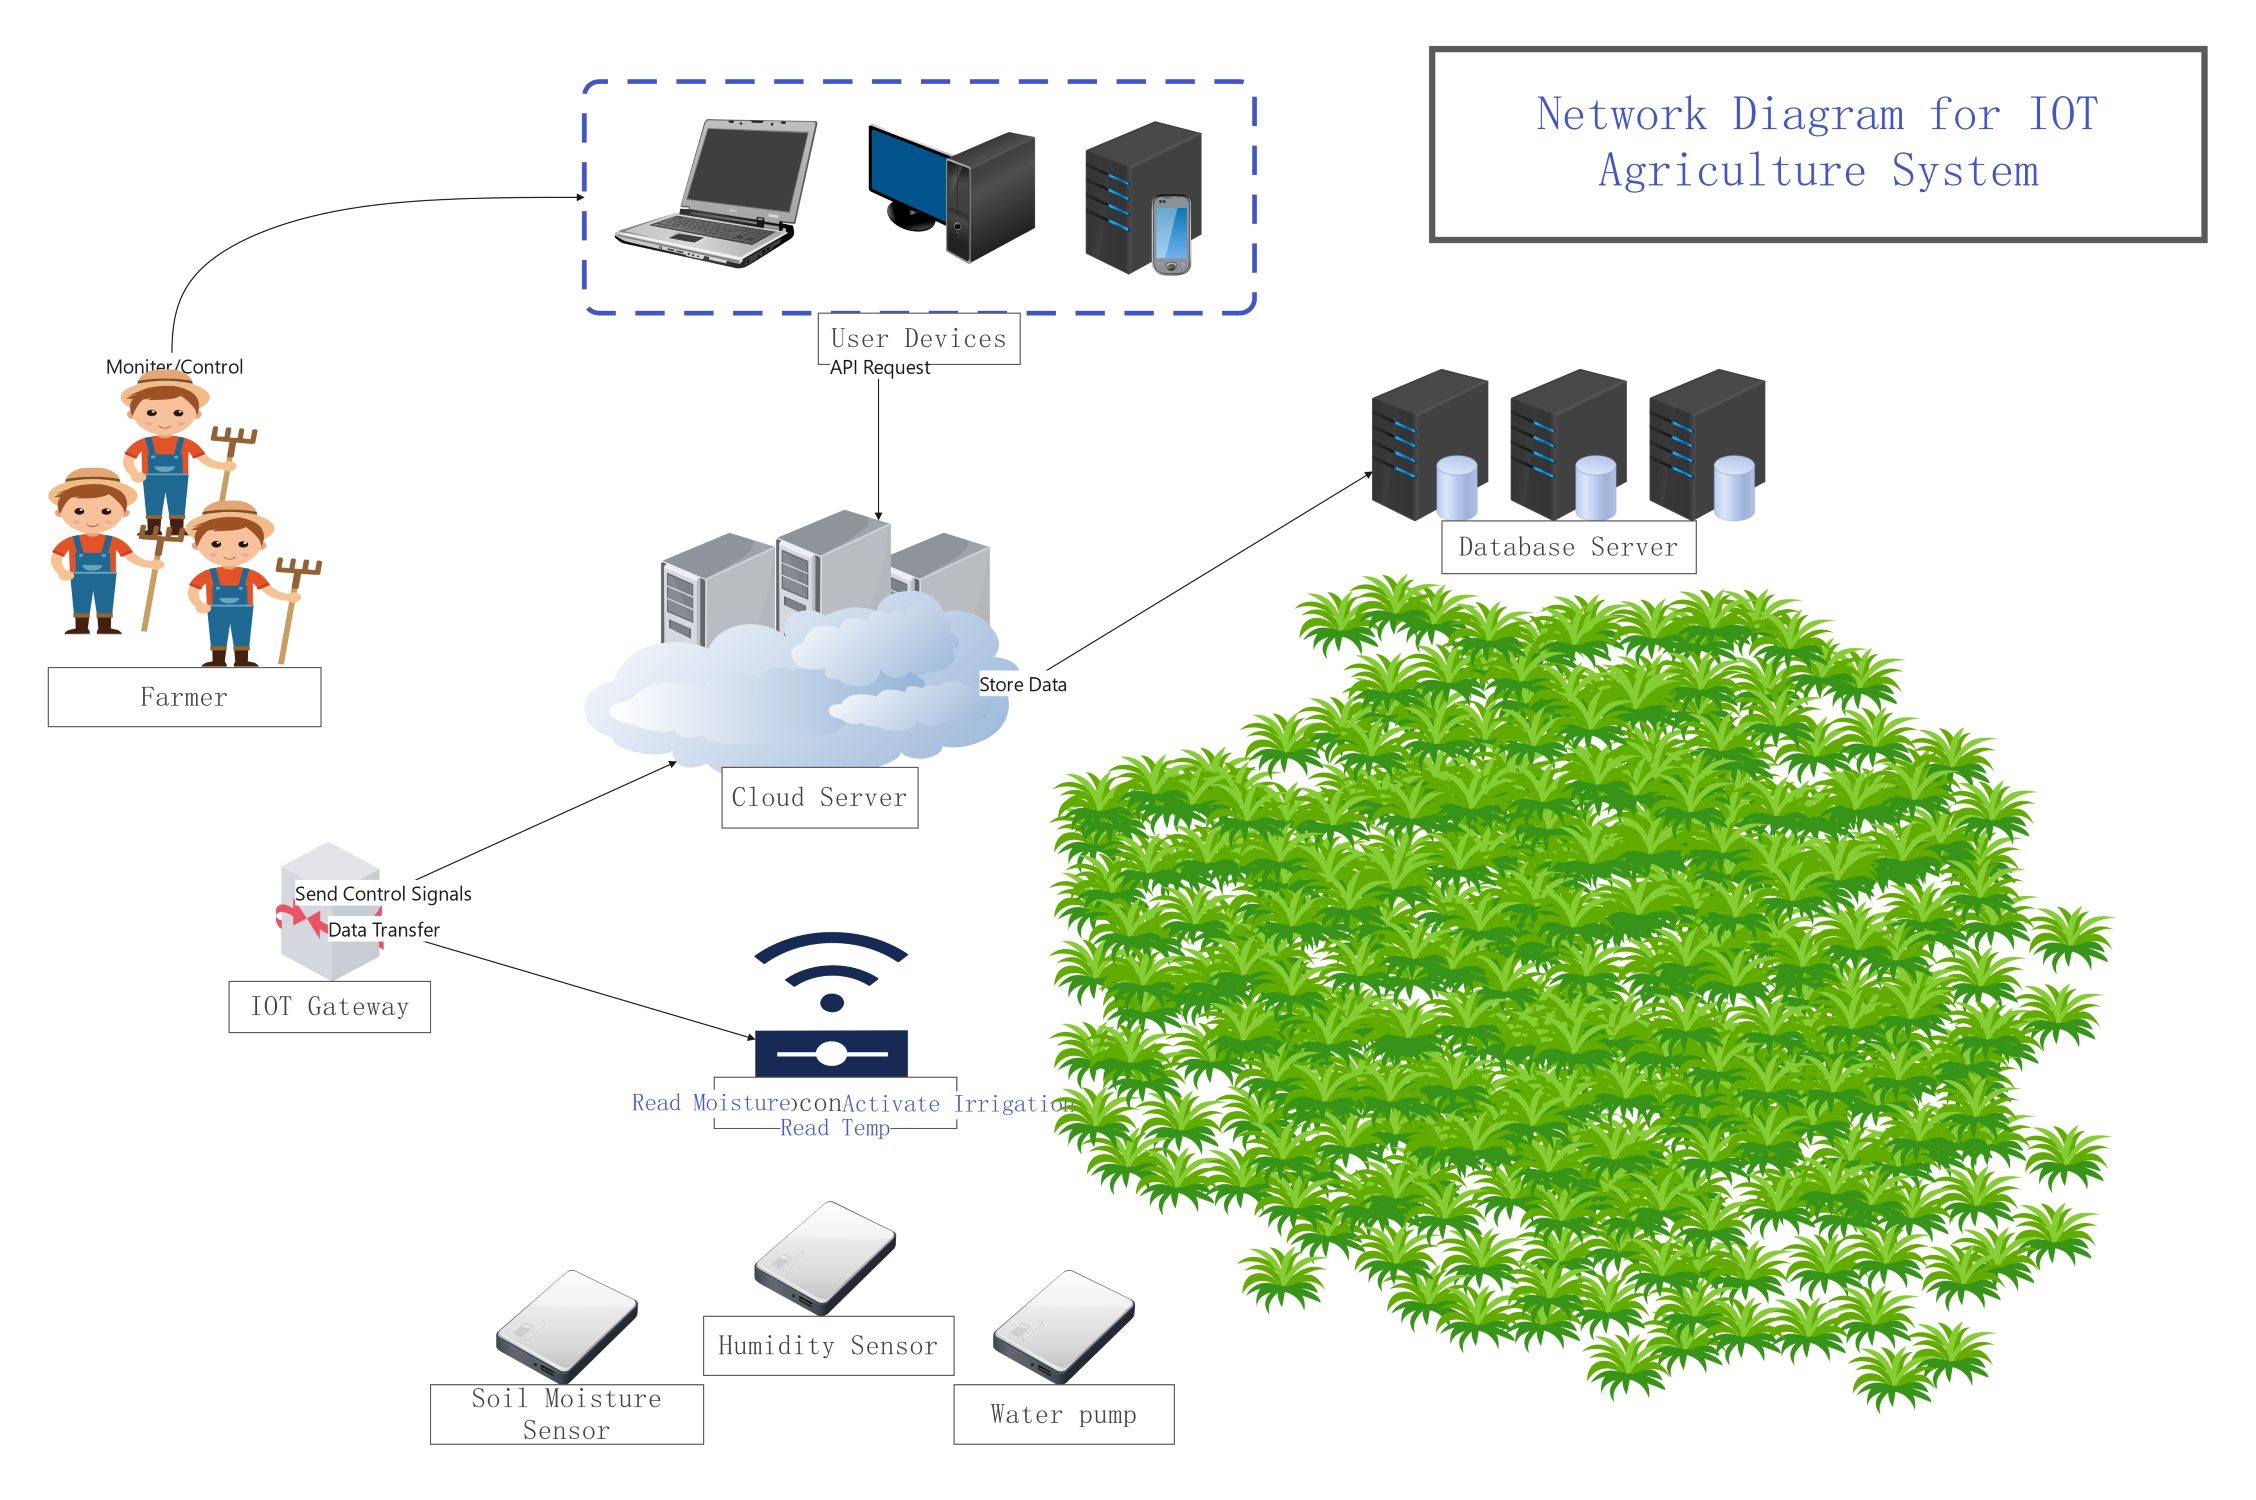
This template showcases the architecture of a modern smart farming system. It highlights the flow of data from field sensors to cloud servers and user devices for real-time monitoring and irrigation control.
User Devices
User devices serve as the interface for farmers to interact with the agricultural system. These tools allow users to send API requests to the cloud for monitoring field conditions or controlling hardware remotely.
- Laptop for detailed management
- Desktop PC for office monitoring
- Mobile phone for on-the-go control
- API Request functionality
Cloud and Database Infrastructure
The cloud server acts as the central hub for processing all incoming agricultural data. It stores historical information in database servers and facilitates the exchange of control signals between users and the field equipment.
- Cloud Server for data processing
- Database Server for long-term storage
- Storage of sensor logs
- Management of control signals
IOT Gateway and Sensors
The IOT Gateway bridges the gap between the physical field and the digital cloud. It collects data from various sensors and triggers physical actions like irrigation based on predefined moisture or temperature levels.
- IOT Gateway for data transfer
- Soil Moisture Sensor
- Humidity Sensor
- Water pump for automated irrigation
- Temperature reading capabilities
FAQs about this Template
-
How does an IoT agriculture system improve crop yield?
An IoT agriculture system improves crop yield by providing precise data on soil moisture and environmental conditions. Instead of relying on guesswork, farmers use real-time sensor data to apply water and nutrients only when needed. This prevents plant stress from overwatering or drought. Ultimately, optimized resource management leads to healthier plants and much higher production rates for commercial farms.
-
What is the role of an IoT Gateway in smart farming?
The IoT Gateway acts as a communication bridge between local field sensors and the remote cloud server. Since many sensors use low-power protocols like Zigbee or LoRa, the gateway translates this data into internet-friendly formats. It also receives control signals from the user and passes them to actuators, such as water pumps, to enable automated field operations.
-
Can this network diagram be used for indoor vertical farming?
Yes, this network diagram is perfectly suitable for indoor vertical farming or greenhouse environments. You can easily modify the sensor types to include CO2 monitors or specialized light sensors. The core logic of data flowing from sensors to a central cloud for monitoring remains the same. It provides a scalable framework for managing any controlled environment agriculture system effectively.