About this Research 2 Project Timeline template
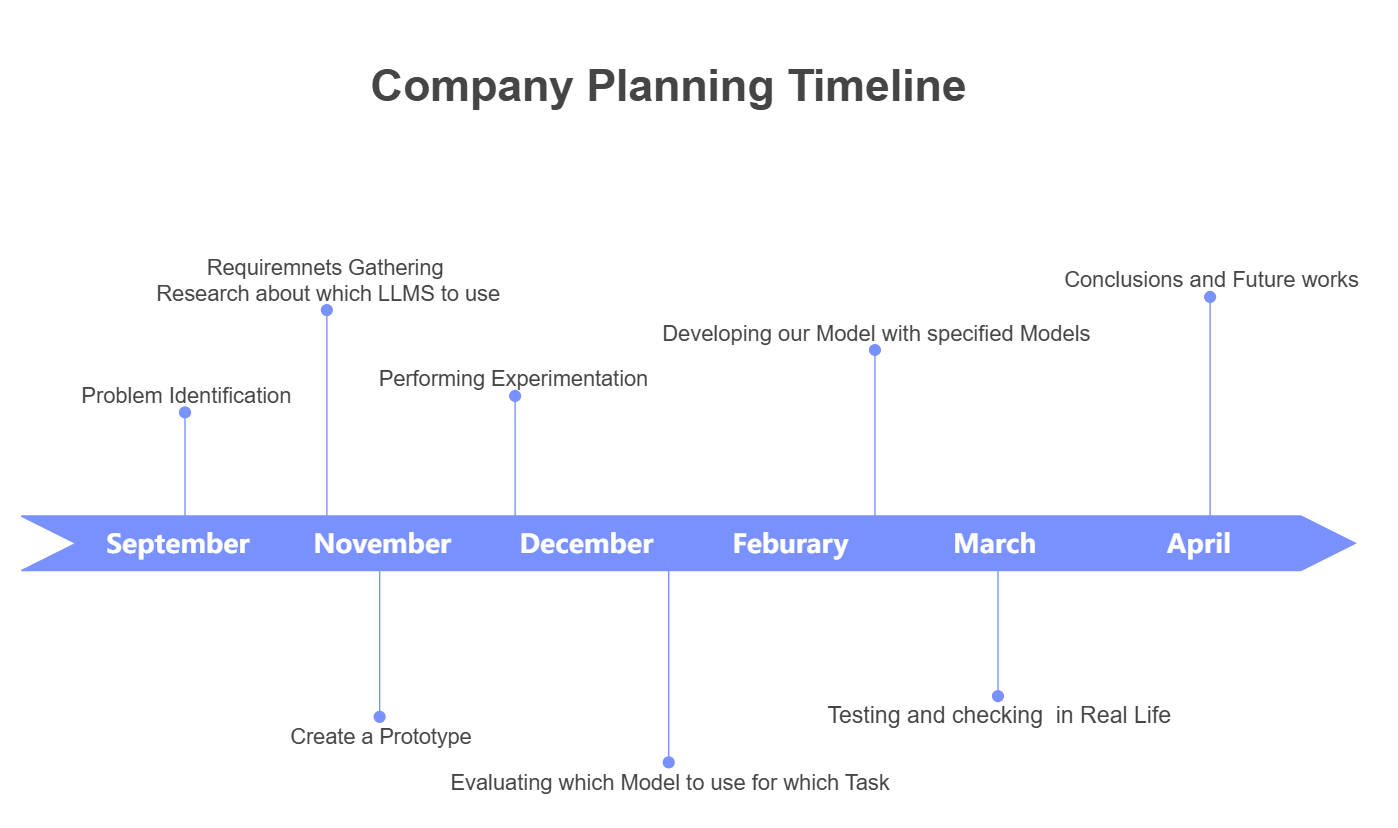
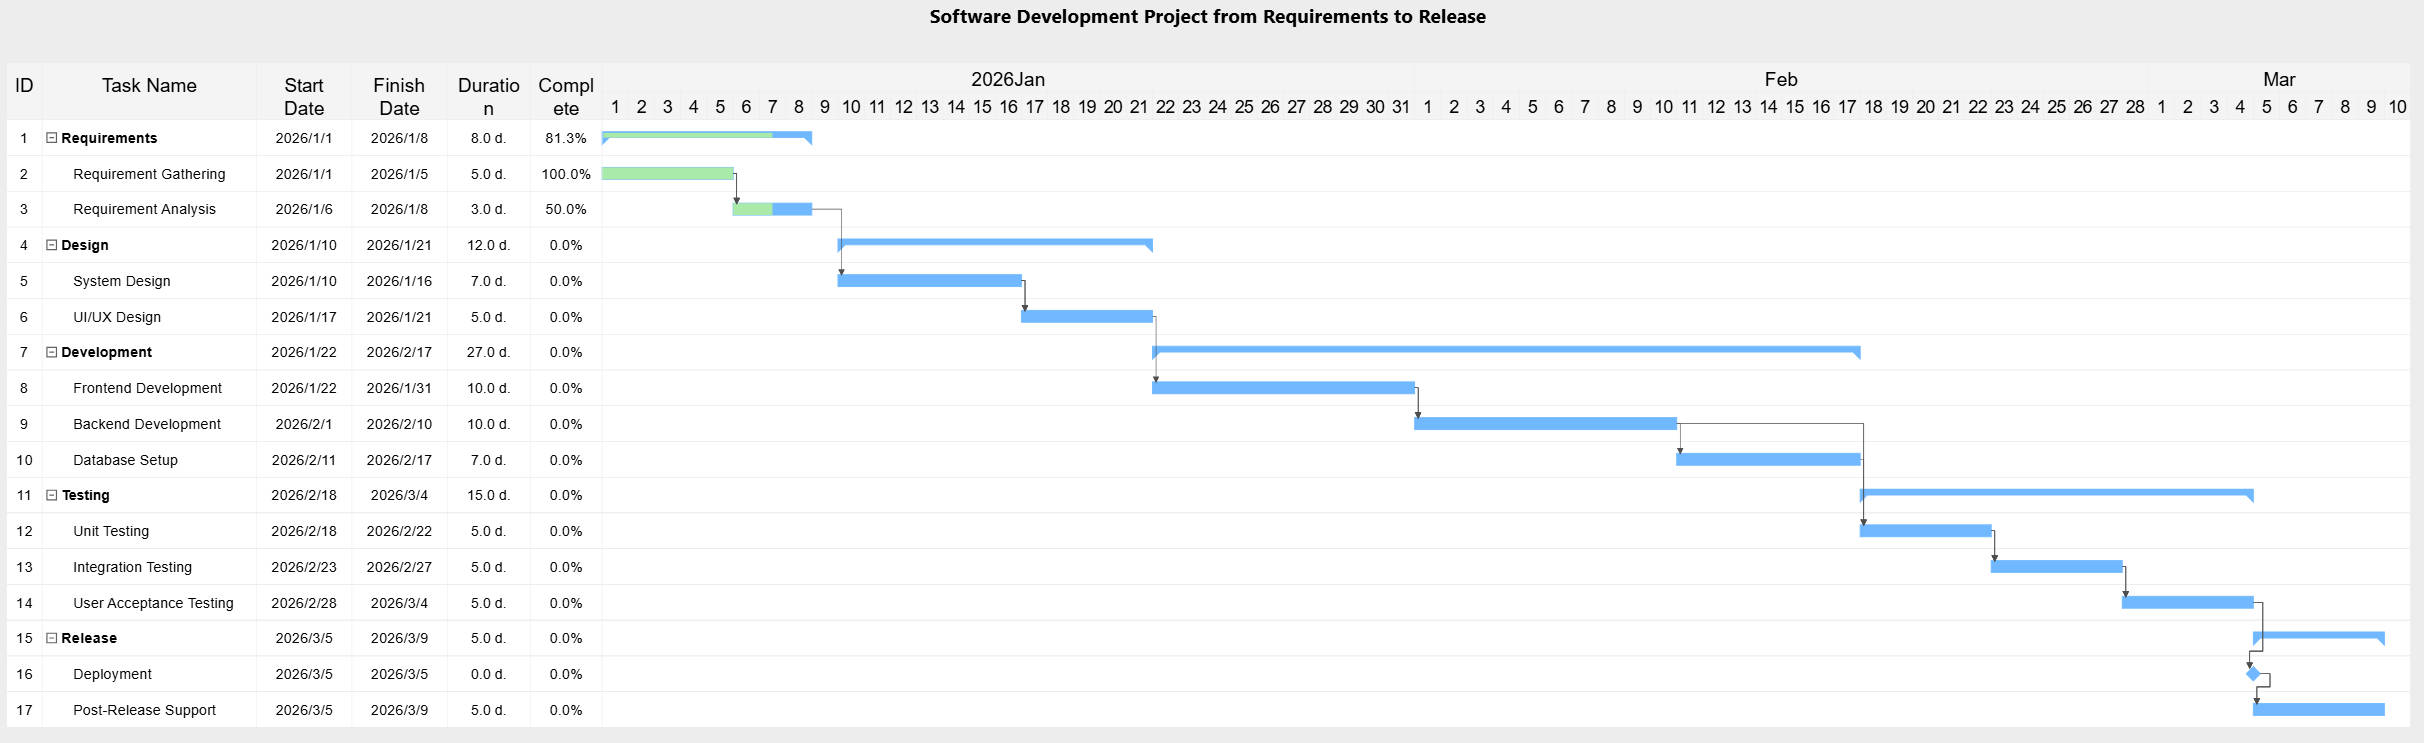
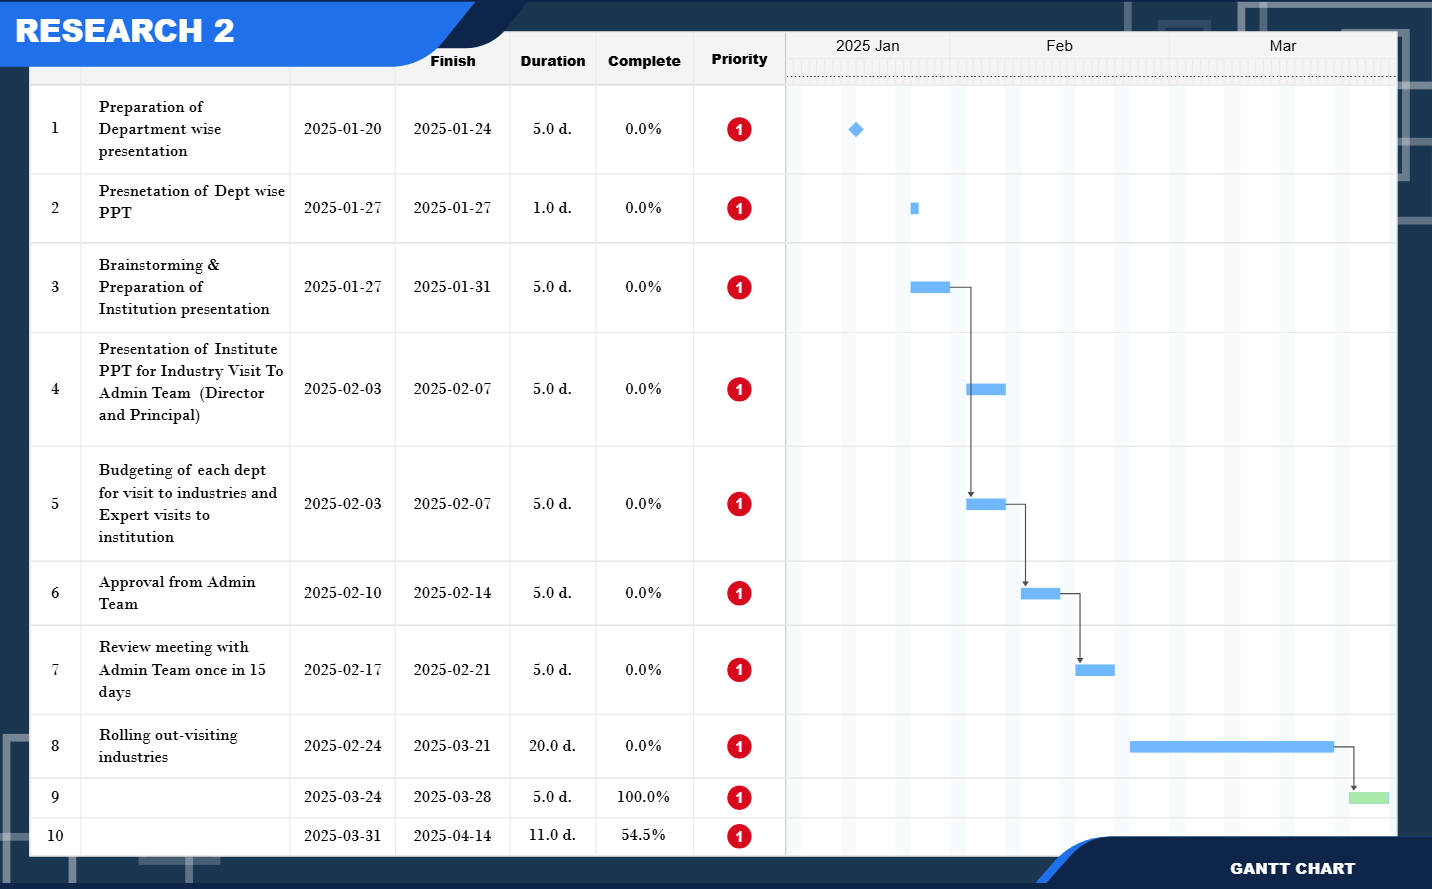
This Gantt chart template outlines the critical phases for a semester-long research project focusing on industry visits. It tracks preparation, administrative reviews, and field activities to ensure students and faculty stay on schedule for presentations.
Presentation Preparation Phase
This initial stage focuses on organizing departmental data and creating professional presentations. Faculty members and students collaborate to ensure all academic content is ready for review before moving to the institutional level.
- Preparation of Department wise presentation
- Presentation of Dept wise PPT
- Brainstorming and Preparation of Institution presentation
Administrative Review and Budgeting
This phase involves presenting the research plan to the Director and Principal for formal approval. It also includes financial planning for industry site visits and coordinating expert guest speakers for the institution.
- Presentation of Institute PPT for Industry Visit to Admin Team
- Budgeting of each dept for visit to industries and Expert visits
- Formal Approval from Admin Team
Project Execution and Industry Visits
The final active phase focuses on the actual rollout of industry visits and periodic progress reviews. Teams transition from planning to field research, ensuring that all findings align with the project goals.
- Review meeting with Admin Team once in 15 days
- Rolling out-visiting industries
- Final research completion and follow-up tasks
FAQs about this Template
-
Why use a Gantt chart for research project management?
A Gantt chart is a powerful tool for research projects because it provides a visual map of all deadlines. It helps researchers track their progress against a set schedule, ensuring that no tasks are forgotten. By showing task dependencies, it also helps identify potential bottlenecks early. This clarity improves communication among team members and keeps the entire project on track.
-
How does the priority column benefit the project team?
The priority column is vital because it helps team members focus on the most critical tasks first. In this timeline, all tasks are marked as high priority, signaling that every step is essential for success. This prevents delays in the later stages of the research. When resources are limited, knowing which tasks are non-negotiable allows for better time management and efficiency.
-
What is the importance of industry visits in this timeline?
Industry visits are key because they provide practical insights that classroom learning cannot offer. In this specific timeline, they represent the execution phase where students or researchers interact with the real world. This process bridges the gap between academic theory and professional practice. It also helps build valuable connections with experts, which can enhance the final research findings and outcomes significantly.