About this SleepAid System Architecture Diagram
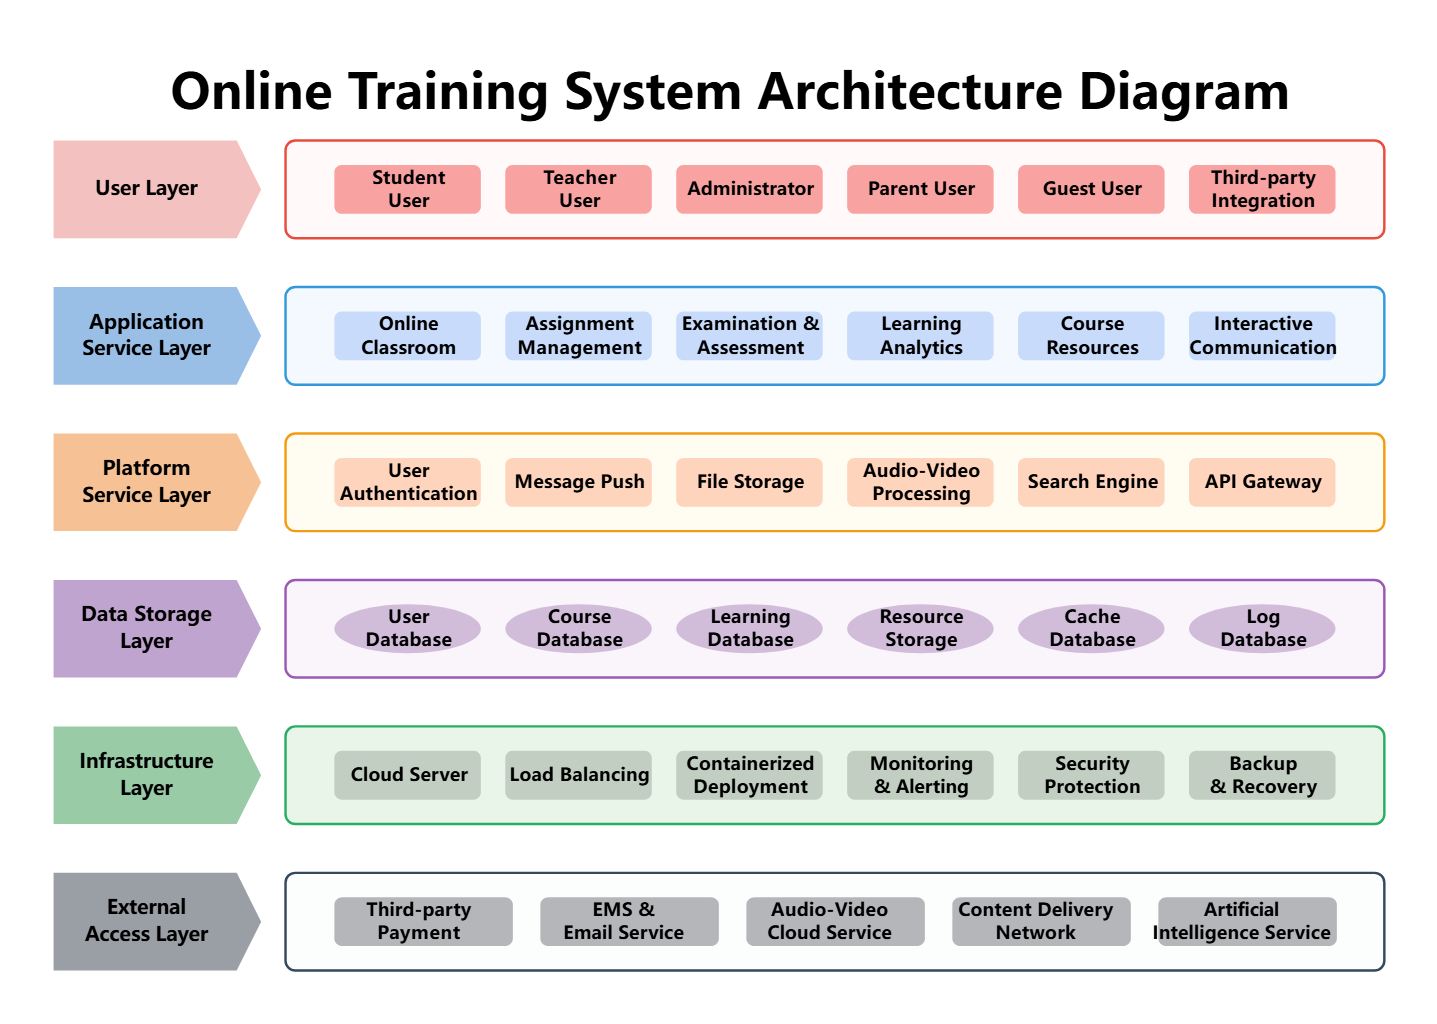
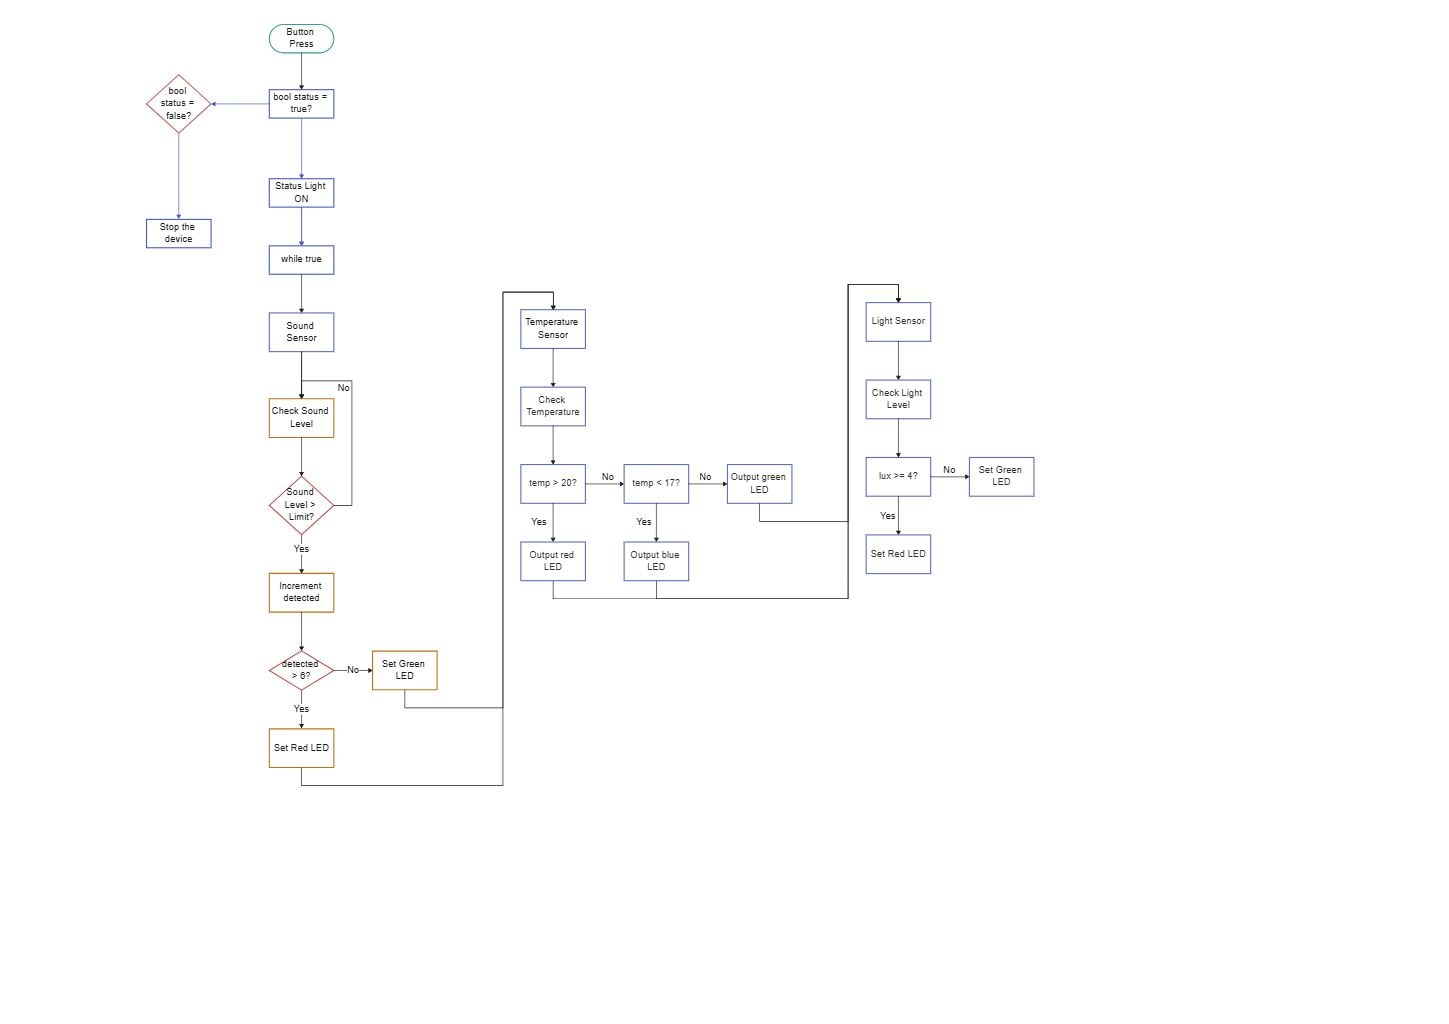
This diagram shows the main structure of a sleepaid system architecture diagram, with the visible layers or blocks separated so each part of the system can be explained more clearly.
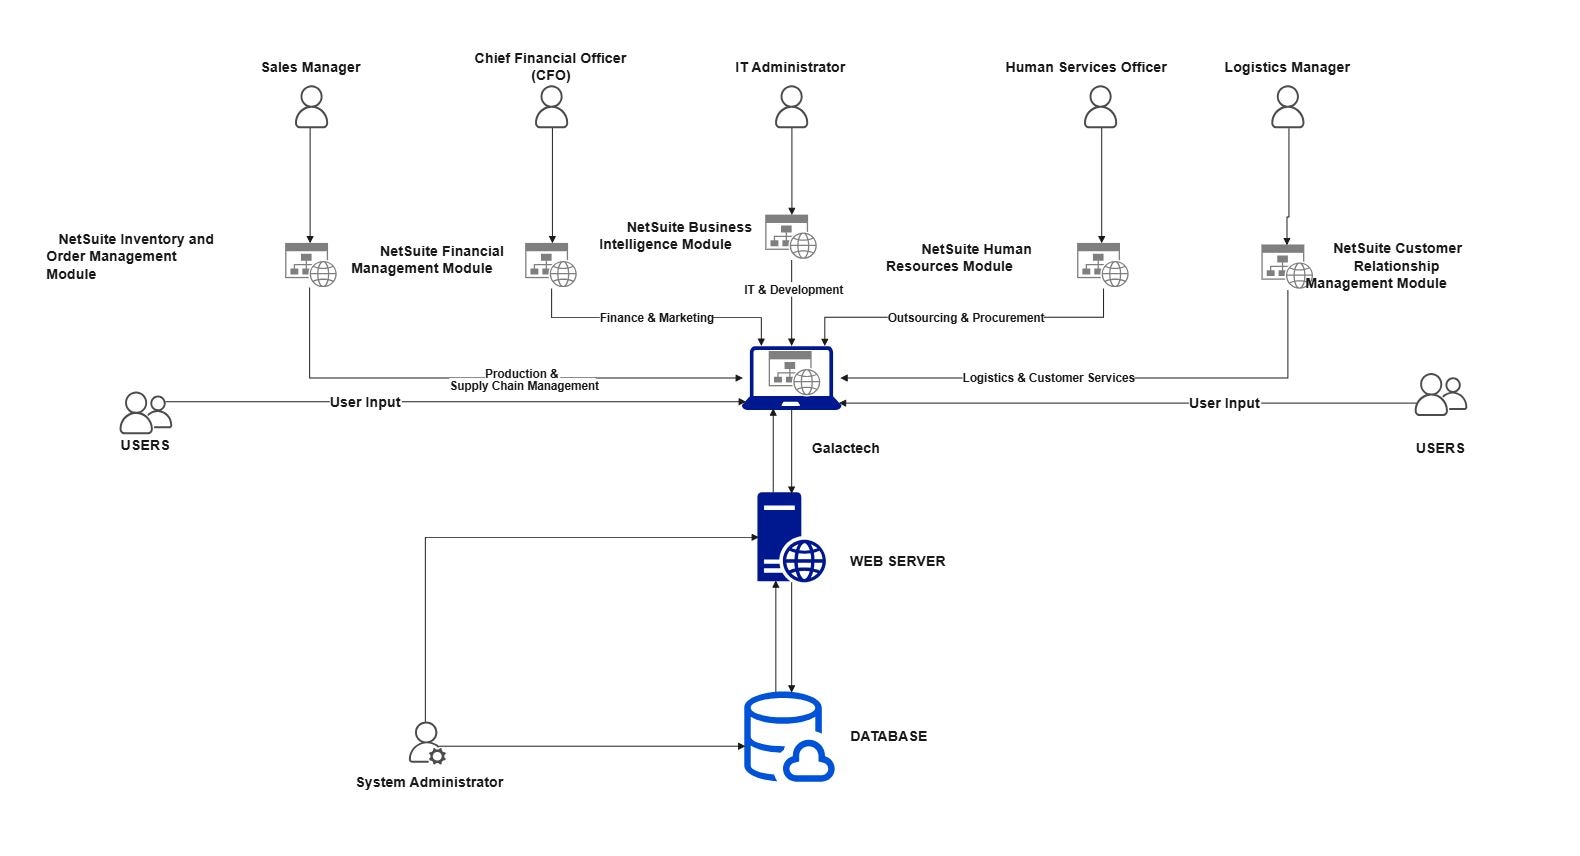
Device Start and Control Loop
The Device Start and Control Loop section groups the visible components in this part of the diagram. In this layout, it includes Button Press, bool status = false?, bool status = true?, Status Light ON, which helps define what this block is responsible for in the wider architecture.
- Button Press
- bool status = false?
- bool status = true?
- Status Light ON
- while true
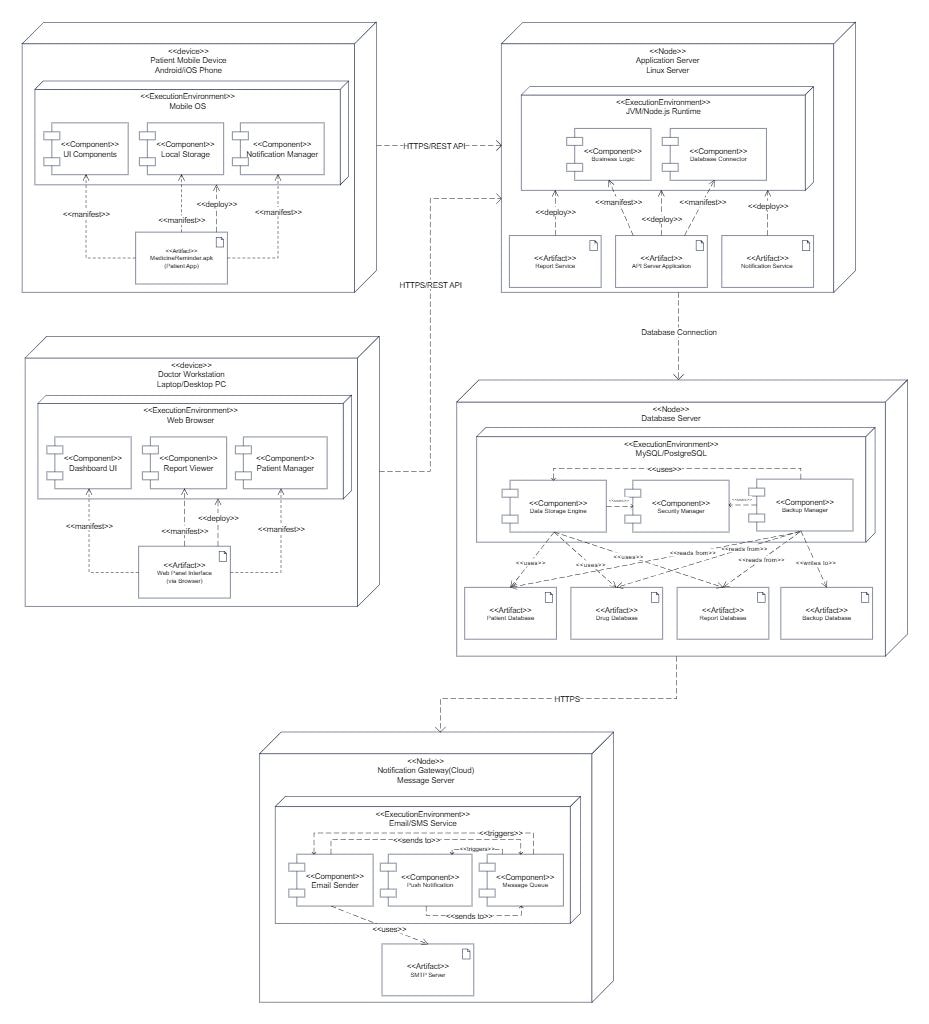
Sound Monitoring
The Sound Monitoring section groups the visible components in this part of the diagram. In this layout, it includes Sound Sensor, Check Sound Level, Sound Level > Limit?, Increment detected, which helps define what this block is responsible for in the wider architecture.
- Sound Sensor
- Check Sound Level
- Sound Level > Limit?
- Increment detected
- detected > 6?
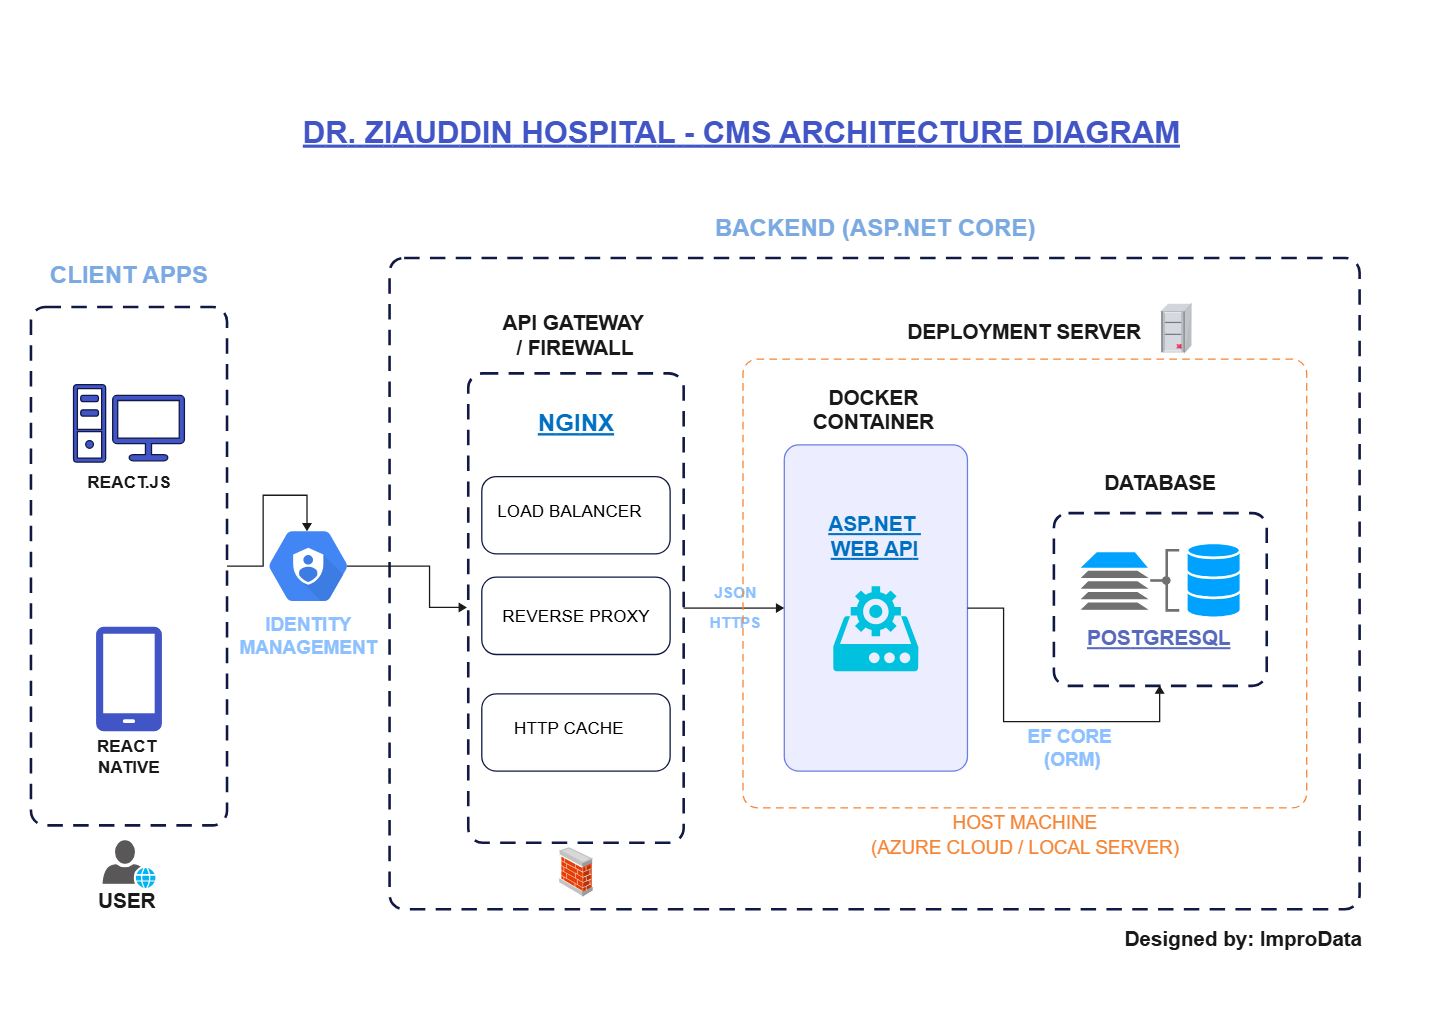
Temperature and Light Monitoring
The Temperature and Light Monitoring section groups the visible components in this part of the diagram. In this layout, it includes Temperature Sensor, Check Temperature, temp > 20?, temp < 17?, which helps define what this block is responsible for in the wider architecture.
- Temperature Sensor
- Check Temperature
- temp > 20?
- temp < 17?
- Light Sensor
- Check Light Level
- lux >= 4?
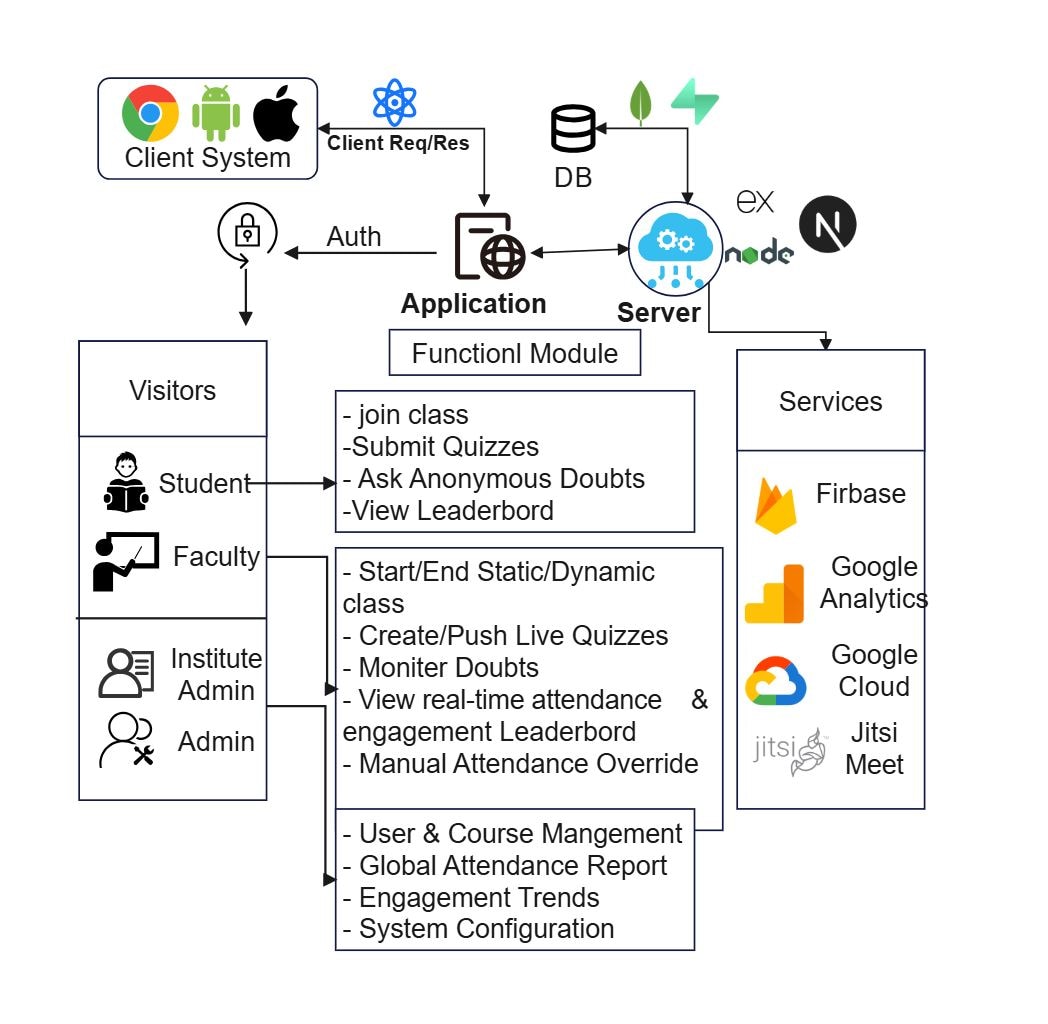
LED Output Logic
The LED Output Logic section groups the visible components in this part of the diagram. In this layout, it includes Set Green LED, Set Red LED, Output green LED, Output red LED, which helps define what this block is responsible for in the wider architecture.
- Set Green LED
- Set Red LED
- Output green LED
- Output red LED
- Output blue LED
FAQs about this Template
-
How do teams visualize SleepAid System IoT architecture?
Teams usually visualize SleepAid System IoT architecture with a diagram that separates devices, connectivity, processing, and application or control layers. This makes it easier to review how sensor data moves, where decisions are made, and how cloud, edge, monitoring, or automation services connect in the wider system. This also makes technical review, stakeholder communication, and future changes easier to manage.
-
What should a SleepAid System IoT architecture diagram include?
A strong SleepAid System IoT architecture diagram should include the devices, communication path, core processing components, and the main user or control interfaces. It should also show where gateways, cloud services, storage, analytics, monitoring, or security controls connect, so the end-to-end behavior of the IoT system is easier to understand.
-
What is the difference between IoT architecture and system architecture?
IoT architecture focuses more directly on connected devices, telemetry flow, gateways, processing, and control logic, while system architecture is a broader term for overall software or infrastructure structure. IoT diagrams are more useful when teams need to explain sensor behavior, data transfer, remote control, alert flow, and the relationship between physical devices and digital services.
-
Can AI generate SleepAid System IoT architecture diagrams automatically?
Yes, AI can generate an early IoT architecture draft, but engineers still need to validate it carefully. AI can suggest common layers and device-to-cloud flow, while the team should confirm the real hardware roles, communication methods, control points, security design, and support assumptions before using the diagram in planning or stakeholder review.
-
Which diagram type is best for documenting IoT workflows?
An architecture diagram is usually the best starting point for documenting IoT workflows because it shows devices, communication, processing, and user-facing logic together. Teams often add network, sequence, or data flow diagrams later when they need deeper detail for telemetry handling, alert logic, troubleshooting, operational deployment, or control behavior.