About ECG Vector Diagram Template
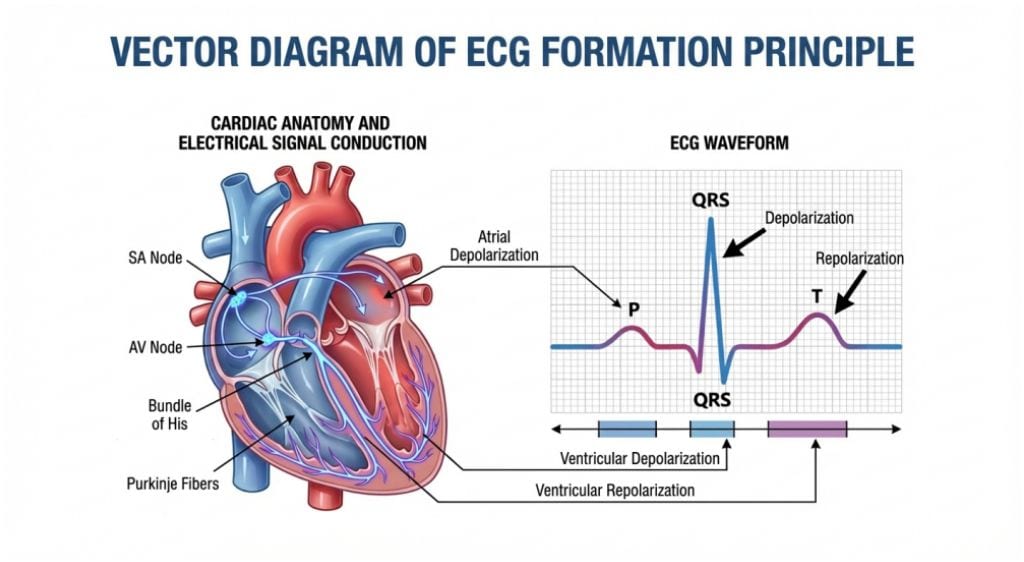
This ECG vector diagram template shows how cardiac electrical direction and vector progression may be organized in one scientific view. It helps users explain the mechanism more clearly than a plain written summary by turning electrical behavior into a structured visual reference.
Vector-related structures
The diagram appears to highlight the main electrical or structure-related elements that define the ECG vector topic. This matters because understanding usually begins with identifying the key parts before reviewing how the vector behavior progresses across the diagram.
- Helps explain the main structures involved in the vector topic
- Supports scientific study and teaching review
- Useful for clearer educational explanation
Direction and progression logic
The visual arrangement also helps users review how electrical direction or vector progression is organized instead of treating the topic as isolated labels. In a diagram like this, those relationships matter because the mechanism is usually defined by movement and orientation logic.
- Shows how vector progression may be interpreted across the structure
- Supports discussion of direction and sequence logic
- Useful for explaining the mechanism more clearly
Study and teaching value
Beyond the structures themselves, the diagram helps users communicate the topic in a form that is easier to teach, revise, or present. This is useful because ECG-related concepts are often much clearer when the direction and organization are shown visually.
- Useful for study, teaching, and scientific presentation
- Supports clearer communication of ECG vector concepts
- Helps make the topic easier to compare and remember
FAQs about this Template
-
What is an ECG vector?
An ECG vector is a way of representing the direction and magnitude of the heart’s electrical activity at a given moment. It helps explain how electrical impulses move through the heart and why particular ECG waveforms appear during the cardiac cycle.
-
How is an ECG vector formed?
An ECG vector is formed by the summed electrical forces created as different parts of the heart depolarize and repolarize. As activation moves through the heart, the overall direction and strength of the signal change, which is why the vector can be analyzed visually.
-
What does an ECG vector diagram show?
An ECG vector diagram shows how cardiac electrical activity is oriented and how that orientation changes during the heartbeat cycle. It helps learners connect abstract ECG readings with the actual direction of electrical movement through the heart.
-
Why is ECG vector analysis important?
ECG vector analysis is important because it supports clearer interpretation of conduction patterns, axis changes, and waveform meaning. It helps students and clinicians understand how recorded ECG signals reflect the heart’s underlying electrical behavior more accurately.