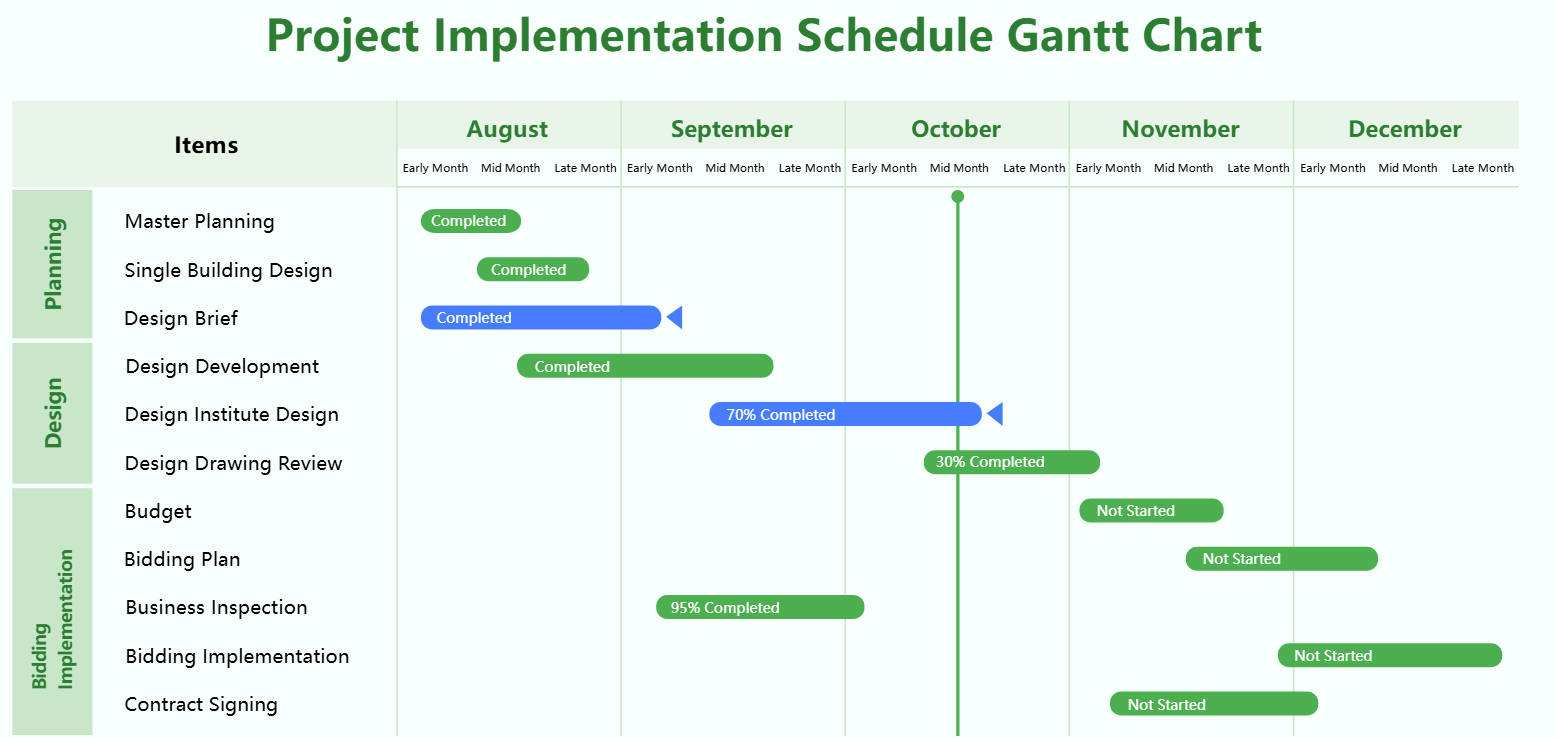
About this project implementation Gantt chart template
This template provides a clear roadmap for construction or development projects. It breaks down tasks into logical phases like planning and design. You can easily track completion percentages across a five-month timeline from August to December.
Planning Phase
The planning phase focuses on the initial layout and conceptualization of the project. It ensures that the foundation of the work is solid before moving into detailed design and implementation steps.
- Master Planning
- Single Building Design
- Design Brief
Design Phase
During the design phase, technical drawings and institute reviews take place. This stage is critical for refining the project specifications and ensuring all architectural requirements meet the necessary safety and quality standards.
- Design Development
- Design Institute Design
- Design Drawing Review
Bidding Implementation
The final phase involves financial planning and the execution of legal agreements. It tracks the progress of inspections, bidding processes, and contract signings. This ensures the project transitions smoothly from the drafting board to actual construction.
- Budget Estimation
- Bidding Plan
- Business Inspection
- Bidding Implementation
- Contract Signing