About this project progress Gantt chart template
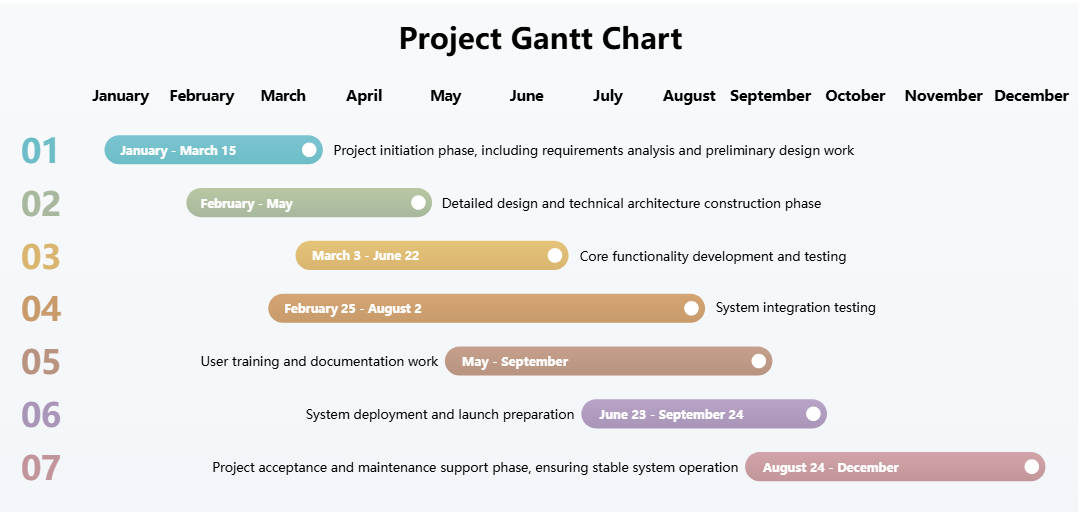
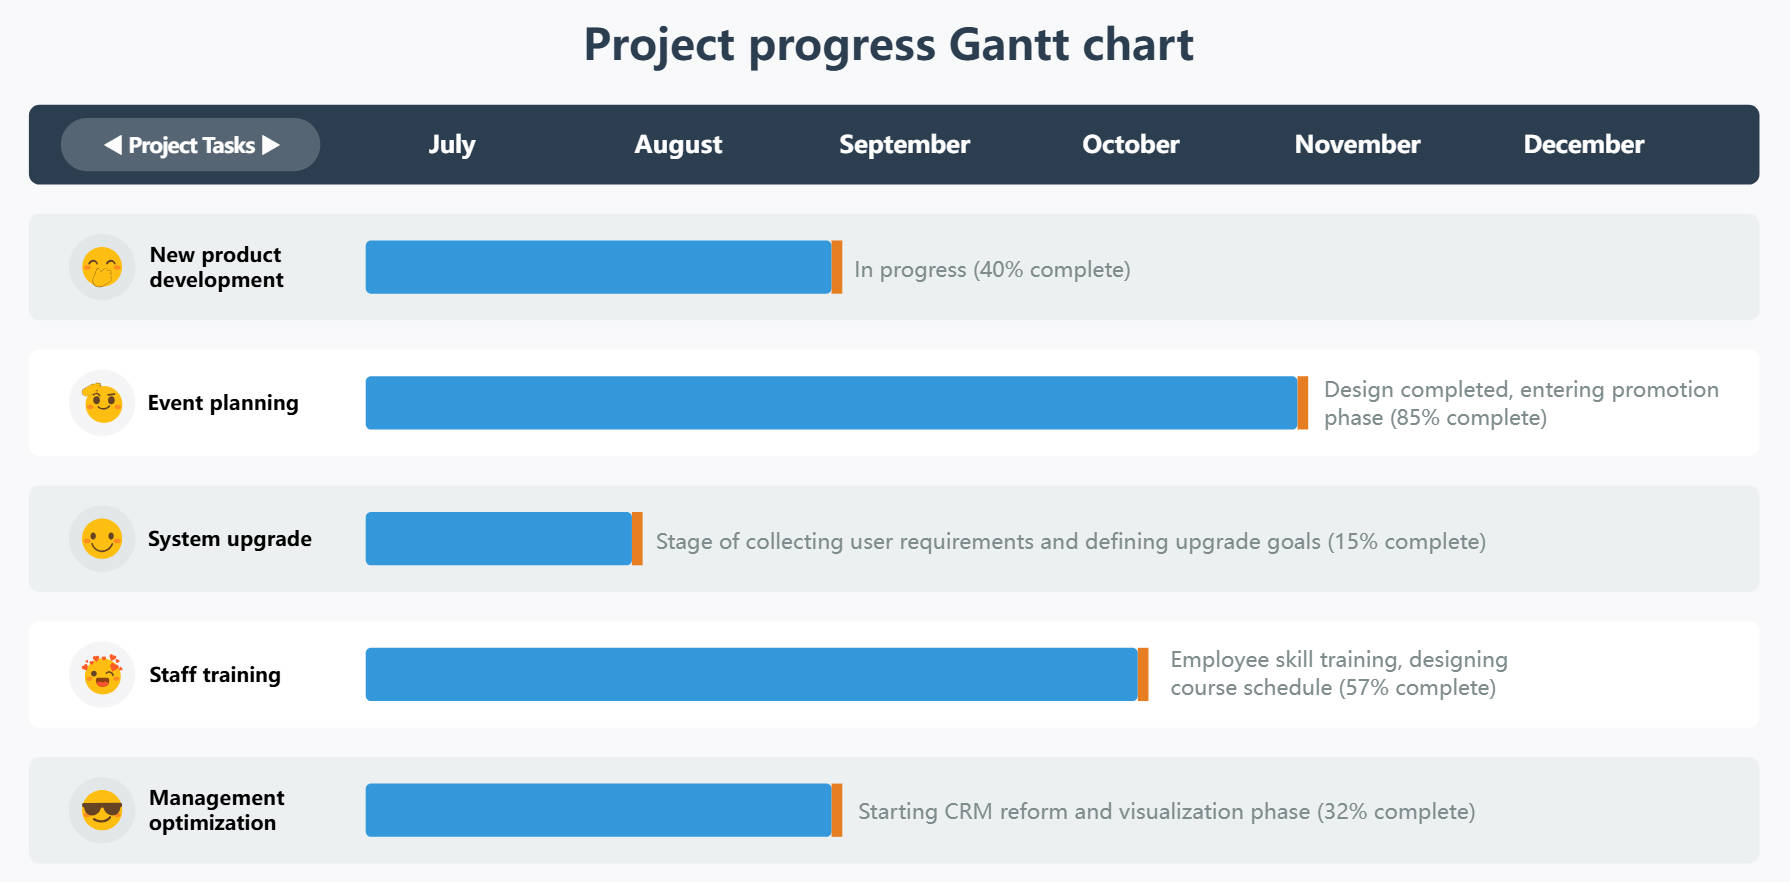
This template provides a clear visual timeline for tracking multiple business initiatives from July through December. It is designed to help project managers monitor completion status and specific task milestones across different departments in real-time.
Product and Event Management
This section tracks the high-level progress of product creation and marketing events. It helps teams understand if development and promotion phases are meeting their specific deadlines and completion targets throughout the half-year schedule.
- New product development: Currently at 40% completion status.
- Event planning: Reached 85% completion, entering the promotion phase.
- Timeline focus: Covers the critical window from July to November.
Systems and Human Resources
This part of the chart focuses on technical upgrades and employee development. It ensures that infrastructure and staff skills grow alongside project needs by monitoring specific goals like requirement collection and course design.
- System upgrade: 15% complete while defining upgrade goals.
- Staff training: Reached 57% completion for employee skill training.
- Resource allocation: Shows dependencies between technical and human capital.
Operational Optimization
This section monitors internal efficiency improvements and management reforms. It allows leadership to track the transition into more visual data practices and CRM system updates that enhance overall business performance and organizational structure.
- Management optimization: 32% complete and starting CRM reform.
- Visualization phase: Currently active to improve data reporting.
- Long-term tracking: Extends project monitoring through December milestones.