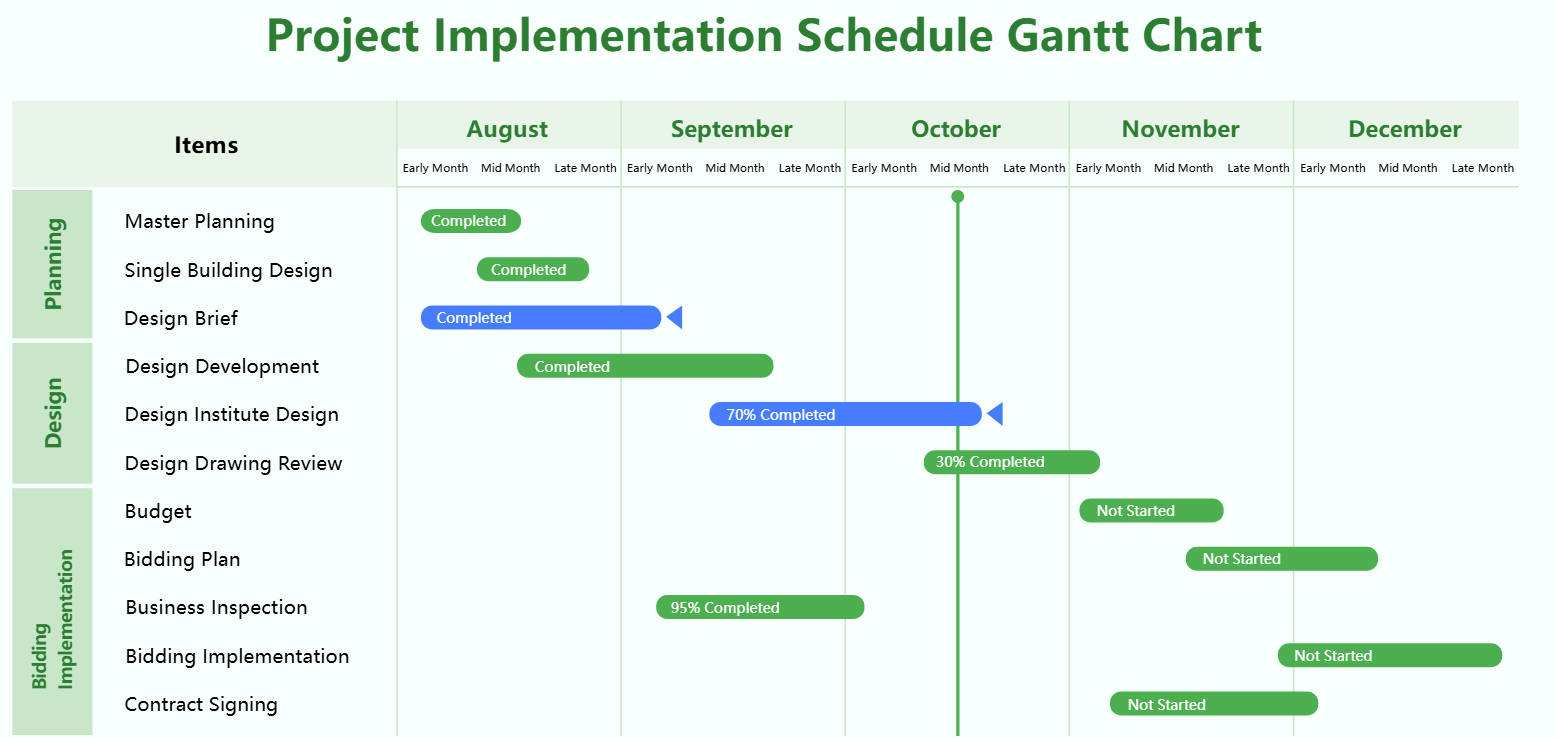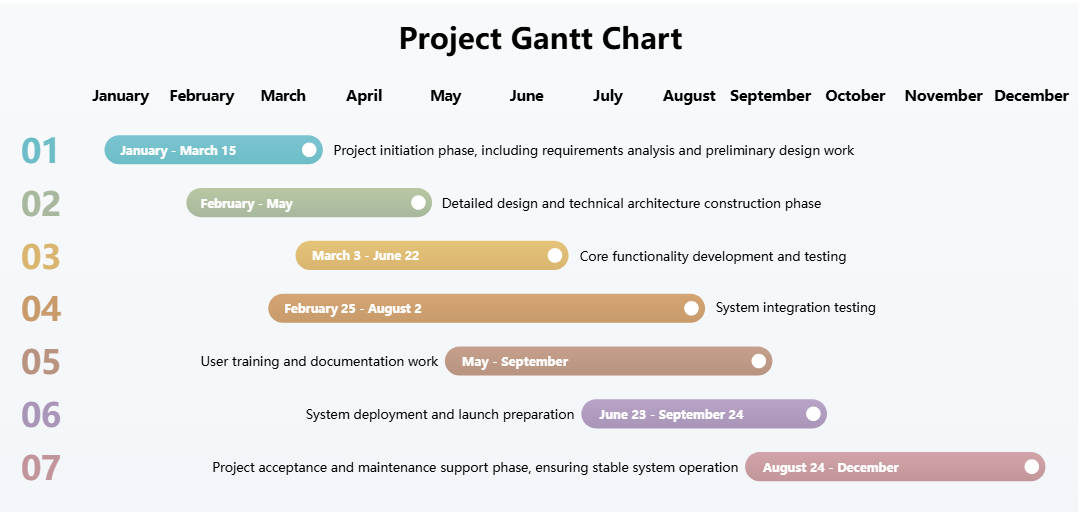
About this project planning Gantt chart template
This template offers a clear visual roadmap for complex projects. It covers everything from early design phases to final maintenance. Utilize this professional layout to effectively communicate timelines to stakeholders and ensure that every task remains on track throughout the year.
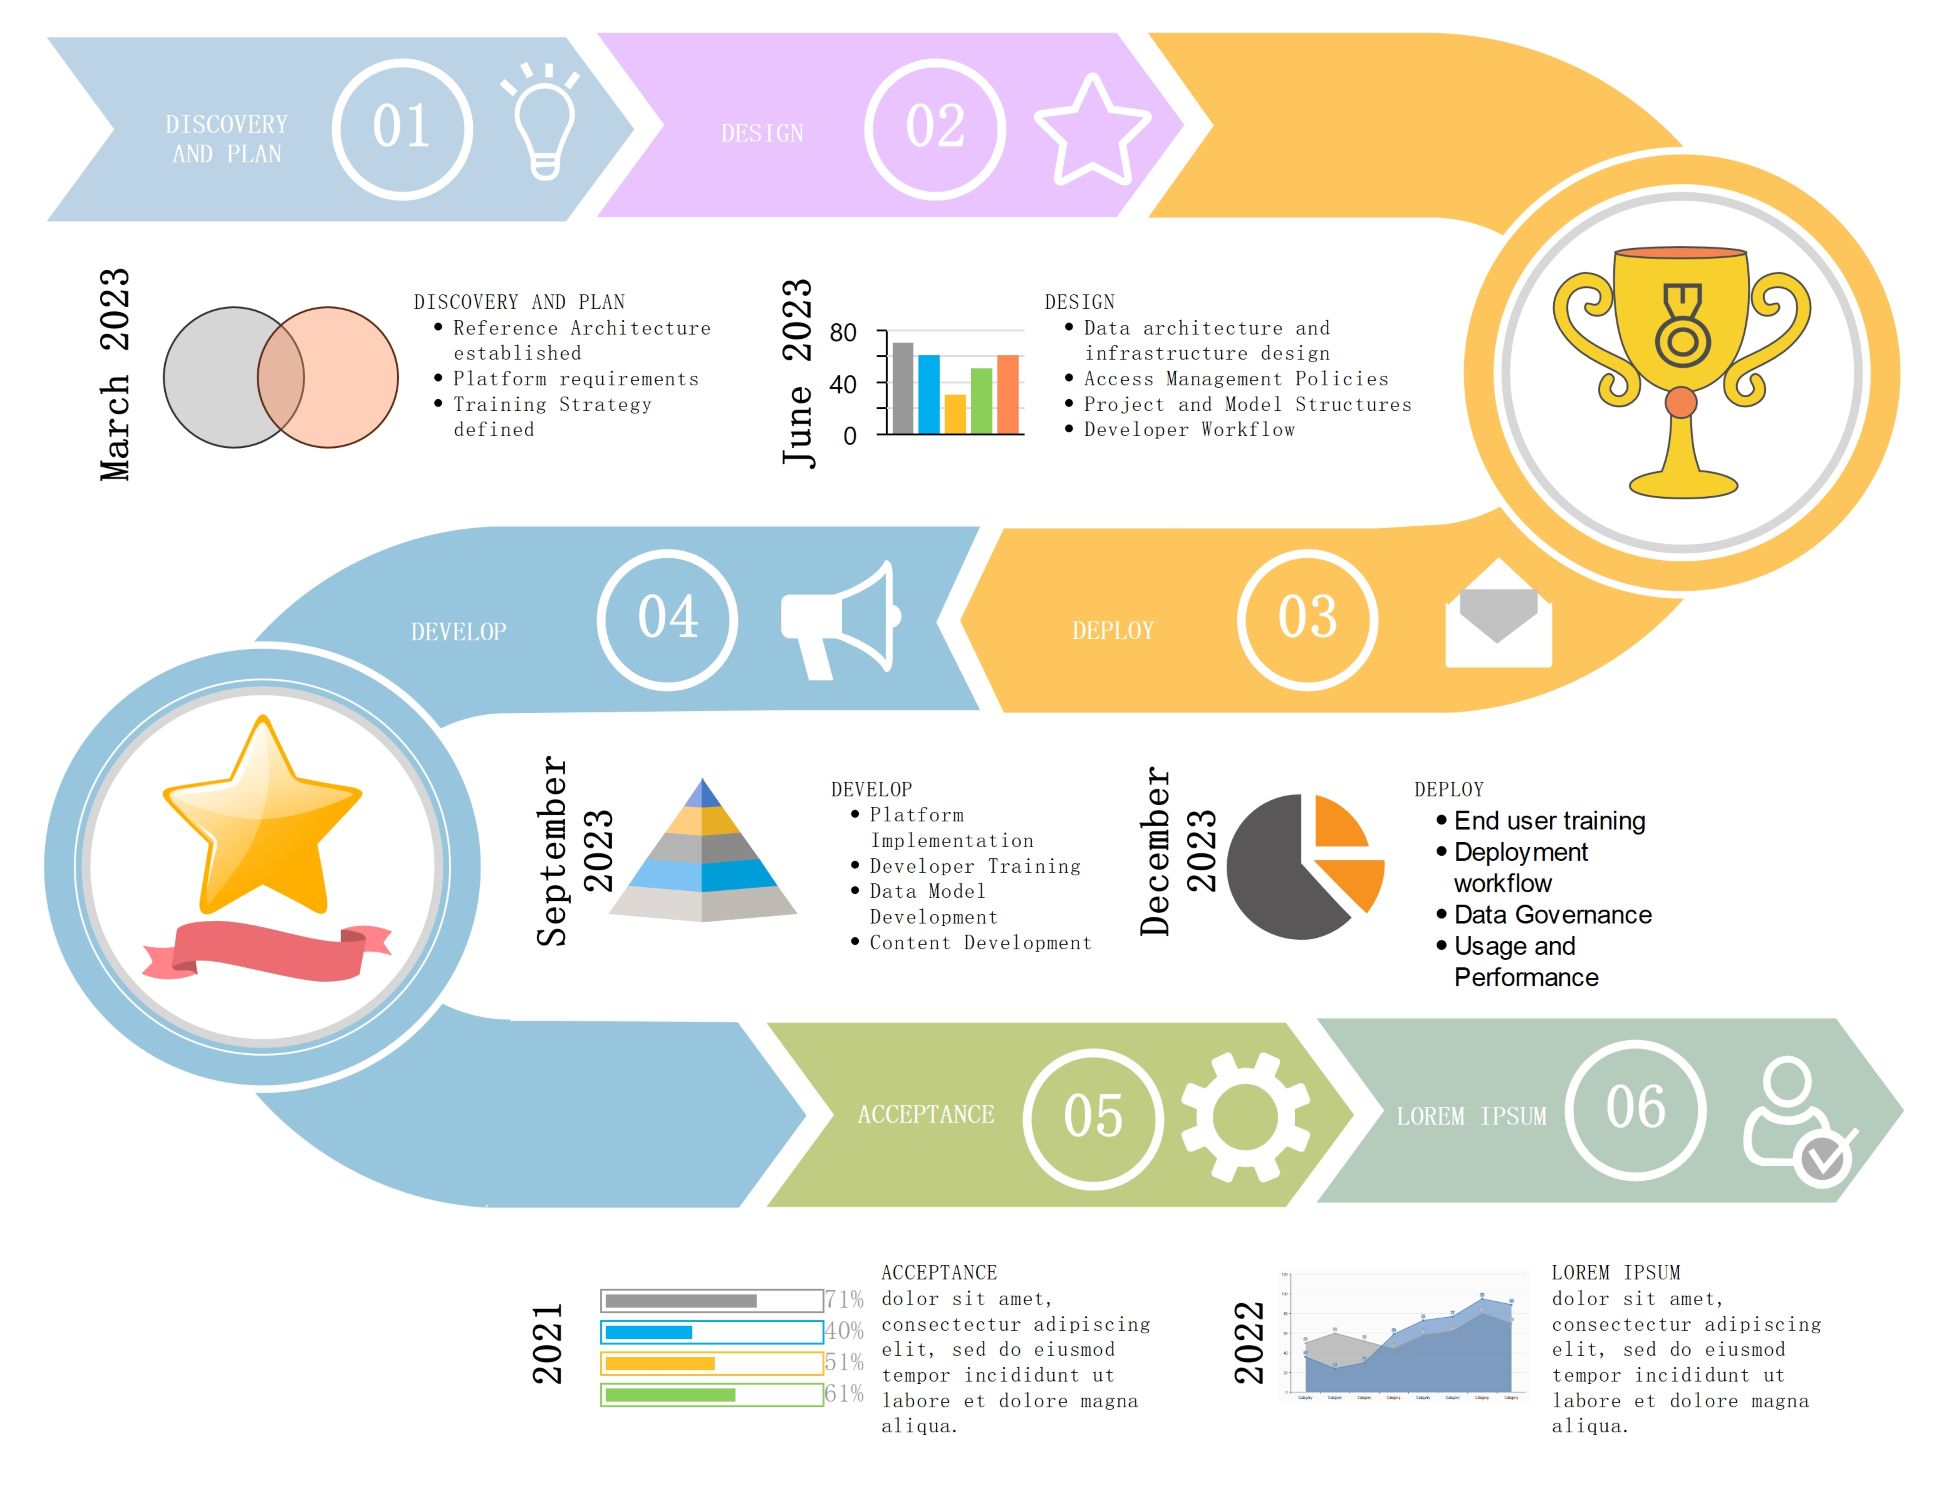
Project Initiation and Design Phase
This stage focuses on setting a strong foundation for your project's success. It involves gathering all requirements and creating early design sketches to guide the development team through future complex tasks and build phases.
- Requirements analysis
- Preliminary design work
- January to March 15 timeline
- Detailed design phase
Development and Integration Testing
This phase covers building the main software features and testing how they work together. It ensures that the technical architecture is stable and that all core functions meet the initial project quality standards for users.
- Core functionality development
- Technical architecture construction
- System integration testing
- February to August timeline
Launch Preparation and Maintenance
The final stage focuses on preparing users and launching the system safely. It includes training sessions, final deployment steps, and ongoing support to ensure the system operates smoothly after the official project handoff and acceptance.
- User training and documentation
- System deployment and launch preparation
- Project acceptance and support
- August to December timeline