About this Smart Project Phase System Architecture Diagram
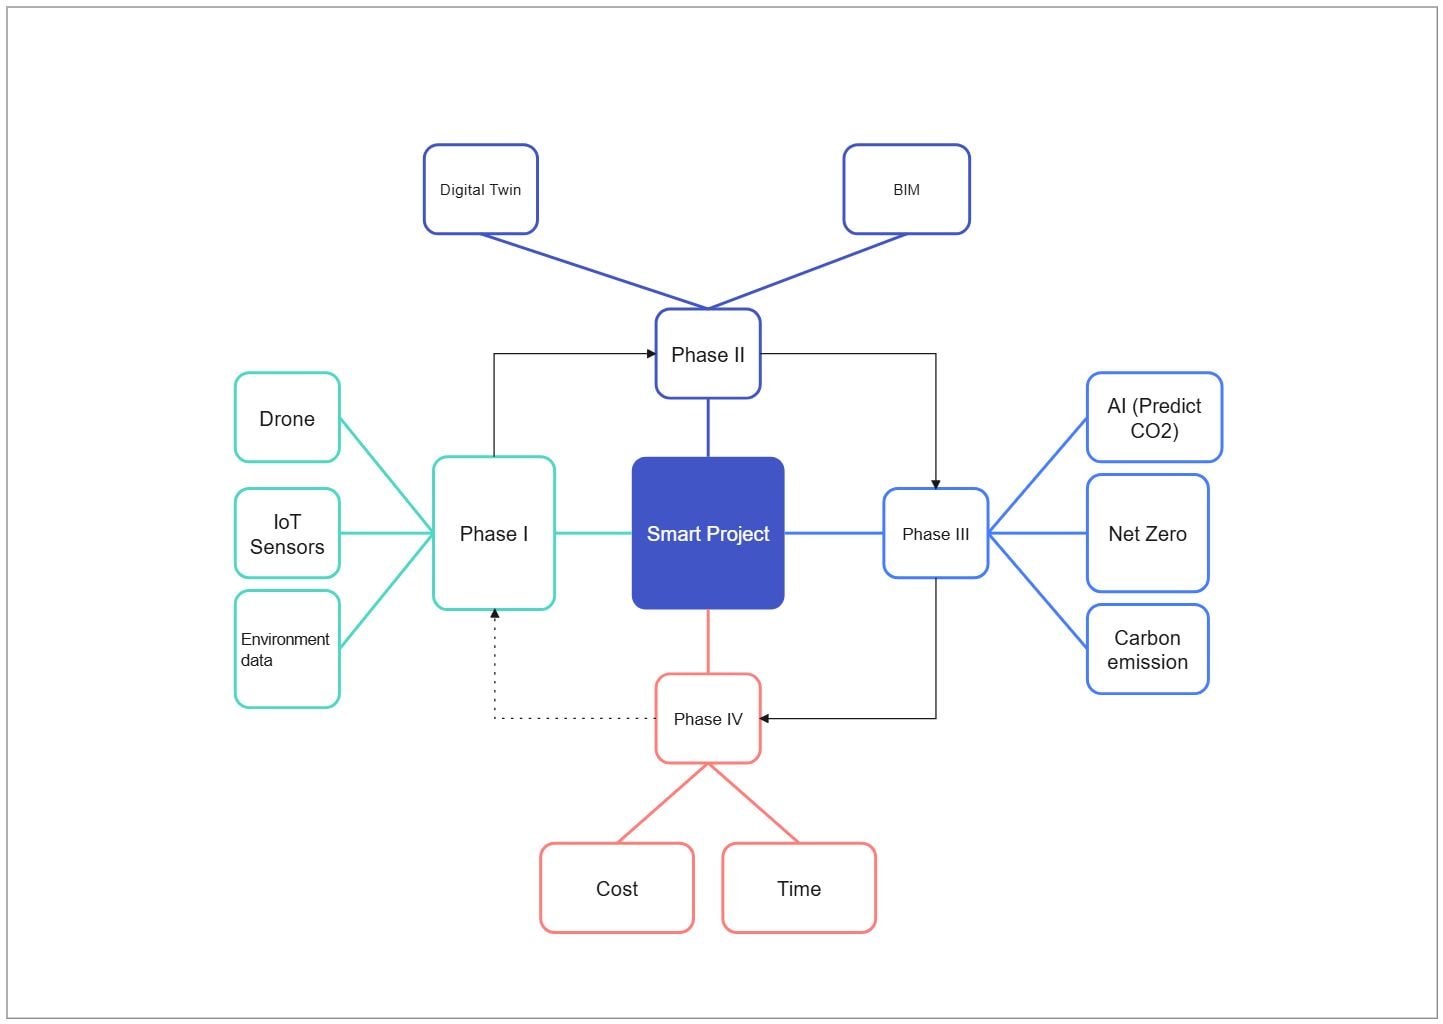
This diagram shows the main structure of a smart project phase system architecture diagram, with the visible layers or blocks separated so each part of the system can be explained more clearly.
Phase I and Field Capture
The Phase I and Field Capture section groups the visible components in this part of the diagram. In this layout, it includes Phase I, Drone, IoT Sensors, Environment data, which helps define what this block is responsible for in the wider architecture.
- Phase I
- Drone
- IoT Sensors
- Environment data
Phase II and Digital Modeling
The Phase II and Digital Modeling section groups the visible components in this part of the diagram. In this layout, it includes Phase II, Digital Twin, BIM, which helps define what this block is responsible for in the wider architecture.
- Phase II
- Digital Twin
- BIM
Phase III and Smart Analysis
The Phase III and Smart Analysis section groups the visible components in this part of the diagram. In this layout, it includes Phase III, AI (Predict CO2), Net Zero, Carbon emission, which helps define what this block is responsible for in the wider architecture.
- Phase III
- AI (Predict CO2)
- Net Zero
- Carbon emission
Phase IV and Delivery Metrics
The Phase IV and Delivery Metrics section groups the visible components in this part of the diagram. In this layout, it includes Phase IV, Cost, Time, which helps define what this block is responsible for in the wider architecture.
- Phase IV
- Cost
- Time
FAQs about this Template
-
How do teams visualize Smart Project Phase System AI architecture?
Teams usually visualize Smart Project Phase System AI architecture with a diagram that separates input flow, model processing, orchestration, and supporting data or control layers. This makes it easier to review how requests move through sections such as Phase I and Field Capture, Phase II and Digital Modeling, and Phase III and Smart Analysis, and where inference, retrieval, feedback, external integrations, or support logic fit in the workflow.
-
Can AI generate Smart Project Phase System architecture diagrams automatically?
Yes, AI can generate a first draft of a Smart Project Phase System architecture diagram, but it still needs human review. AI is useful for proposing flow structure and major groupings, while engineers should validate the real model pipeline, data dependencies, security boundaries, tool integrations, and support assumptions before using the diagram in delivery or technical review.
-
What is the difference between AI architecture and application architecture?
AI architecture focuses more directly on model flow, inference logic, retrieval, orchestration, and feedback loops, while application architecture describes broader software structure. AI diagrams are more useful when teams need to explain how prompts, data, models, outputs, support services, and control layers connect inside an intelligent system or agent workflow.
-
What should a Smart Project Phase System AI architecture diagram include?
A strong Smart Project Phase System AI architecture diagram should include the main inputs, model or agent layer, data or retrieval sources, and the core output path. It should also show where orchestration, monitoring, external tools, feedback loops, or support controls connect, so readers can understand the real processing flow instead of seeing only isolated technical blocks.
-
Which diagram type is best for documenting AI workflows?
An architecture diagram is usually the best place to start because it shows the main workflow, dependencies, and support layers in one view. Teams often add sequence, agent flow, or data pipeline diagrams later when they need to explain prompt handling, retrieval order, model interaction, operations detail, or escalation paths more precisely.