About this Learning Platform User Flow and System Architecture Diagram
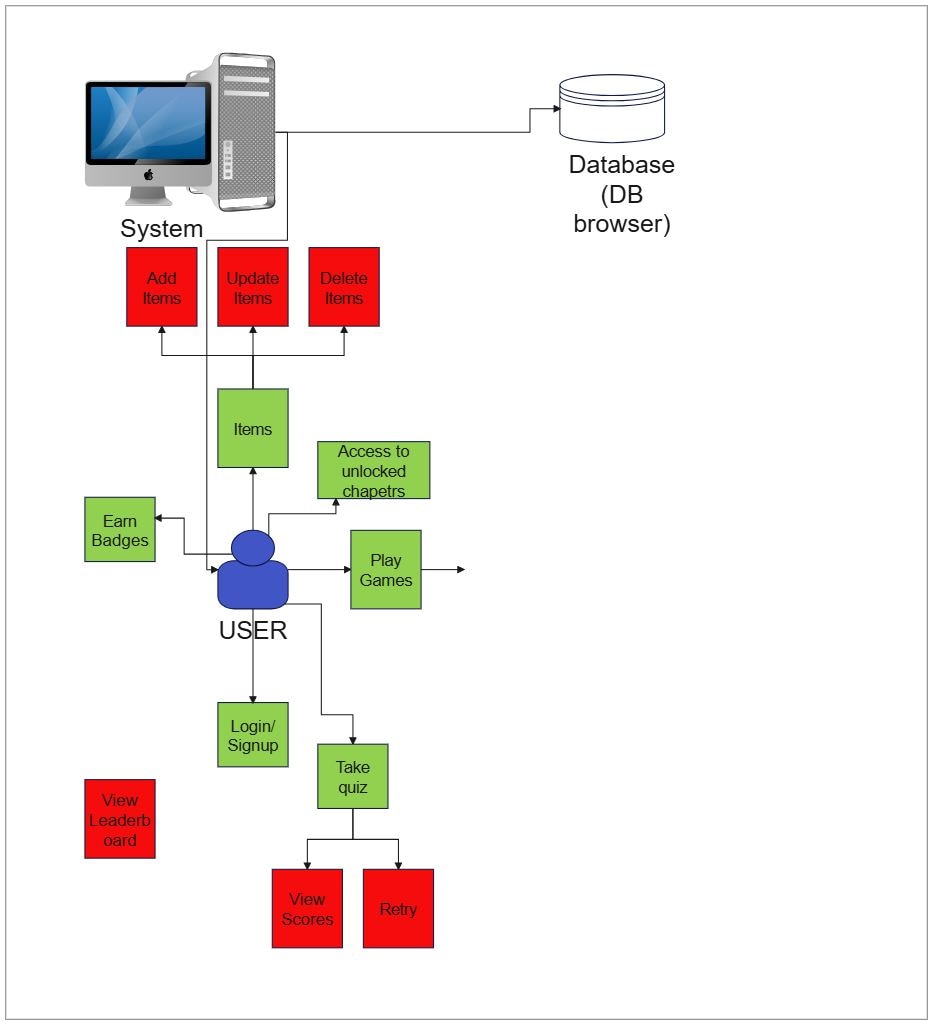
This diagram shows the main structure of a learning platform user flow and system architecture diagram, with the visible layers or blocks separated so each part of the system can be explained more clearly.
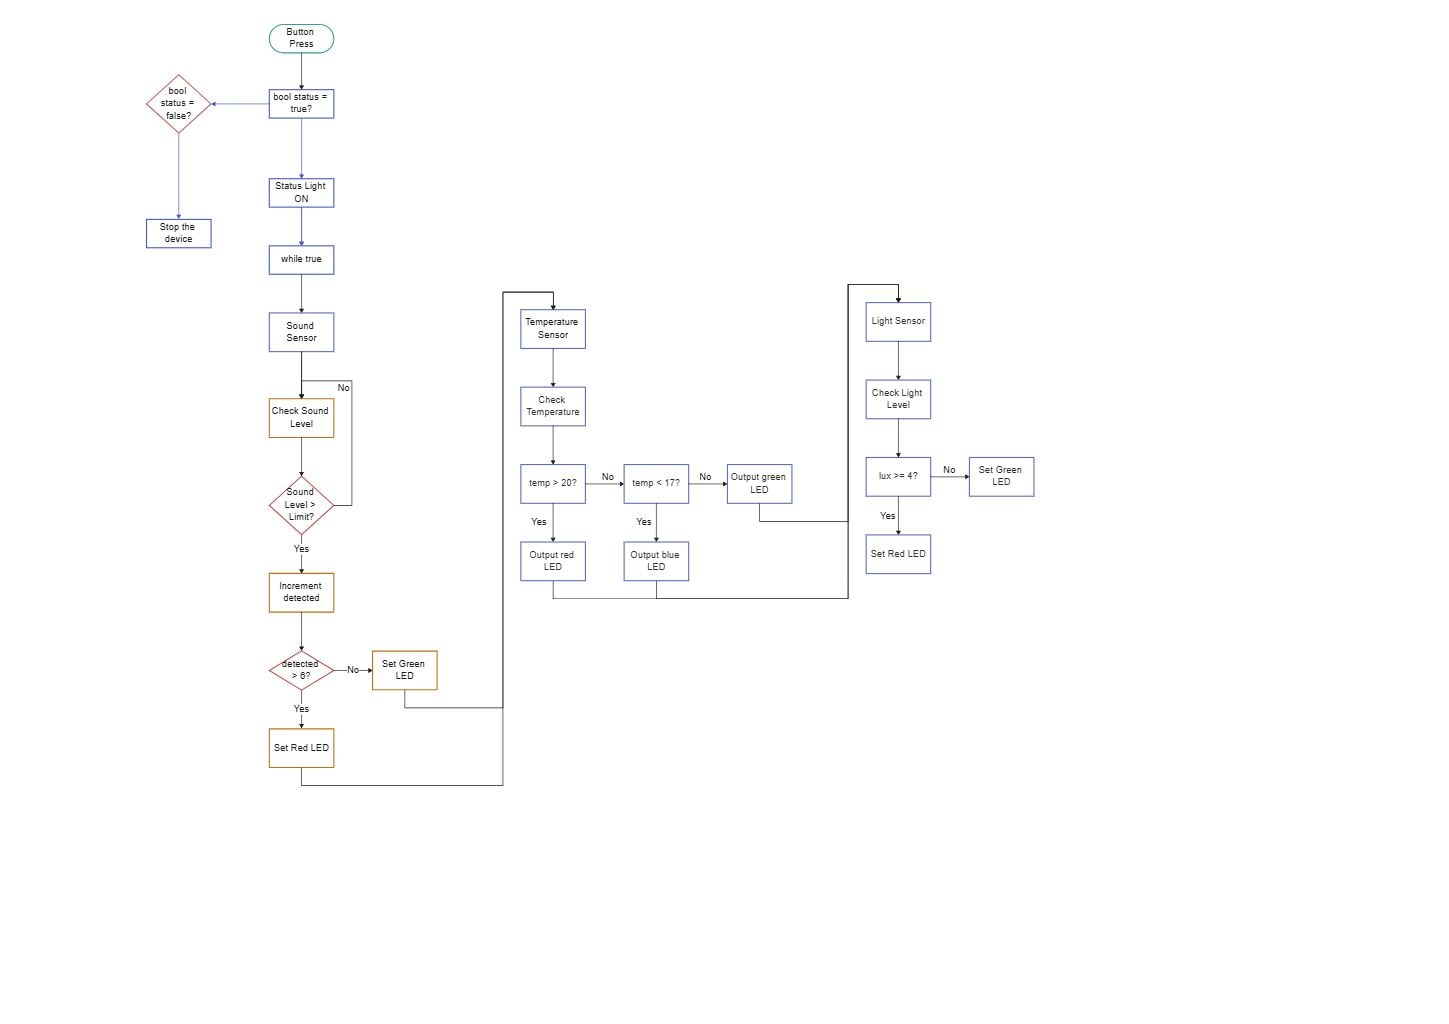
User Entry and Account Flow
The User Entry and Account Flow section groups the visible components in this part of the diagram. In this layout, it includes USER, Login/ Signup, System, which helps define what this block is responsible for in the wider architecture.
- USER
- Login/ Signup
- System
Learning Activities
The Learning Activities section groups the visible components in this part of the diagram. In this layout, it includes Take quiz, Play Games, Retry, Items, which helps define what this block is responsible for in the wider architecture.
- Take quiz
- Play Games
- Retry
- Items
- Add Items
- Update Items
- Delete Items
Progress and Motivation
The Progress and Motivation section groups the visible components in this part of the diagram. In this layout, it includes Earn Badges, View Leaderb oard, View Scores, Access to unlocked chapetrs, which helps define what this block is responsible for in the wider architecture.
- Earn Badges
- View Leaderb oard
- View Scores
- Access to unlocked chapetrs
Database Support
The Database Support section groups the visible components in this part of the diagram. In this layout, it includes Database (DB browser), which helps define what this block is responsible for in the wider architecture.
- Database (DB browser)
FAQs about this Template
-
How do teams document Learning Platform User Flow and System data architecture?
Teams usually document Learning Platform User Flow and System data architecture with a diagram that separates ingestion, processing, storage, access, and control layers. This makes it easier to review how information moves through the platform, where data is transformed, and how analytics, governance, reporting, compliance, or downstream systems depend on the same structure.
-
What is the difference between data architecture and application architecture?
Data architecture focuses on how information is collected, processed, stored, secured, and consumed, while application architecture describes the broader software structure around it. Data diagrams are more useful when teams need to explain pipelines, databases, warehouses, analytics layers, governance controls, compliance checkpoints, audit visibility, or the movement of records between systems.
-
What should a Learning Platform User Flow and System data architecture diagram include?
A strong Learning Platform User Flow and System data architecture diagram should include the main data sources, processing flow, storage layers, and access or reporting points. It should also show where governance, security, integration, transformation, quality checks, or lineage steps connect, so readers can understand the lifecycle of data from entry to operational or analytical use.
-
Can AI generate Learning Platform User Flow and System data architecture diagrams automatically?
Yes, AI can generate a draft data architecture diagram, but it still needs technical validation. AI can help suggest pipeline stages and system groupings, while engineers should confirm the real data sources, processing order, ownership boundaries, storage design, compliance controls, and support assumptions before using the diagram for planning or review.
-
Which diagram type is best for documenting data pipelines?
A data architecture diagram is usually the best starting point for documenting data pipelines because it shows sources, transformation stages, storage, and consumption paths in one view. Teams may add flowcharts or sequence diagrams later when they need more detail for pipeline execution order, failure handling, alerting, operational troubleshooting, or support ownership.