


- How to Create a PERT Chart in Excel
- How to Create a PERT Chart in Edraw Max
- How to Save and Export Your PERT Chart

How to Create a PERT Chart in Excel
There are many ways to create a PERT chart in Excel, but for this tutorial, we will use the Text tool. To learn how to create a PERT chart in Excel, follow the step-by-step guide mentioned below:
Step 1: Open Excel
Launch MS Excel on your desktop. For this guide we will use MS Excel 2013.
Step 2: Select Blank Worksheet
Once MS Excel has launched, select a blank worksheet.
Step 3: Create PERT Chart
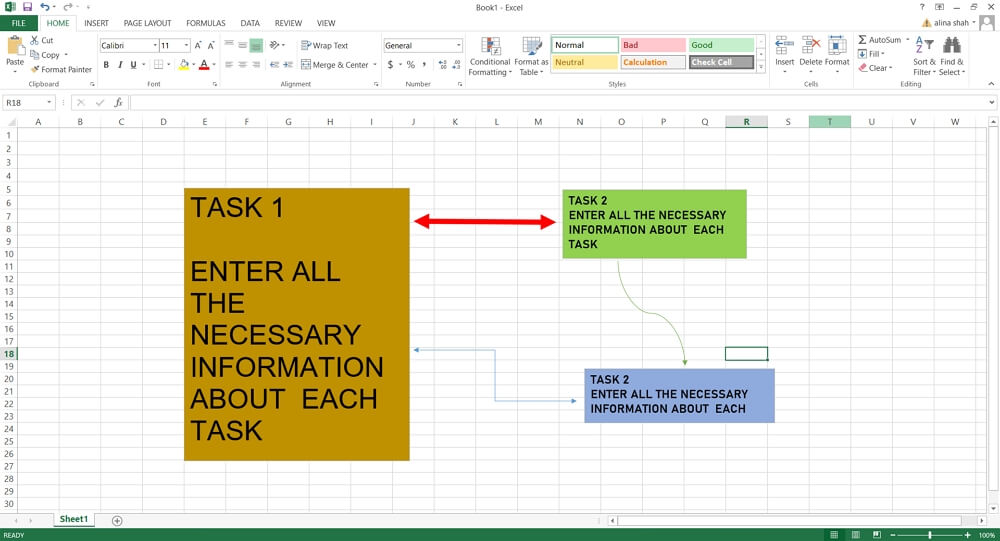
To create a PERT chart in MS Excel, go to the Insert Tab on the Excel ribbon and click on the text box under the text section. Click on the area of the worksheet where you want to place a text box. Resize the text work by selecting intent and dragging by the corners. Keep putting different text boxes in the order of your process.
Step 4: Add Details
Once you have arranged different textboxes on the worksheet, go to the Format Tab under the drawing tools on the Excel ribbon and use various tools to change the features of the text box such as style, color, background, etc.
Now, add the text within each text box. In each textbox, enter the details of a single task and make sure to include all the necessary information that needs to be displayed.
Once all the tasks have been labeled and displayed, go to Shapes in the “Illustrations” sections under Insert tab and select the lines or rows to connect your textbox. Once you have placed the characters you will get a basic looking PERT chart.
Step 5: Save
When your PERT chart is complete click on the File tab and save your document.
How to Create a PERT Chart in Edraw Max
Step 1: Open Edraw Max Online
Open your browser and go to Edraw Max Online website, i.e., edrawmax.com/online.
Step 2: Select Template
There are two ways to create a PERT chart in Edraw Max. The first one is to use a pre-made template and customize it to suit your requirements.
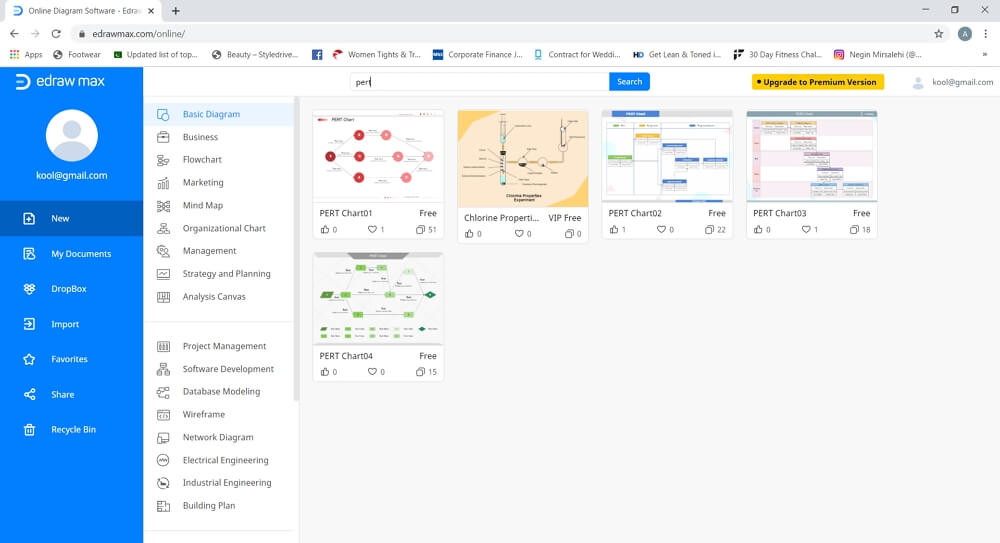
The other option is to select a blank template and create a PERT chart from scratch. For this tutorial, we will use a blank template.
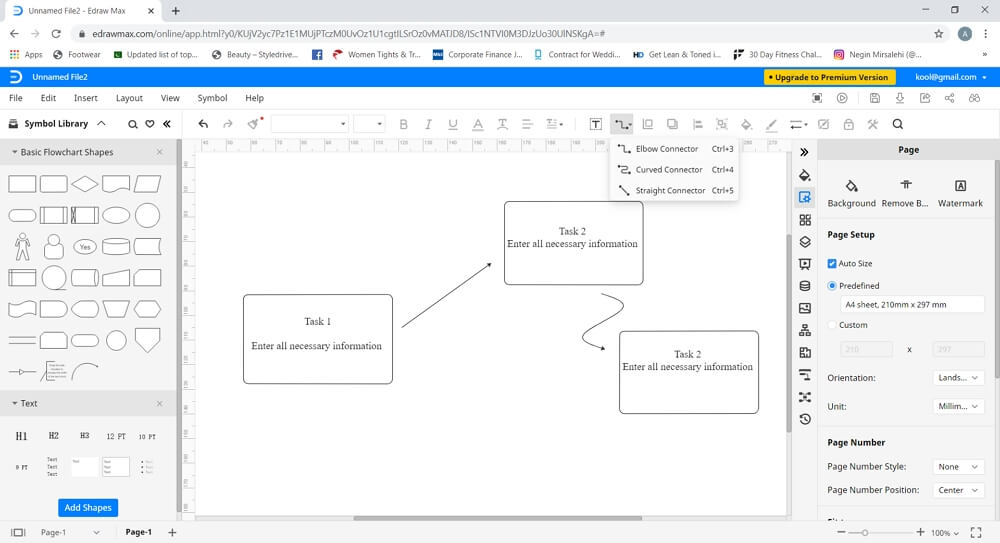
Step 3: Launch Drawing Tab
Once you click on the blank template option, a new tab will launch where you will get the online drawing tool. You will find a symbol library on the left side of the screen and formatting Tab on the right side of the screen. On the menu ribbon, there are different tools present along with different tabs like file, edit, insert, layout, view, and symbol.
Steps 4: Create PERT Chart
To create a PERT chart in excel from scratch, select the shape from “basic flowchart shapes” in the symbol library and drag it onto the drawing canvas. Then add text within the shape. It is the information related to each task of the process.
Add connectors between the tasks. Go to the connector icon on the menu ribbon and select any one of the connector options.
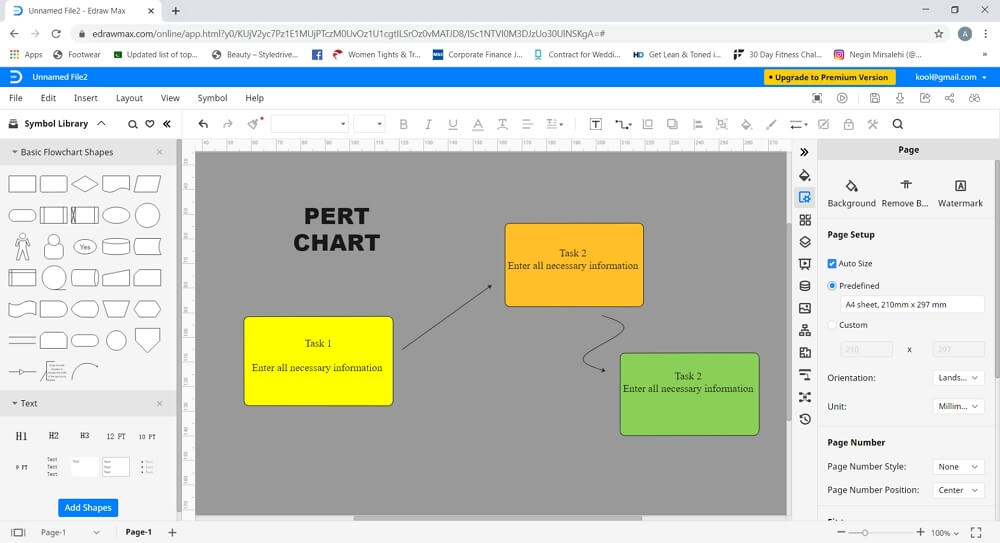
Step 5: Add Details
Now you can add colors, symbols, illustrations, and images using both the symbol library and format tools. Keep using different ways to enhance the appearance of your PERT chart until you are delighted with how it looks.
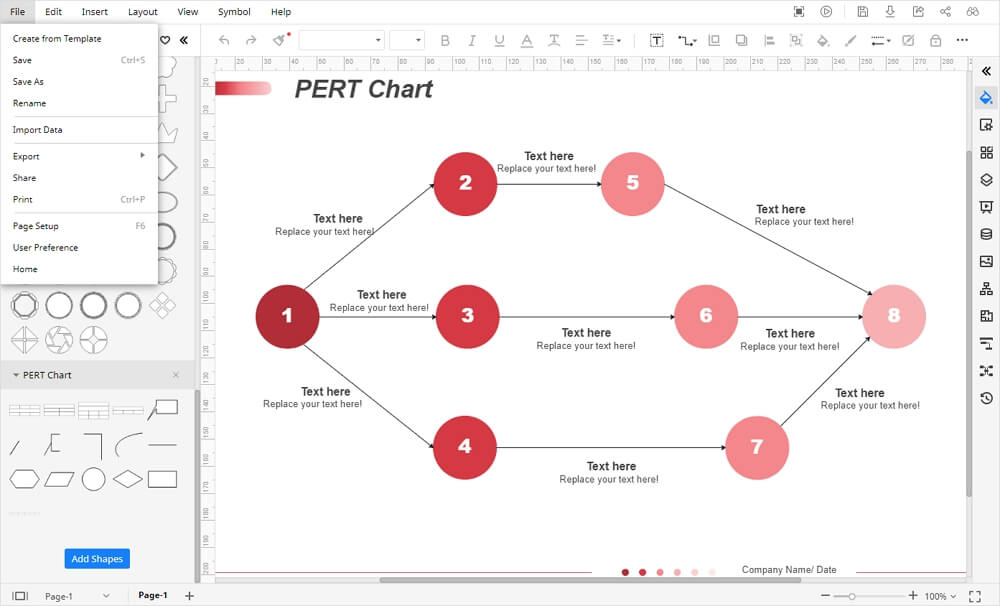
How to Save and Export Your PERT Chart
You can save a PERT chart drawn in Edraw Max by using different saving options under the file tab. To save the file in local storage, click on “save”; name the document, select file location, and store it on your desktop. Another option is to save the file in cloud storage such as Google Drive and Dropbox by clicking on “save as”.
AI Diagram Generator
Enter your prompt. Upload files if needed. Generate diagrams, charts, or slides instantly.


