


The first time I tried making a fishbone diagram in PowerPoint, I thought, How hard could it be? A few lines, some labels—done. But within minutes, I was wrestling with misaligned shapes and awkward spacing.
Turns out that PowerPoint doesn’t have a built-in fishbone tool, so everything has to be created manually.
So, I kept testing different methods until I settled on a few solid solutions. In this guide, I’ll share various ways of creating a Fishbone diagram in PowerPoint.
In this article
What Is a Fishbone Diagram?
A fishbone, or Ishikawa diagram, is a structured way to break down the cause-and-effect relationship behind any problem. It helps trace a problem to its root causes through an organized process:
- State the Problem – Place the specific issue at the diagram’s head (e.g., "Low customer retention").
- Determine Categories – Use frameworks like the 6Ms or define your relevant categories.
- Identify Contributing Factors – List causes under each category, extending outward like fishbones.
- Evaluate and Prioritize – Look for trends, challenge assumptions, and isolate the root causes.
- Implement Solutions – Apply insights to address the real problem, avoiding trial and error.
This method ensures a logical, structured analysis rather than relying on opinions.
Different Use Cases of Fishbone Diagrams
The way you label the "bones" depends on your use case:
- Manufacturing – Focuses on defects, delays, and operational inefficiencies.
- Healthcare – Used to investigate patient safety incidents or diagnostic errors.
- Sales & Marketing – Helps teams understand declining revenue, low conversions, or campaign failures.
- Project Management – Identifies process inefficiencies or missed deadlines.
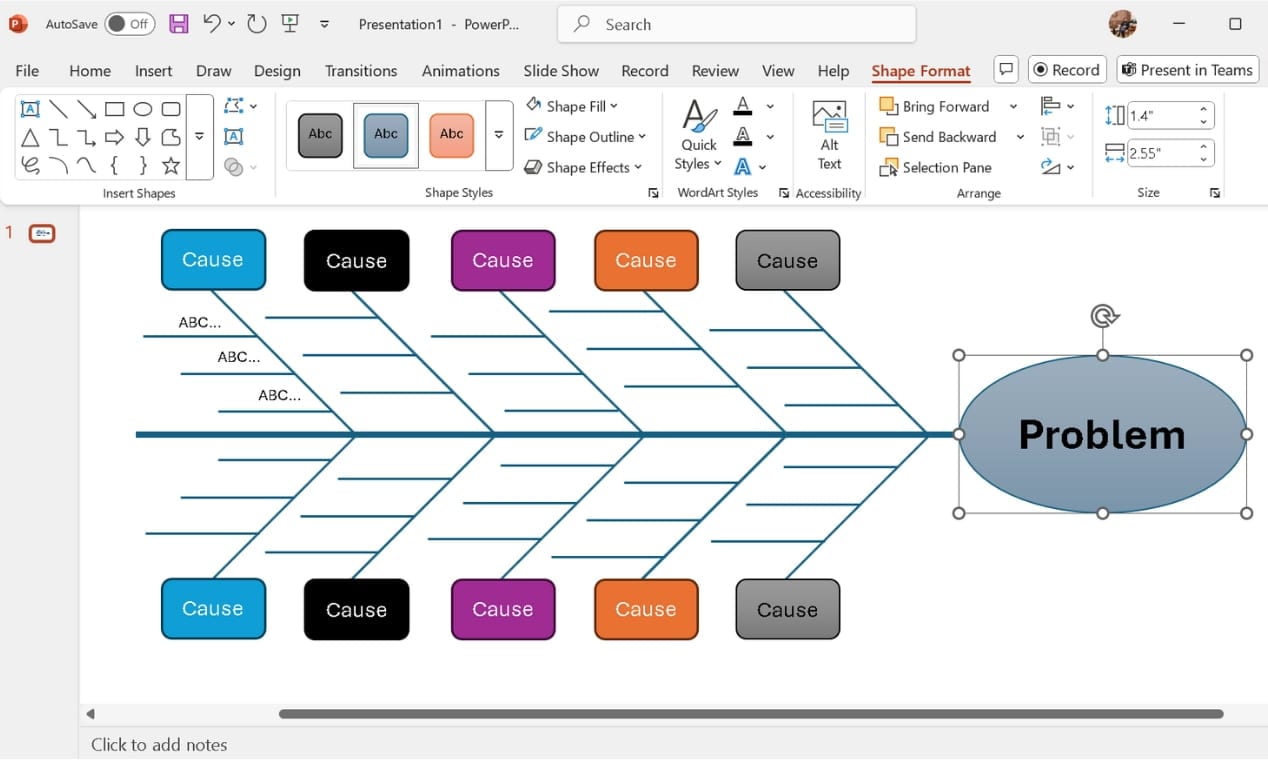
Method 1: Create a Fishbone Diagram for PowerPoint Manually
Creating a fishbone diagram in PowerPoint can be tricky if formatting gets out of hand. There are two methods. Let’s try the manual approach first.
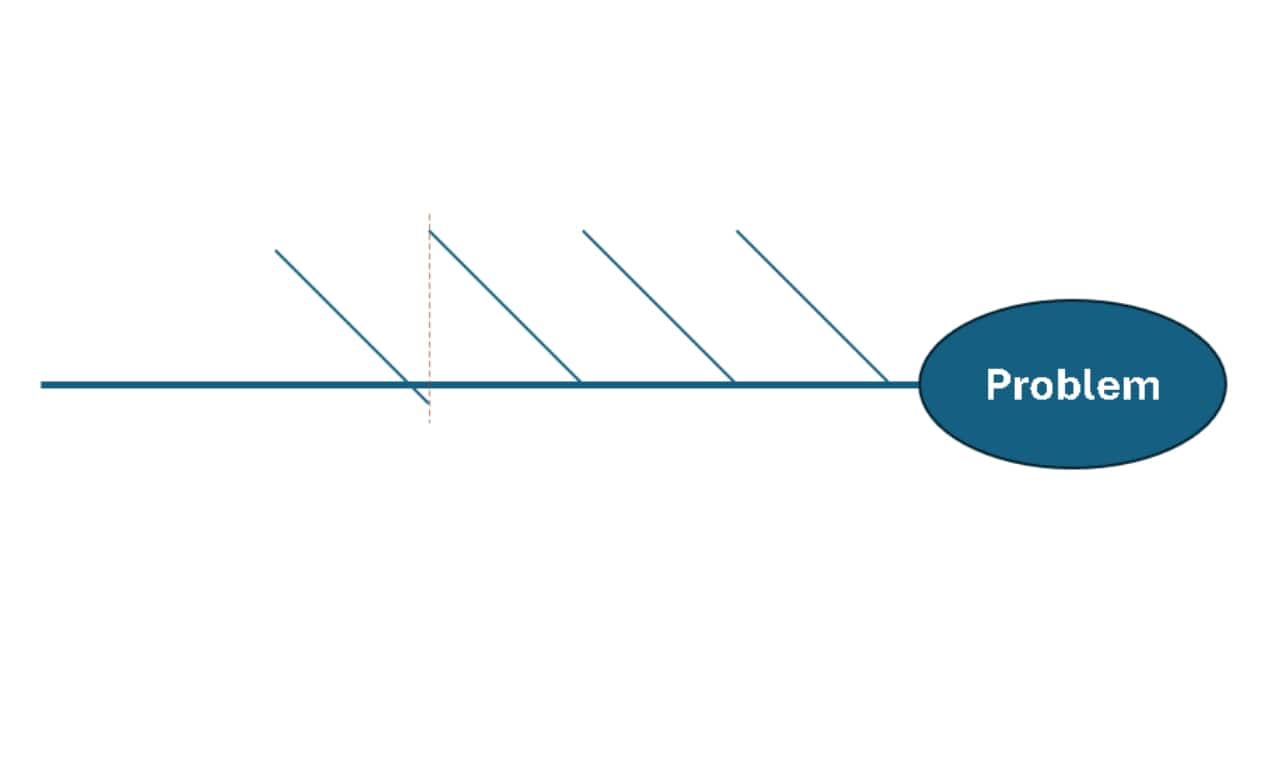
Step 1Draw the Spine (Main Line)
The spine forms the core structure, running horizontally across the slide and connecting all the cells.
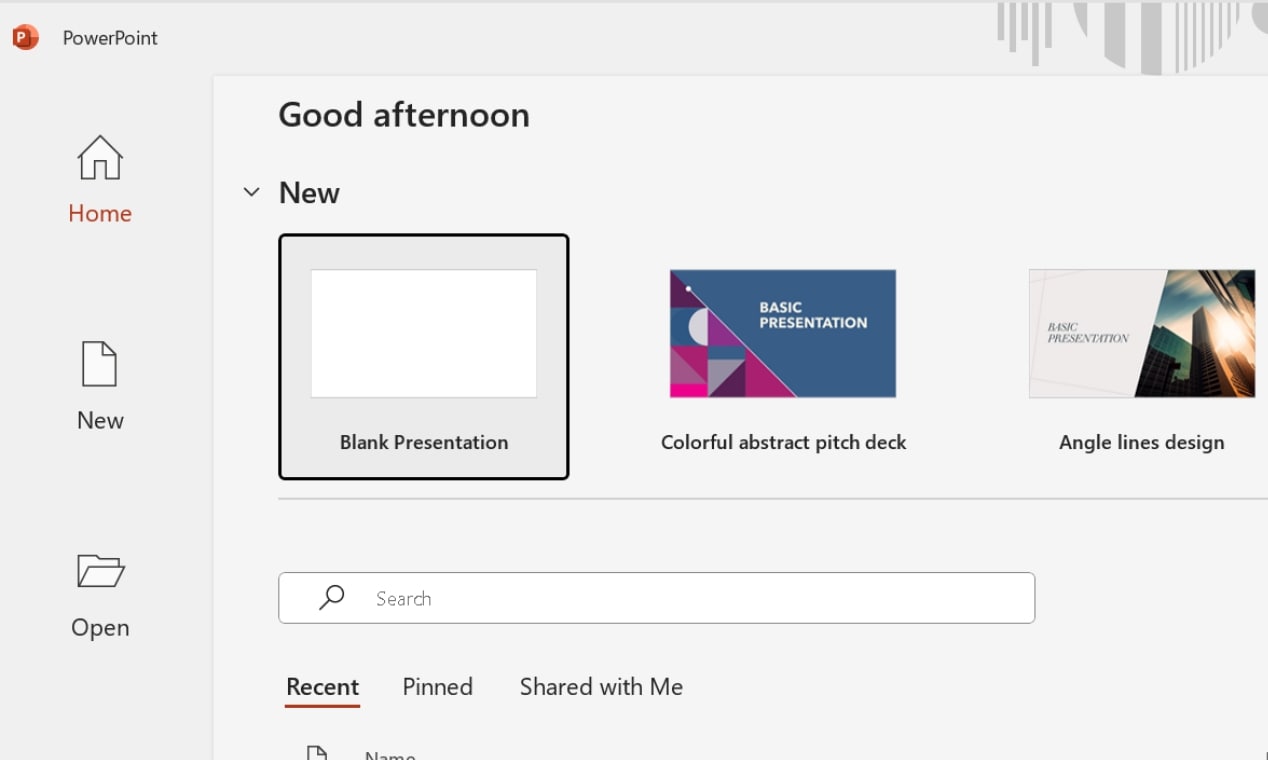
Open the PowerPoint home page and go to the slide where you want to make a fishbone diagram or start with a Blank Presentation.
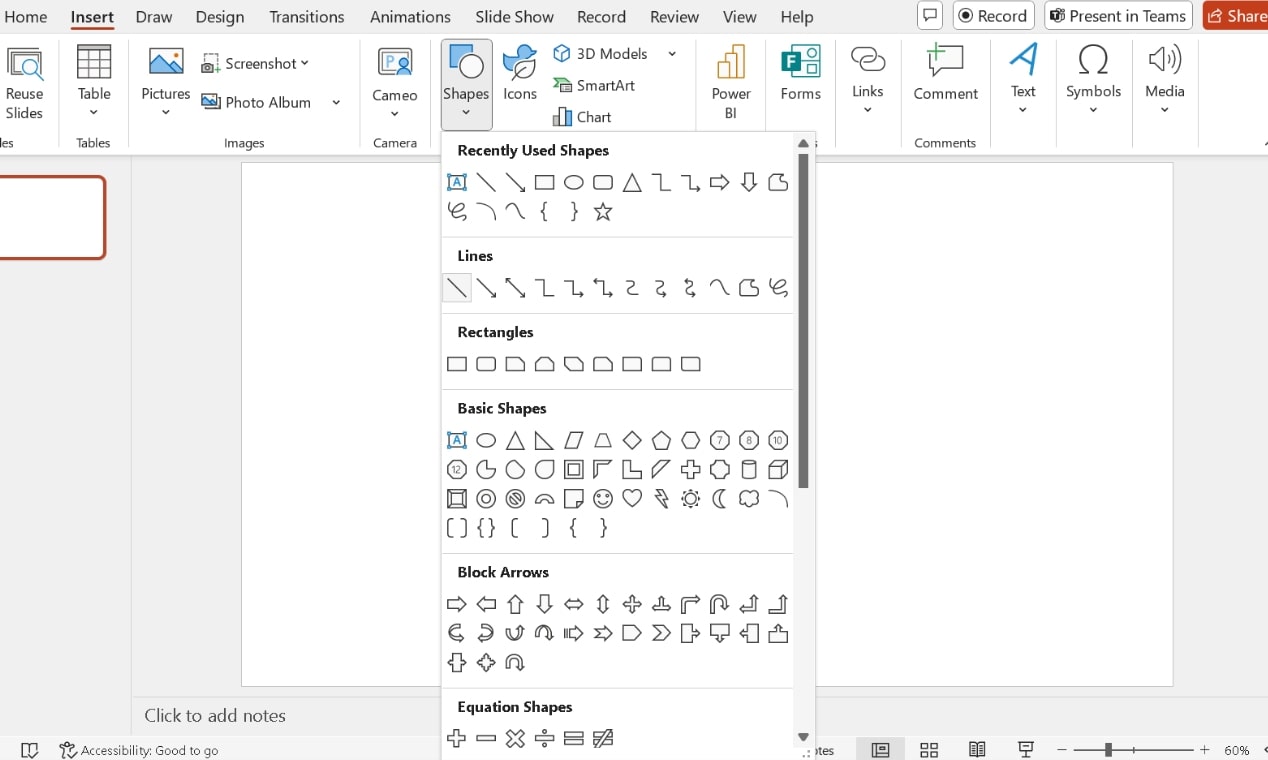
Click the Insert tab and choose Shapes.
Select the Line tool and drag the cursor to draw a straight horizontal line.
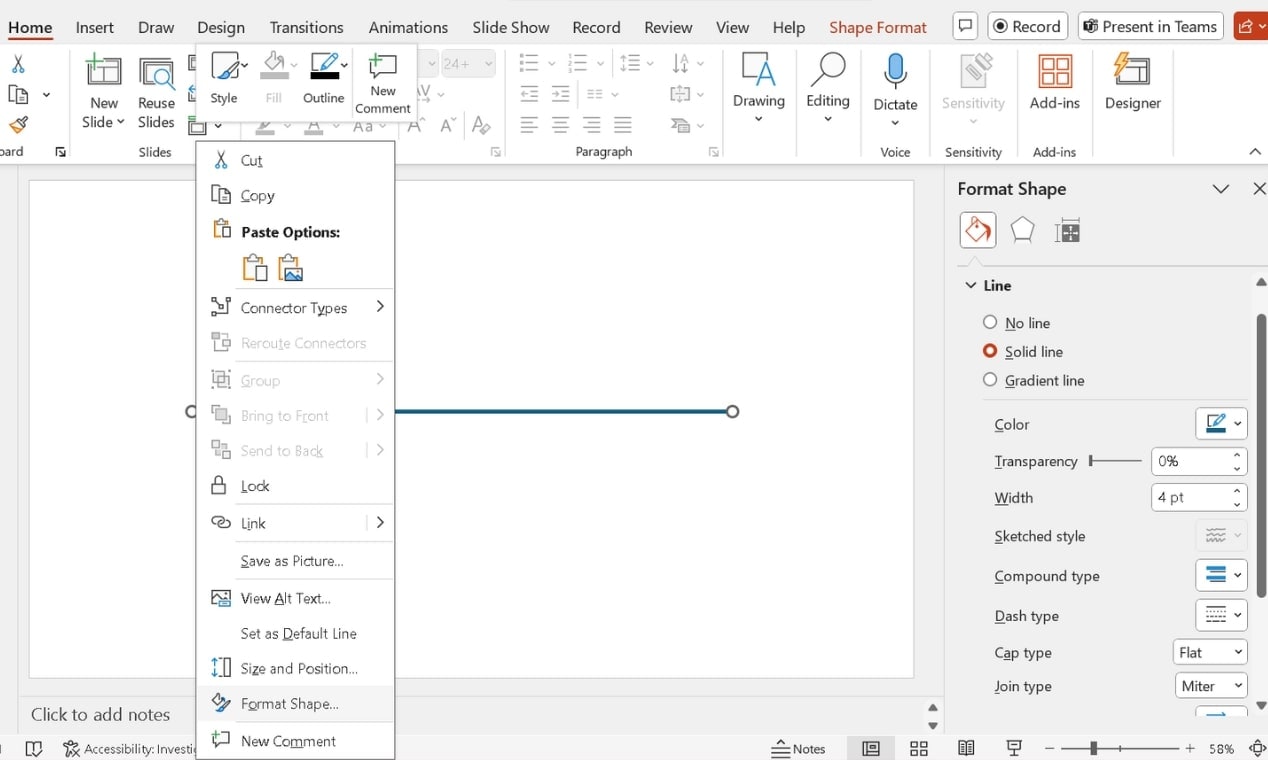
Right-click the line and adjust the thickness from the Format Shape menu for better visibility.
Step 2Add the Problem Statement (Fish Head)
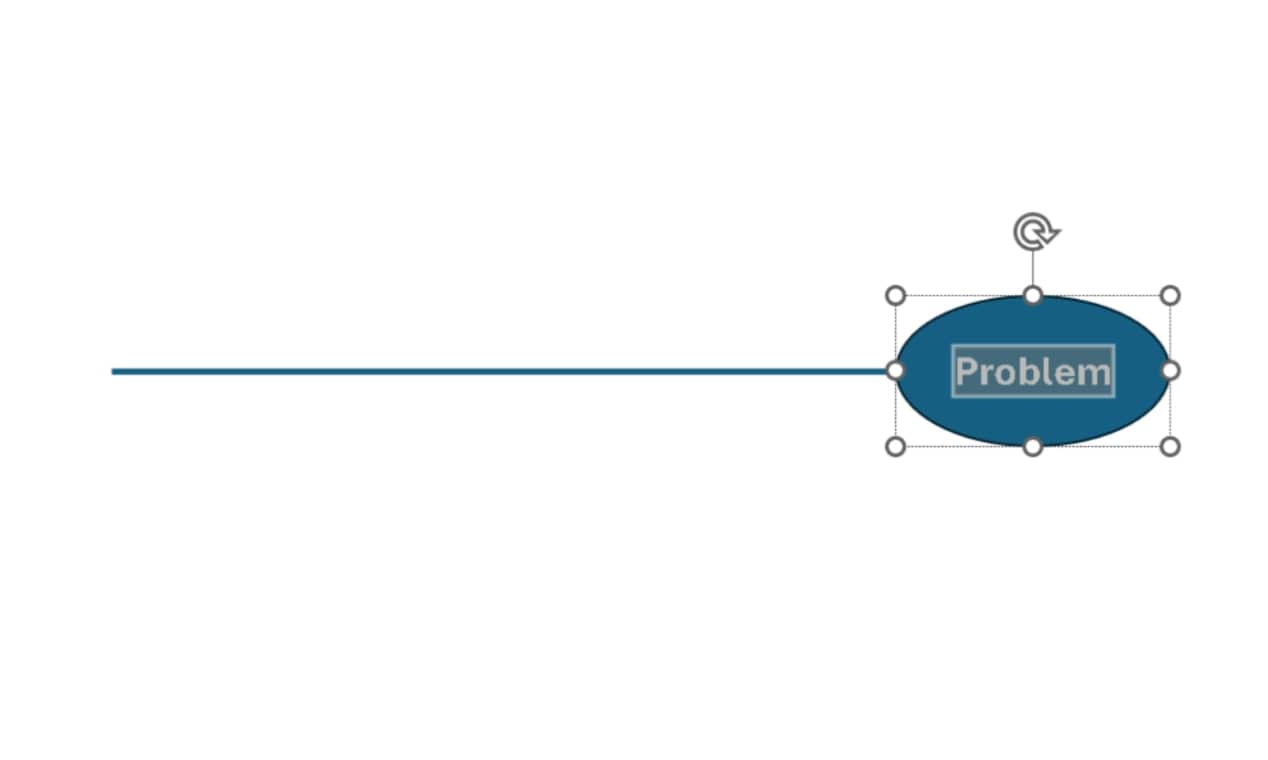
The problem statement sits at the right end of the spine and serves as the diagram's head.
- Go to Insert > Shapes and select Rectangle or Oval.
- Click and drag the cursor to draw it.
- Reposition the shape at the end of the main line using the click-and-drag feature again.
- Double-click inside it and type your major problem.
- Select the text and modify the font size and alignment from the Home tab for readability.
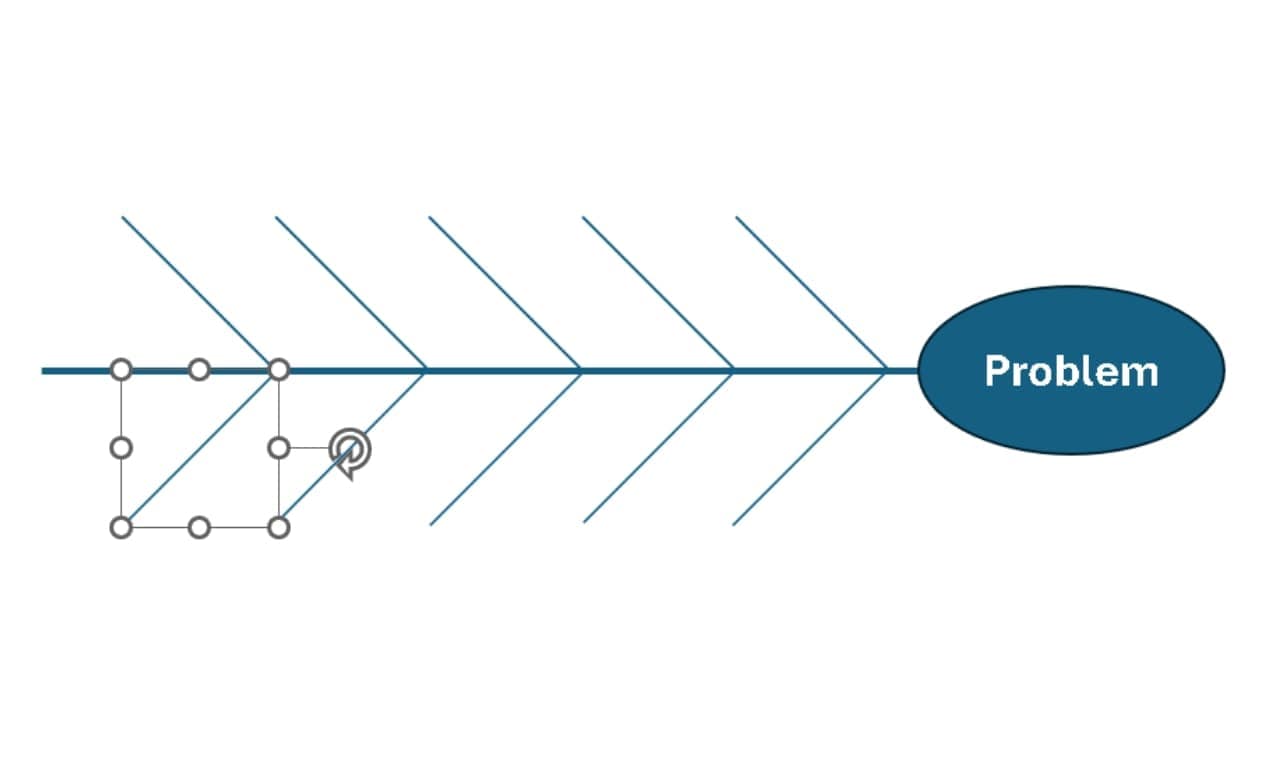
Step 3Insert the Main Causes (Primary Bones)
Each key factor influencing the problem branches off the spine diagonally.
Click Insert > Shapes, pick Line, and draw diagonal branches on both sides.
Keep the Shift button tapped while drawing to avoid inconsistencies.
Use the copy-paste feature to speed things up.
Keep angles and spacing uniform.
Add text boxes from the Insert tab to label each branch.
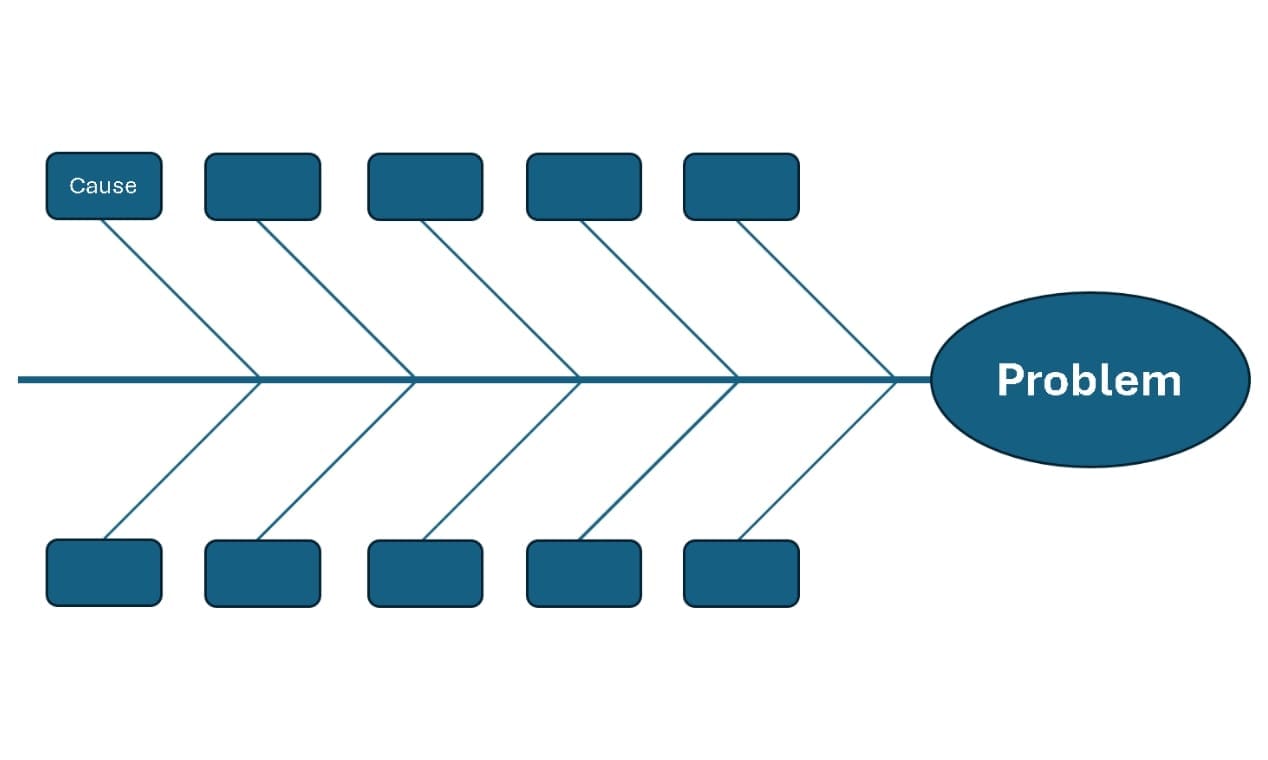
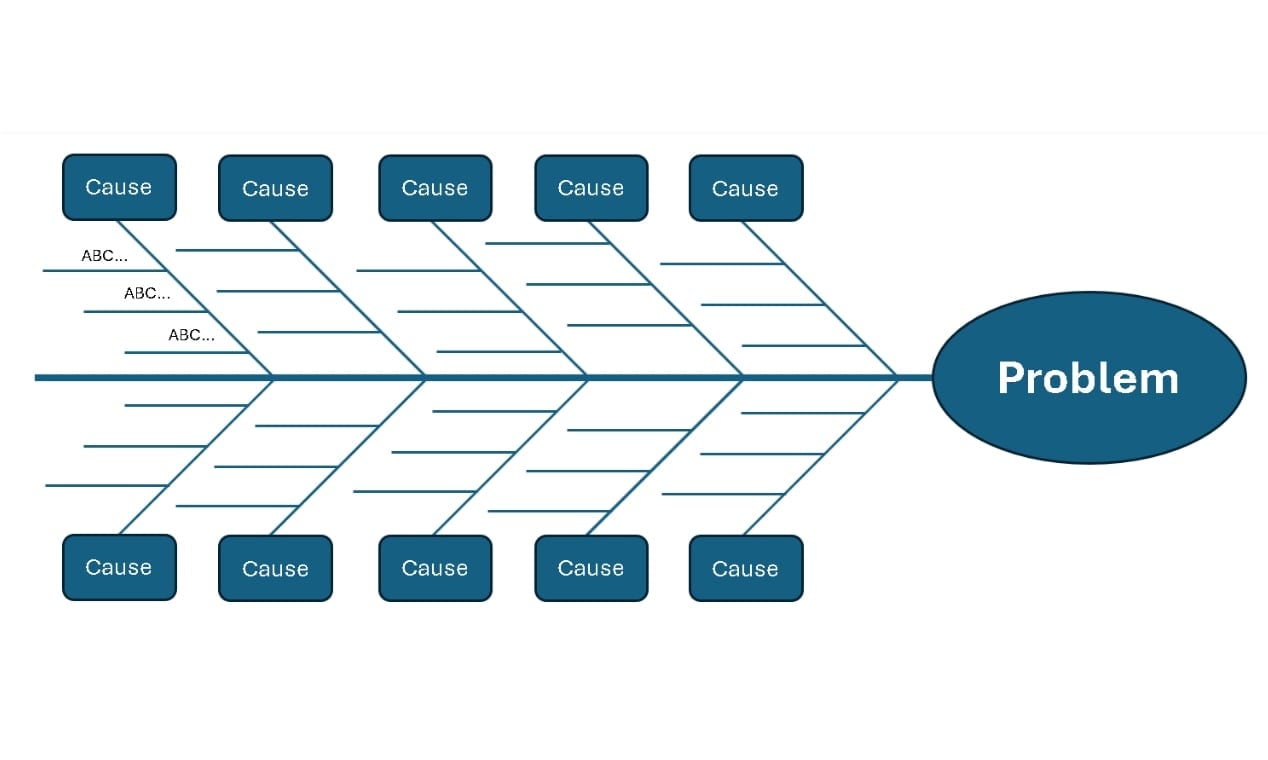
Step 4Add Sub-Causes (Secondary Bones)
Each primary category can include smaller branches listing specific contributing factors.
- Use Insert > Shapes > Line to draw diagonal sub-branches.
- Keep angles consistent for a structured appearance.
- Place your text boxes beside each sub-cause and type relevant details.
Step 5Format and Final Adjustments
Refine the layout for a clear and professional diagram.
Apply different colors to highlight key causes. Select a shape and change the Shape Style from the Shape Format tab.
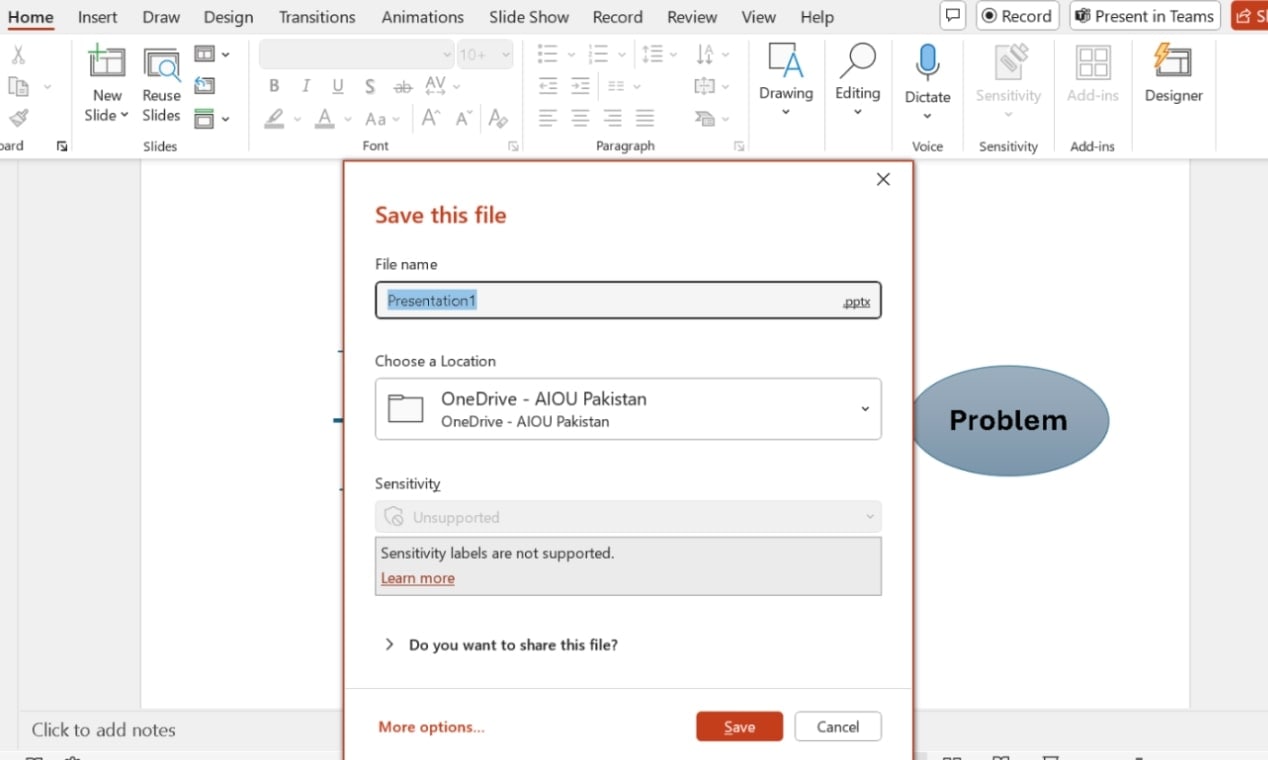
Step 6Save Your Diagram
Save your work for future use.
After finalizing, review everything once before saving the presentation.
Tap CTRL+S to save your presentation. Before hitting the Save button, remember to rename the file and choose the required location.
Method 2: How to Make and Add a Fishbone Diagram in PowerPoint
PowerPoint offers basic shape tools, but manual formatting takes time. EdrawMax Fishbone Diagram Maker simplifies the entire process.
Instead of manually fixing alignments, I could create a professional-looking fishbone diagram in minutes. Let's see how.
Steps to Create a Fishbone Diagram in EdrawMax
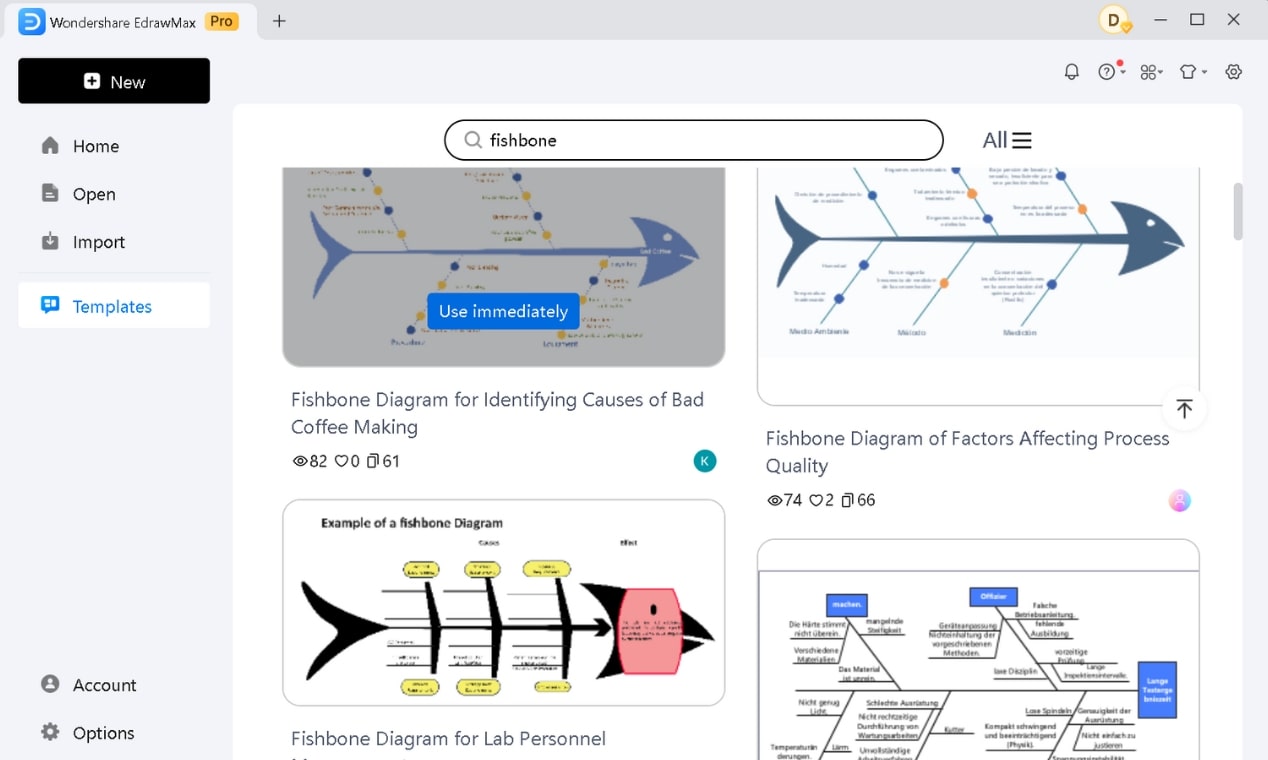
Step 1Open EdrawMax & Choose a Fishbone Template
- Go to the Templates section on your EdrawMax home screen and type Fishbone in the search bar.
- Select a template that fits your needs (basic or industry-specific) and tap Use immediately.
- The template, ready for editing, loads onto the canvas.
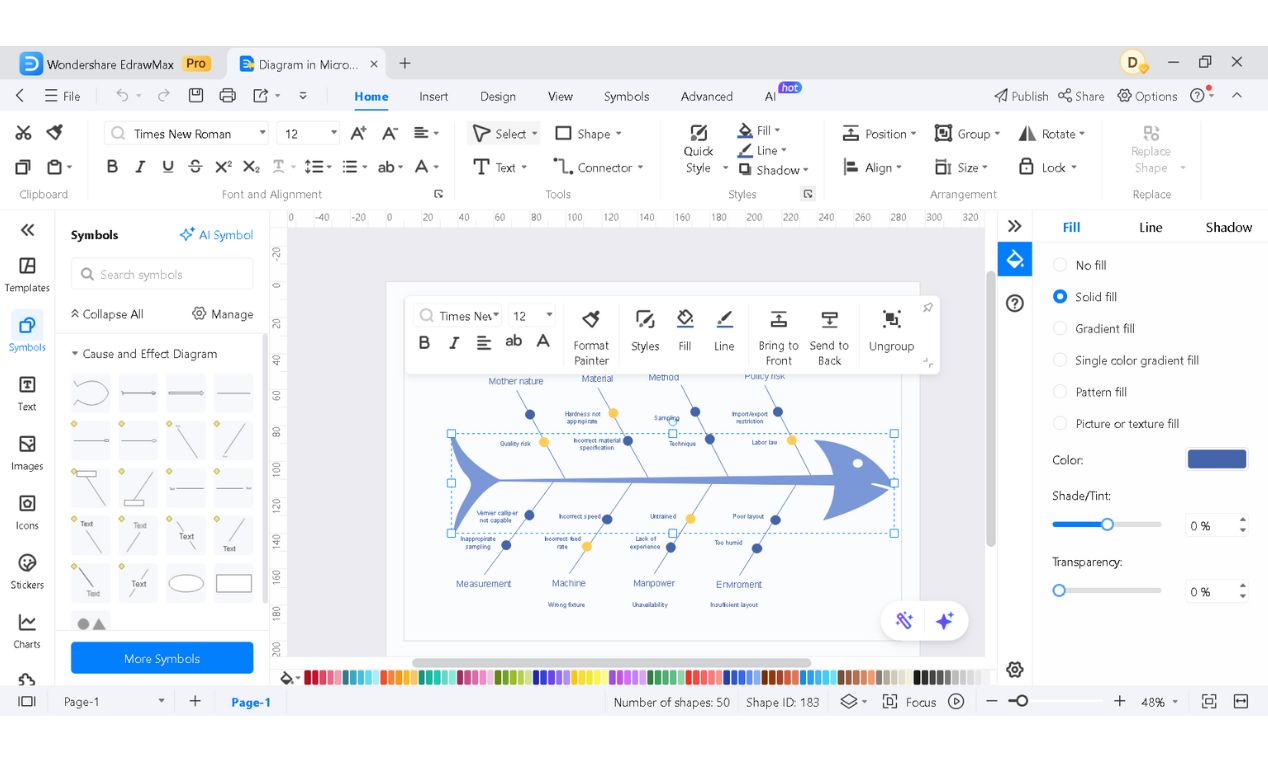
Step 2Edit and Personalize the Diagram
Now, shape the diagram to match your analysis:
- Double-click the diagram’s head and rename it.
- Rename or remove categories and subcategories based on your needs.
- Modify the text format, style, size, color, and more from the pop-up menu. Adjust the font size for key labels and bold or highlight critical points if required.
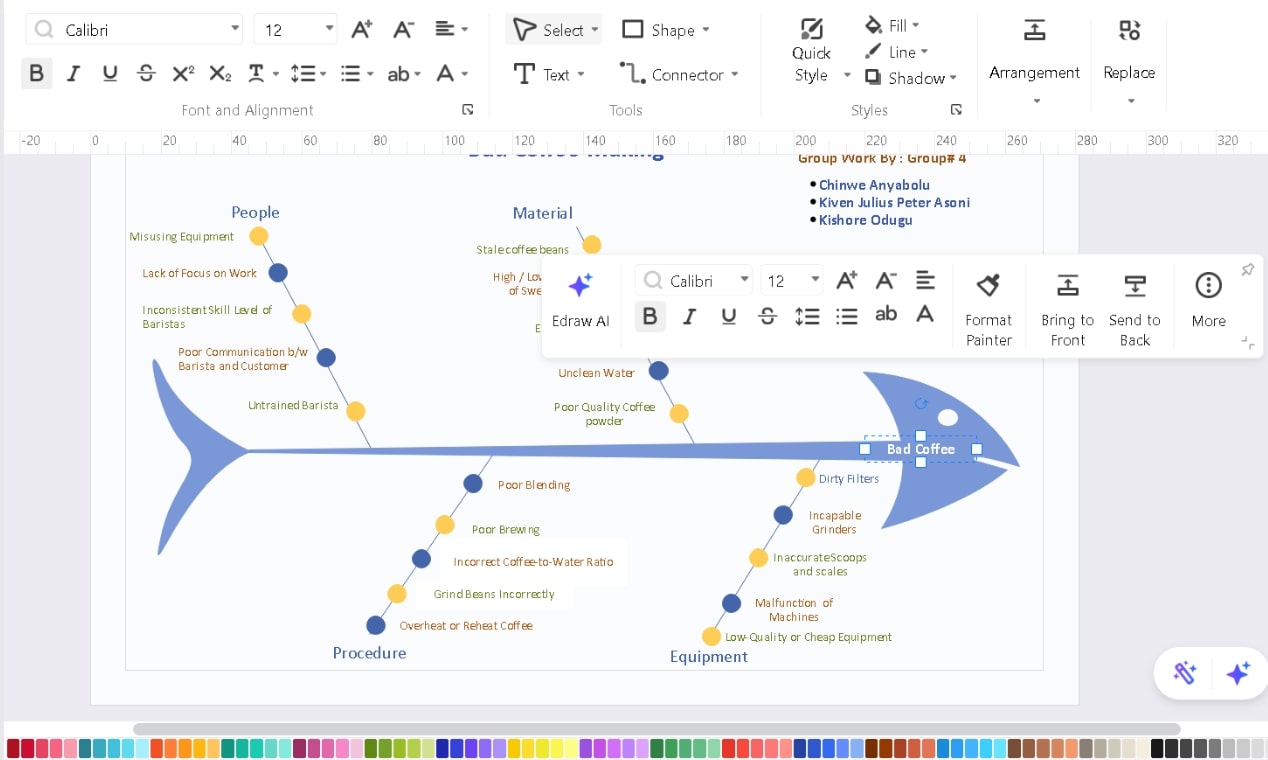
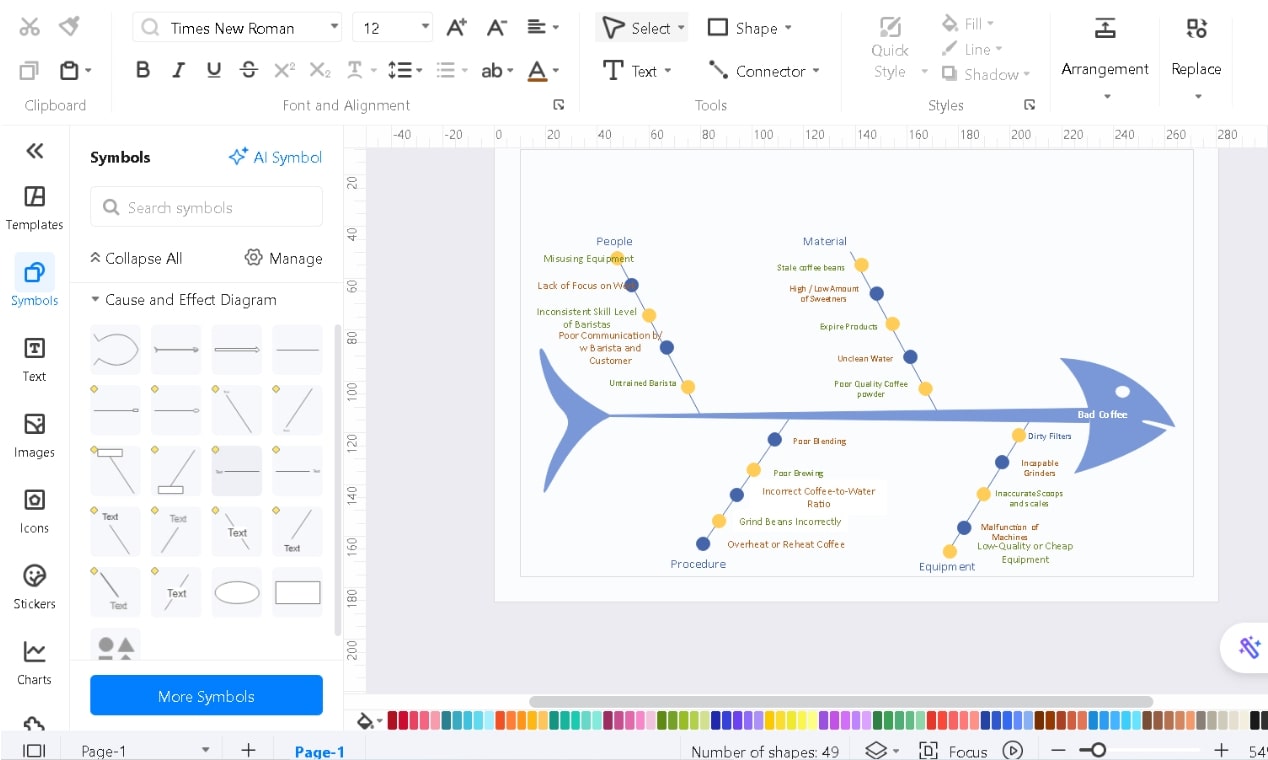
Step 3Make It Visually Clear
A well-organized diagram improves readability.
- Pick a professional color scheme that matches your PowerPoint slides. For quick customization, try the instant Style Change button at the bottom right.
- Explore the left-side library of symbols, icons, stickers, etc., to add relevant visuals and clarify complex ideas.
- Use drag and drop with auto-adjustment features for a professional layout.
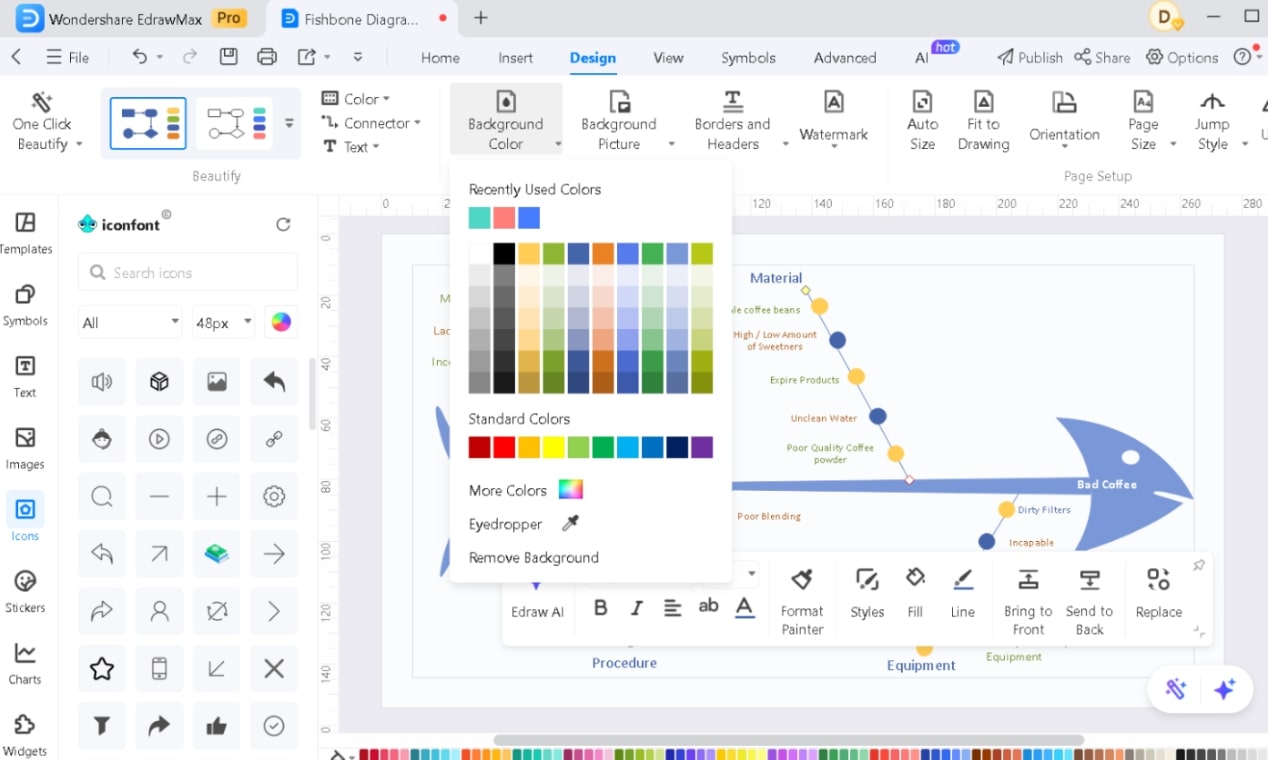
Explore other features in the Insert, Design, View, and Symbols tabs for enhanced customization. For instance, customize the Background Colors from the Design tab.
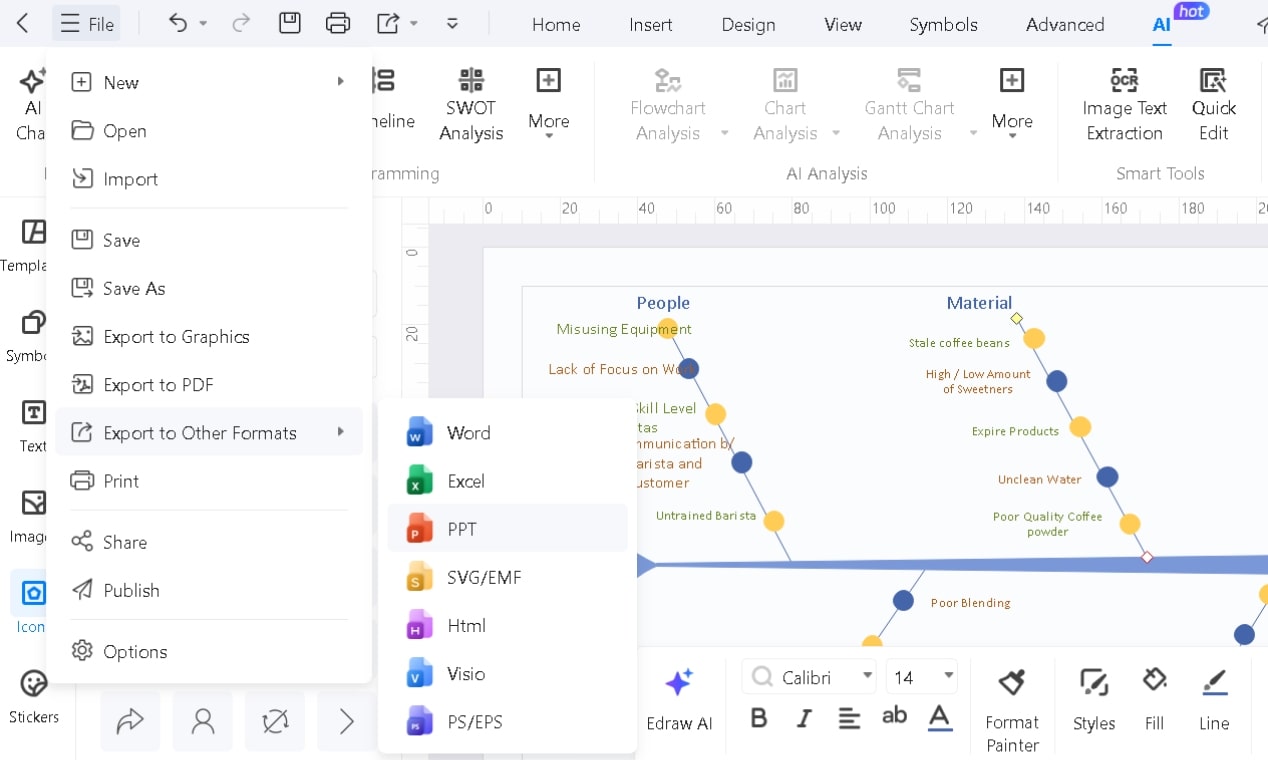
Step 4Export the Diagram from EdrawMax to PowerPoint
After finalizing, go to File > Export to Other Formats > PPT and save the file. It ensures that all elements remain editable in PowerPoint.
After you export the file, it’ll automatically open in PowerPoint. If it doesn’t, you can manually open the downloaded file in PowerPoint.
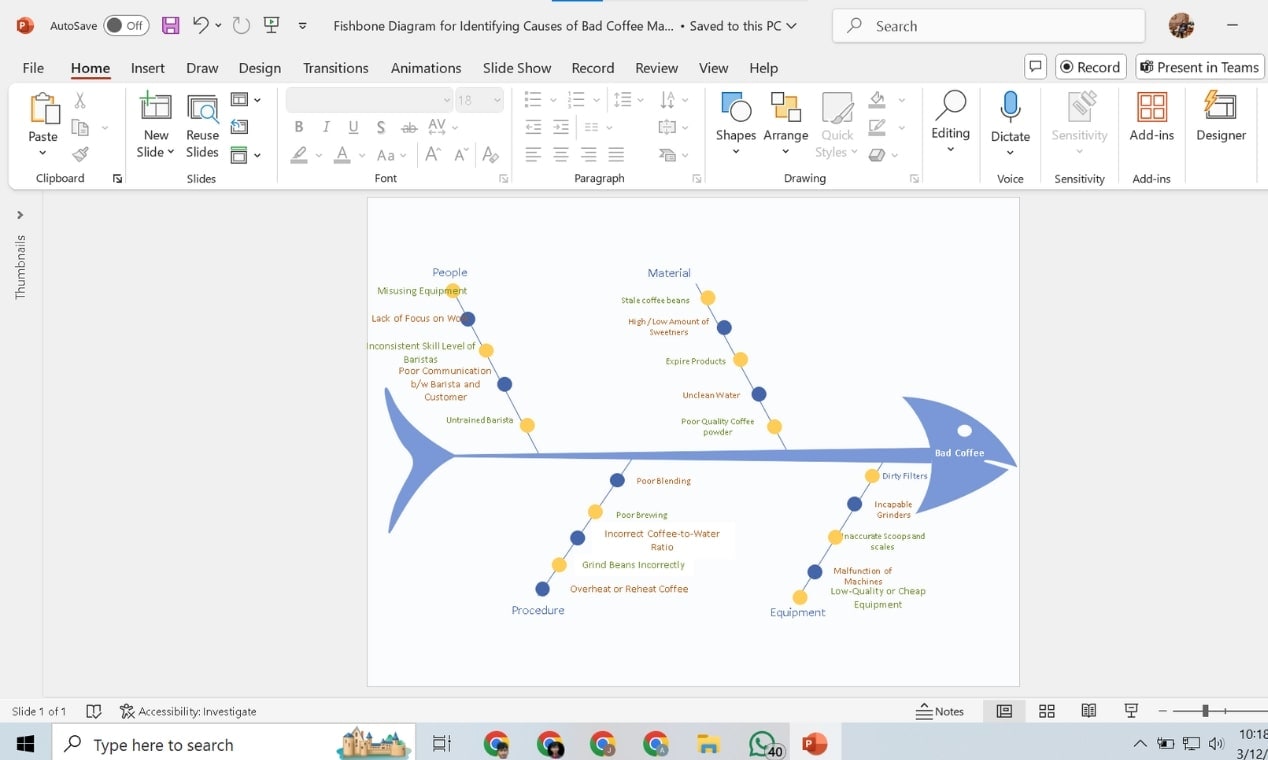
You can customize it in PowerPoint (as described in the previous method) based on your needs.
Done? Look, it’s that easy.
Method 3: Make Fishbone Diagrams in PowerPoint with An Add-in
PowerPoint is built for presentations, but is it built for manually creating diagrams in it? That’s another story.
As a beginner, you spend way too much time editing and refining, only to end up with a less-than-perfect result.
That’s where the EdrawMax Add-in for PowerPoint makes a real difference.
Step 1Install & Activate the EdrawMax Add-in
First, ensure you have the latest version of EdrawMax Windows installed. The add-in automatically appears in PowerPoint’s top menu bar after installation.
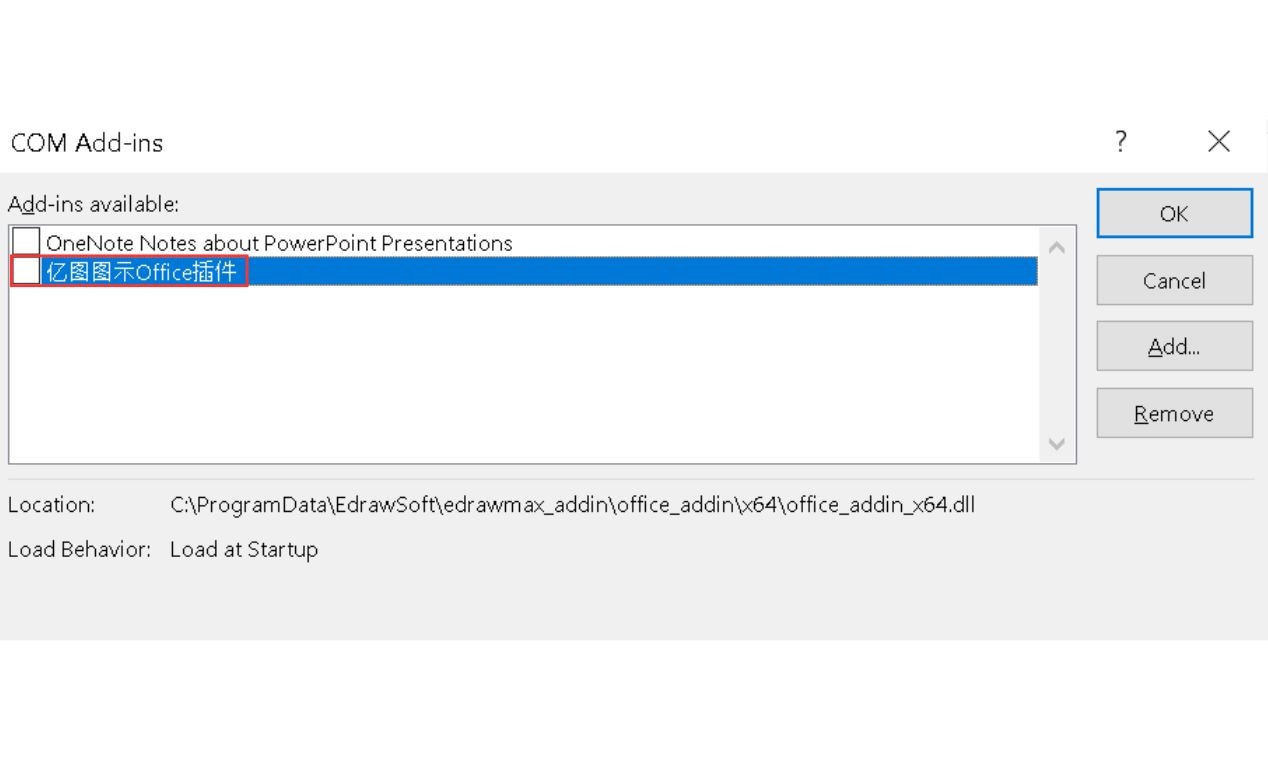
If not, follow this: File > Options > Add-ins > Manage > COM Add-ins > Go.
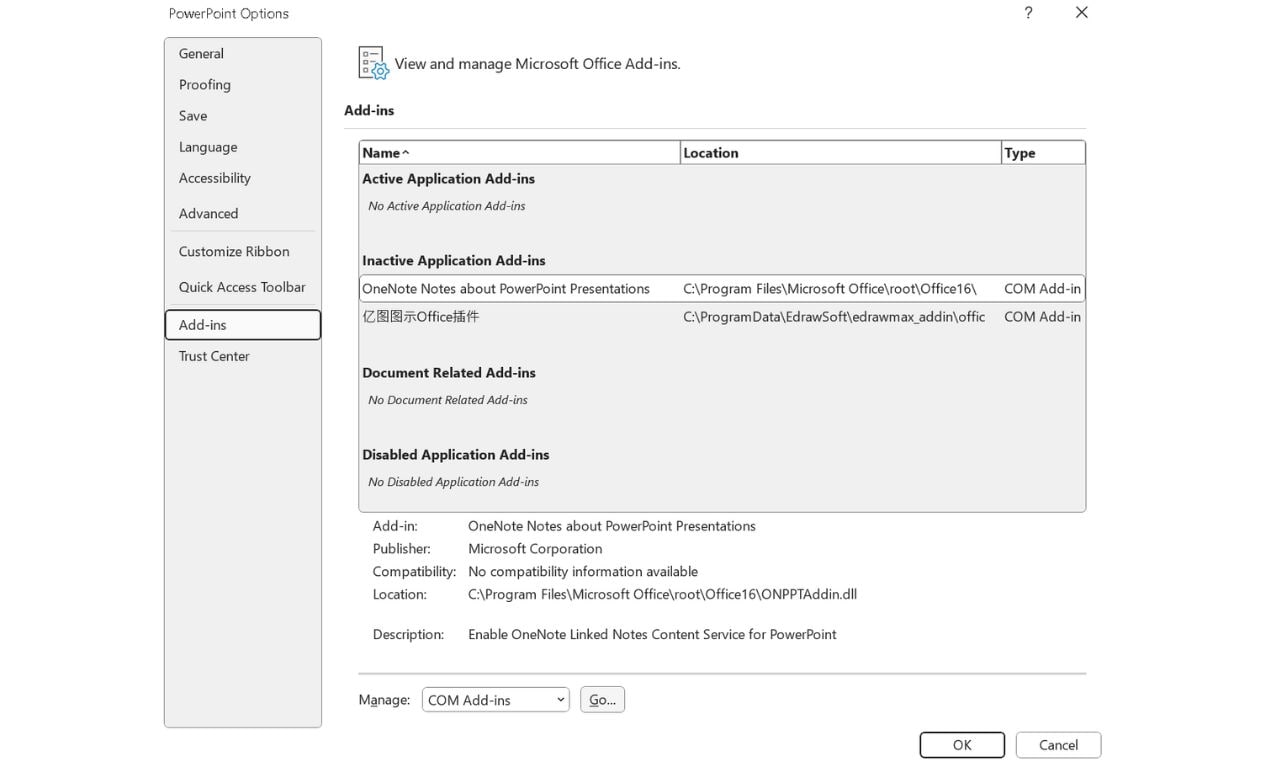
Enable the EdrawMax Office Add-in, click OK, and restart PowerPoint.
Step 2Use AI Text-to-Slide for Instant Diagrams
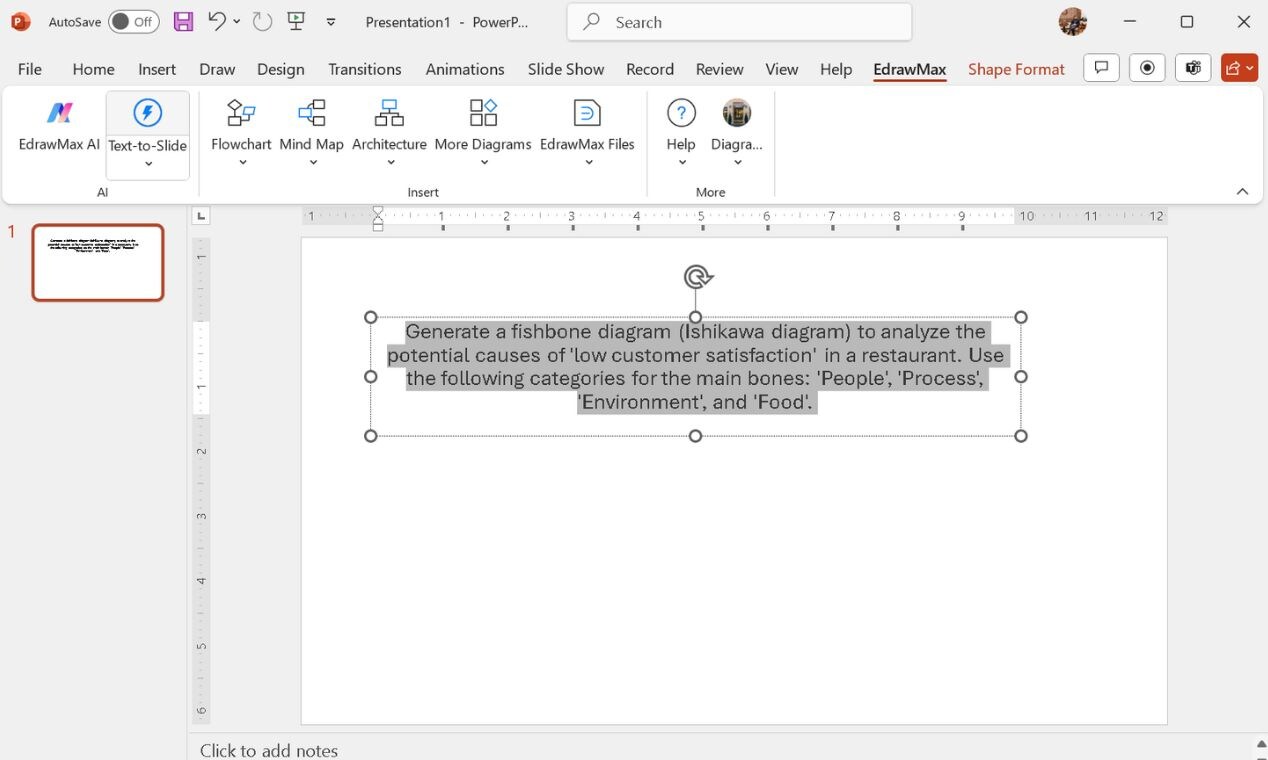
Select any text in your PowerPoint slide, click Text-to-Slide under the EdrawMax tab, and watch the AI convert plain text into structured diagrams.
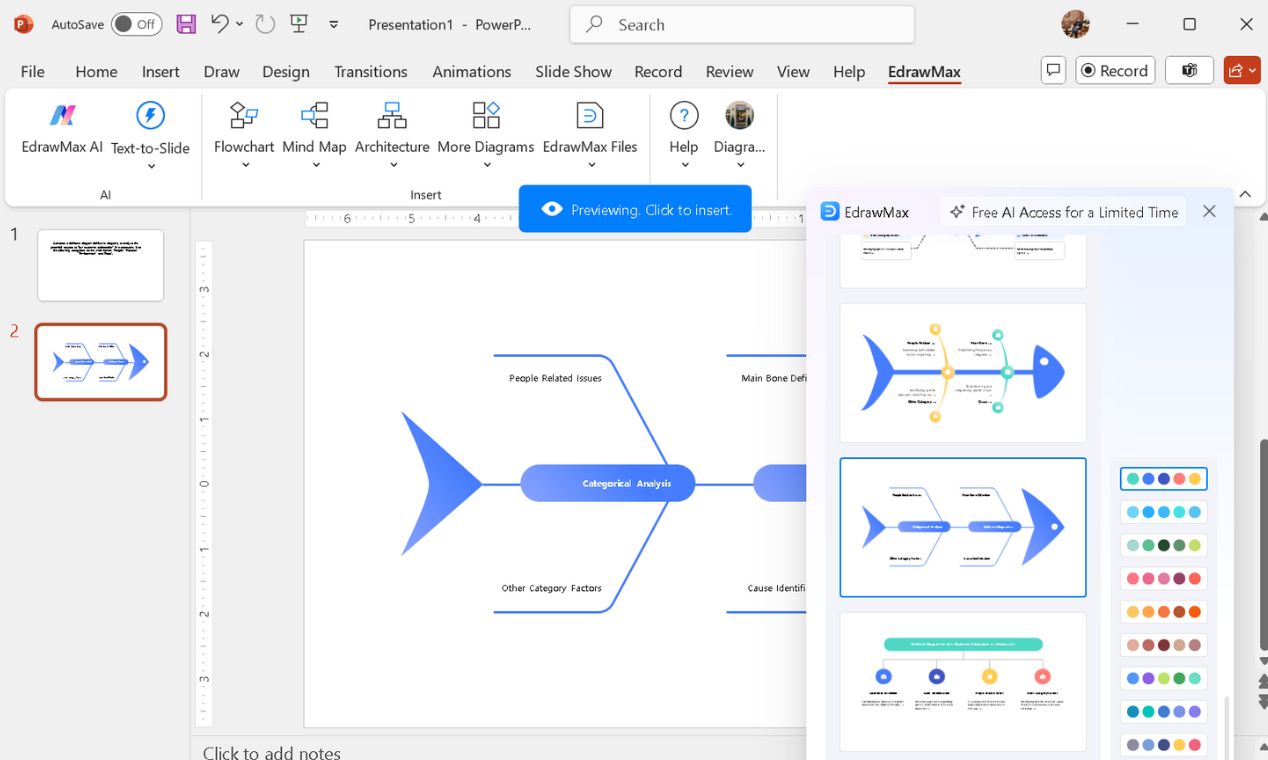
From the multiple AI-generated diagrams, you can insert whichever you prefer.
With instant color options, you can easily customize the look.
You can customize the content and design easily with PowerPoint editing features.
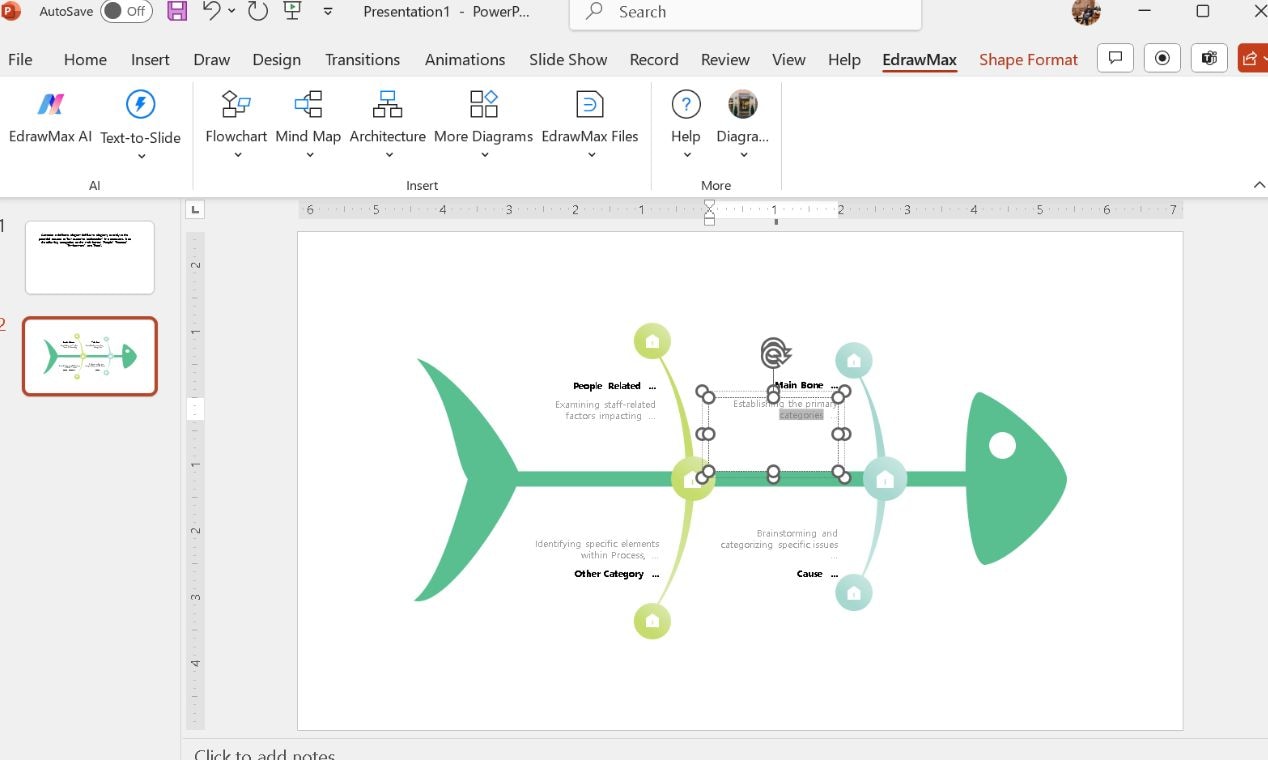
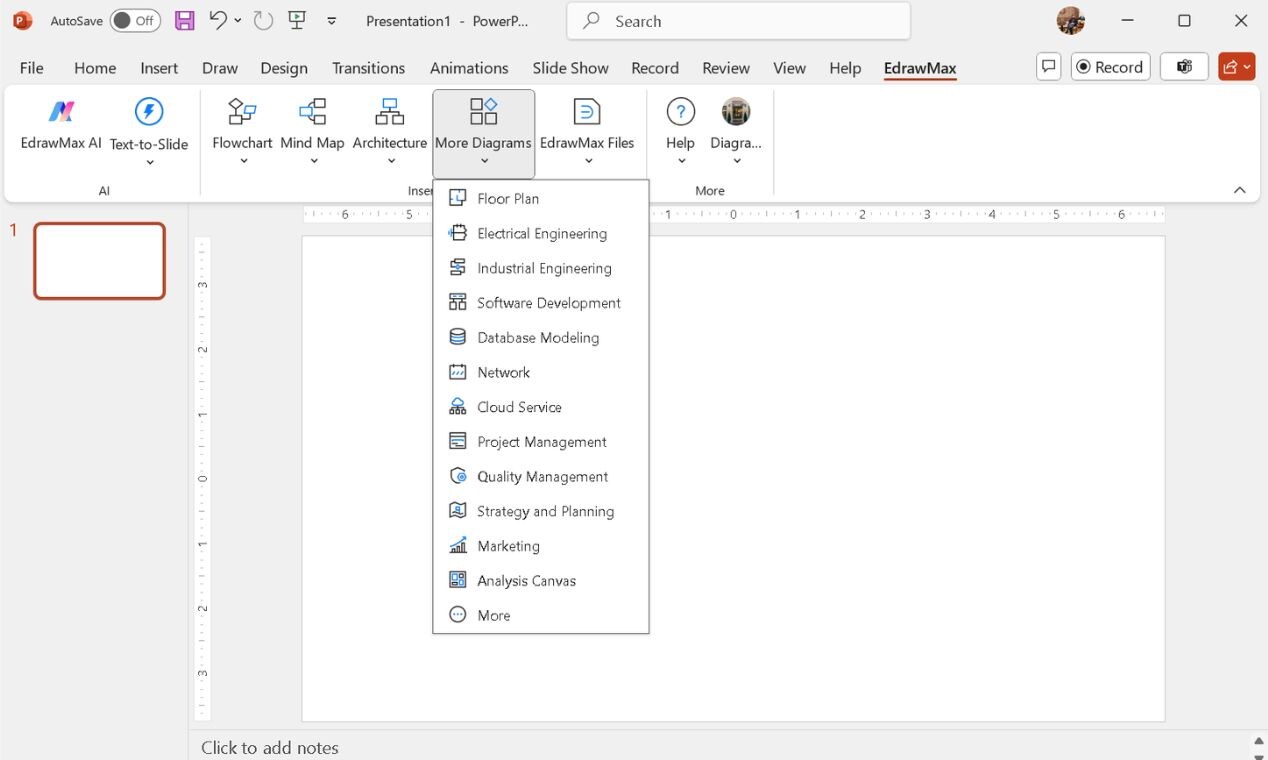
Step 3Insert and Customize Diagrams
Need a fishbone diagram, flowchart, or mind map template? Click EdrawMax and then the required diagram type, like Mind Map or More Diagrams.
Choose and click a template or search for anything specific you need.
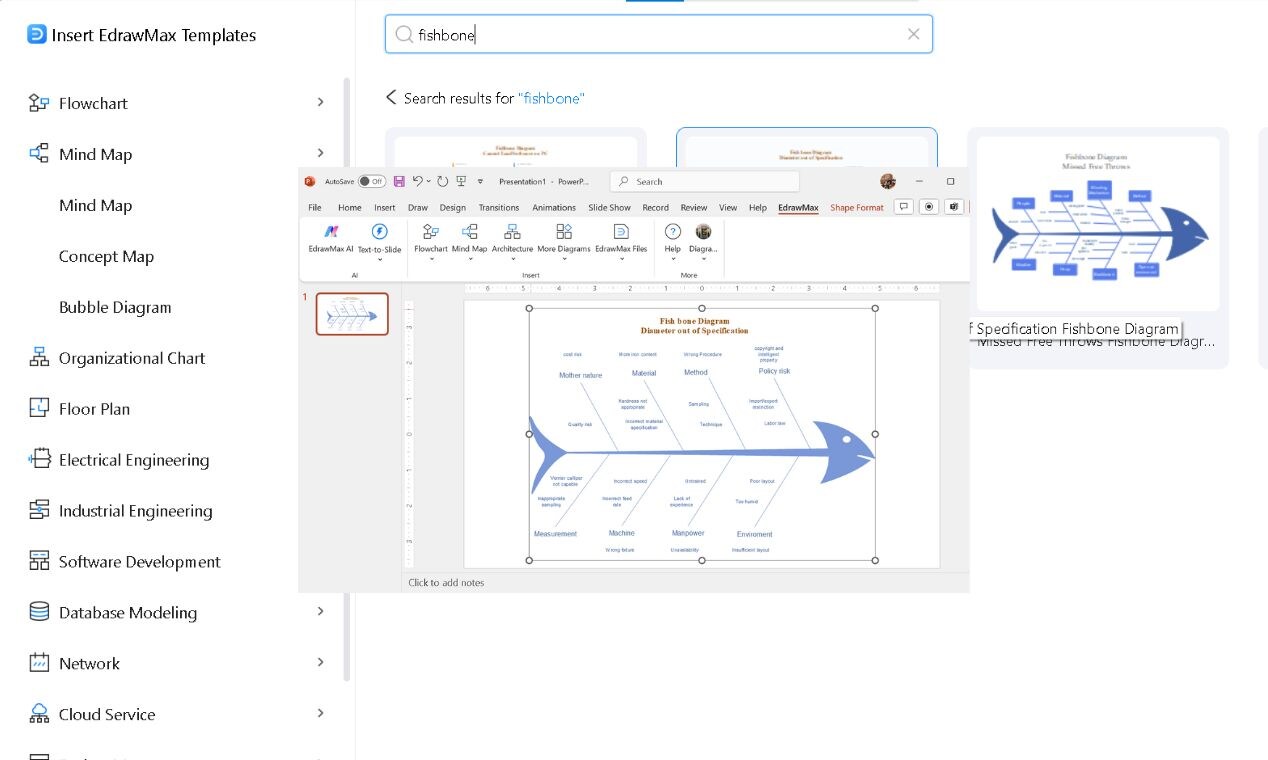
Click the required template to drop it directly into your PowerPoint.
Use a simple drag-and-drop feature to replace it where you need it.
Drag from the edges to resize it as you need.
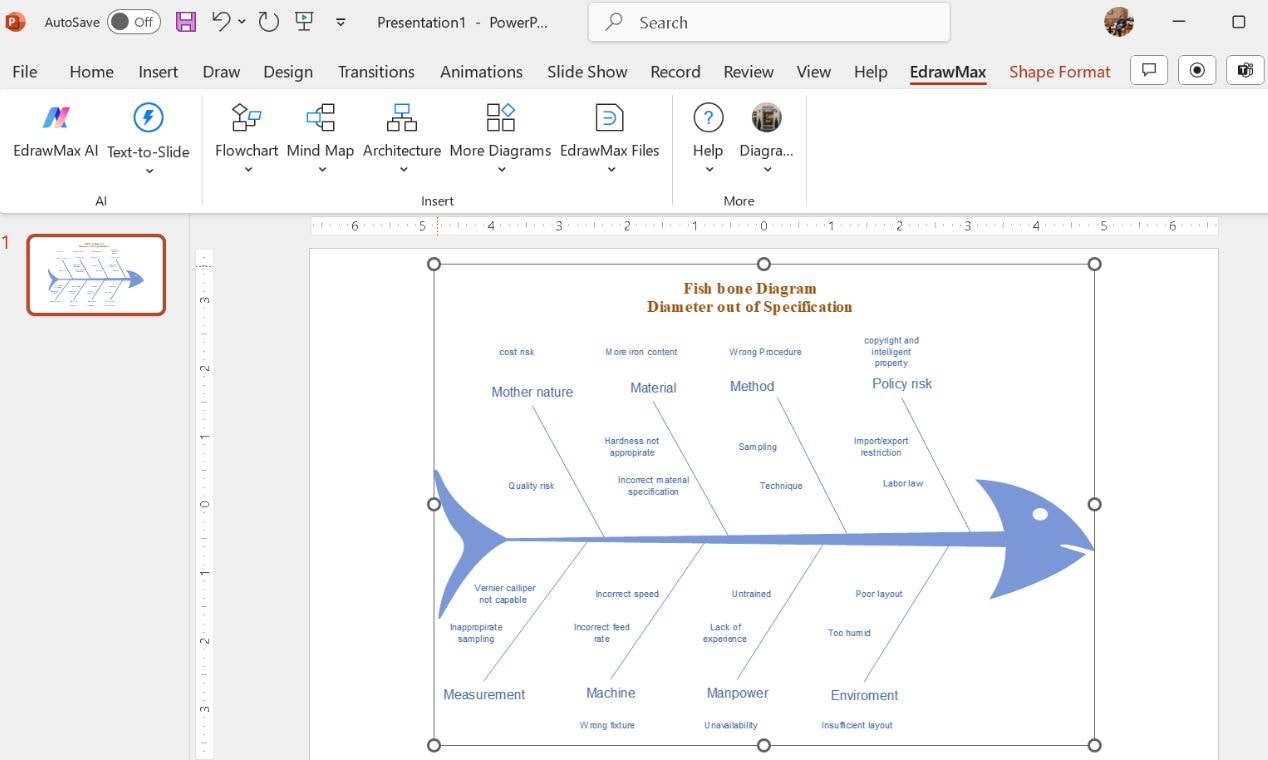
Double-click the inserted diagram to open it in EdrawMax and edit the structure, colors, or text.
Step 4Export & Share with One Click
Once your diagram is ready, close the EdrawMax window, and it will automatically update in PowerPoint.
Adjust in PowerPoint if needed, and then download or export it in the required format easily, as described in the first method.
The best part? Unlike manually created diagrams, all elements remain fully editable, meaning you can tweak them later without starting over.
Why EdrawMax Outperforms PowerPoint
EdrawMax removes the tedious formatting steps, letting me focus on analysis. Everything stays structured with built-in templates, a rich symbol library, and an easy drag-and-drop interface.
| Feature | PowerPoint | EdrawMax |
| Diagramming Features | Limited | Advanced |
| Drag-and-Drop Editing | Limited | Advanced |
| Pre-Made Symbols & Icons | Limited | 26,000+ symbols |
| Built-in Templates | Very limited | Over 15k templates |
| Smart Formatting Tools | No | Advanced |
| Color Theme Customization | Limited | Advanced (Plus, Instant style options) |
| Multi-Format Export | Limited | Diverse options |
| Background Customization | Limited | Advanced design tools |
| Customizable Line Styles | Limited | Advanced with more flexibility |
Now that we’ve covered how to build a Fishbone diagram, let's look at ways to make them truly effective.
Best Practices for Creating a Fishbone Diagram
Over the years, I've made plenty of fishbone diagrams—some worked well, and others led nowhere. I've realized that how you build and use them matters as much as the content itself. Here's what I always keep in mind:
- Define a precise problem statement – A vague issue leads to scattered causes. Instead of "Low productivity," try "Frequent delays in project deadlines."
- Stick to primary causes – Avoid listing every minor factor—group related issues into broader categories for clarity.
- Use color coding strategically – Assign colors to different cause categories (e.g., blue for process issues, and red for staffing problems) to improve quick analysis.
- Limit text per branch – Short phrases work best (“Slow software” vs “Software response time is too slow”).
- Refine as you analyze – Your first draft isn’t final. As you uncover more insights, adjust your diagram to reflect new findings.
Pro Tip: A well-organized fishbone diagram transforms complexity into clarity. It helps teams take decisive action faster!
Conclusion
PowerPoint lets you manually build a fishbone diagram, but it's not fast and efficient. Arranging elements and fine-tuning the layout can slow you down.
EdrawMax add-in eliminates those extra steps, offering instant templates and precise alignment. With minimal effort, you get clean, professional results.
So, speed up your workflow today—test EdrawMax for free and build professional Fishbone diagrams effortlessly!
AI Diagram Generator
Enter your prompt. Upload files if needed. Generate diagrams, charts, or slides instantly.


