


Although the Abstract Syntax Tree is considered a better coding alternative for its concise description, it may not deliver as well in generating visuals. Using complex hierarchical structures of ASTs would only mess up the data structures in the diagrams.
Therefore, programmers prefer converting this syntax into Graphviz DOT language for diagram generation. It offers better clarity and organization for code analysis and optimization. Here is how you can do the same to generate diagrams from AST using Graphviz.
In this article
How to Generate Diagrams from AST Using Graphviz?
Turning your AST descriptions into visuals helps you better understand the syntax and its hierarchical structures. Let’s see how you can generate diagrams from AST using Graphviz.
Step 01: Write an AST for Your Diagram
Start by writing the AST of your source code. For instance, in this tutorial, let’s write an AST for a flowchart of a product launch.
Program
└── Flowchart
├── StartNode ("Start Product Launch")
├── ProcessNode ("Define Product Vision")
├── DecisionNode ("Market Research Complete?")
│  ├── YesEdge
│  │  └── ProcessNode ("Analyze Competitors")
│  └── NoEdge
│    └── ProcessNode ("Conduct Market Research")
├── ProcessNode ("Develop Prototype")
├── DecisionNode ("Prototype Approved?")
│  ├── YesEdge
│  │  └── ProcessNode ("Begin Production")
│  └── NoEdge
│    └── ProcessNode ("Revise Prototype")
├── ProcessNode ("Create Marketing Plan")
├── ParallelNode
│  ├── ProcessNode ("Manufacture Product")
│  └── ProcessNode ("Run Marketing Campaign")
├── DecisionNode ("Ready to Launch?")
│  ├── YesEdge
│  │  └── ProcessNode ("Launch Product")
│  └── NoEdge
│    └── ProcessNode ("Address Issues")
├── ProcessNode ("Monitor Sales & Feedback")
├── DecisionNode ("Successful Launch?")
│  ├── YesEdge
│  │  └── ProcessNode ("Plan Next Phase")
│  └── NoEdge
│    └── ProcessNode ("Analyze Problems")
└── EndNode ("End")
Step 02: Represent the AST in DOT Language
Now, you can convert this Abstract Syntax Tree into DOT language to visualize it in Graphviz. In this language, each AST node becomes a DOT graph node with a unique ID, describing the node type. Here is what it looks like.
digraph ProductLaunchFlowchart {
// Graph attributes
rankdir=TB; // Top to Bottom layout
node [shape=rectangle, style=rounded, fontname=Arial];
edge [fontname=Arial];

// Decision node style
node [shape=diamond];
"Market Research Complete?" "Prototype Approved?" "Ready to Launch?" "Successful Launch?";

// Reset to default rectangle
node [shape=rectangle];

// Nodes and edges
"Start Product Launch" -> "Define Product Vision";
"Define Product Vision" -> "Market Research Complete?";

// Market Research branch
"Market Research Complete?" -> "Analyze Competitors" [label="Yes"];
"Market Research Complete?" -> "Conduct Market Research" [label="No"];
"Conduct Market Research" -> "Market Research Complete?";
"Analyze Competitors" -> "Develop Prototype";

// Prototype branch
"Develop Prototype" -> "Prototype Approved?";
"Prototype Approved?" -> "Begin Production" [label="Yes"];
"Prototype Approved?" -> "Revise Prototype" [label="No"];
"Revise Prototype" -> "Prototype Approved?";

// Production and Marketing
"Begin Production" -> "Create Marketing Plan";
"Create Marketing Plan" -> "Manufacture Product";
"Create Marketing Plan" -> "Run Marketing Campaign";

// Parallel processes (use rank to align)
{ rank=same; "Manufacture Product"; "Run Marketing Campaign"; }

// Launch preparation
"Manufacture Product" -> "Ready to Launch?";
"Run Marketing Campaign" -> "Ready to Launch?";

// Launch decision
"Ready to Launch?" -> "Launch Product" [label="Yes"];
"Ready to Launch?" -> "Address Issues" [label="No"];
"Address Issues" -> "Ready to Launch?";

// Post-launch
"Launch Product" -> "Monitor Sales & Feedback";
"Monitor Sales & Feedback" -> "Successful Launch?";
"Successful Launch?" -> "Plan Next Phase" [label="Yes"];
"Successful Launch?" -> "Analyze Problems" [label="No"];
"Analyze Problems" -> "Monitor Sales & Feedback";
"Plan Next Phase" -> "End";

// Start and End nodes
node [shape=ellipse];
"Start Product Launch";
"End";
}
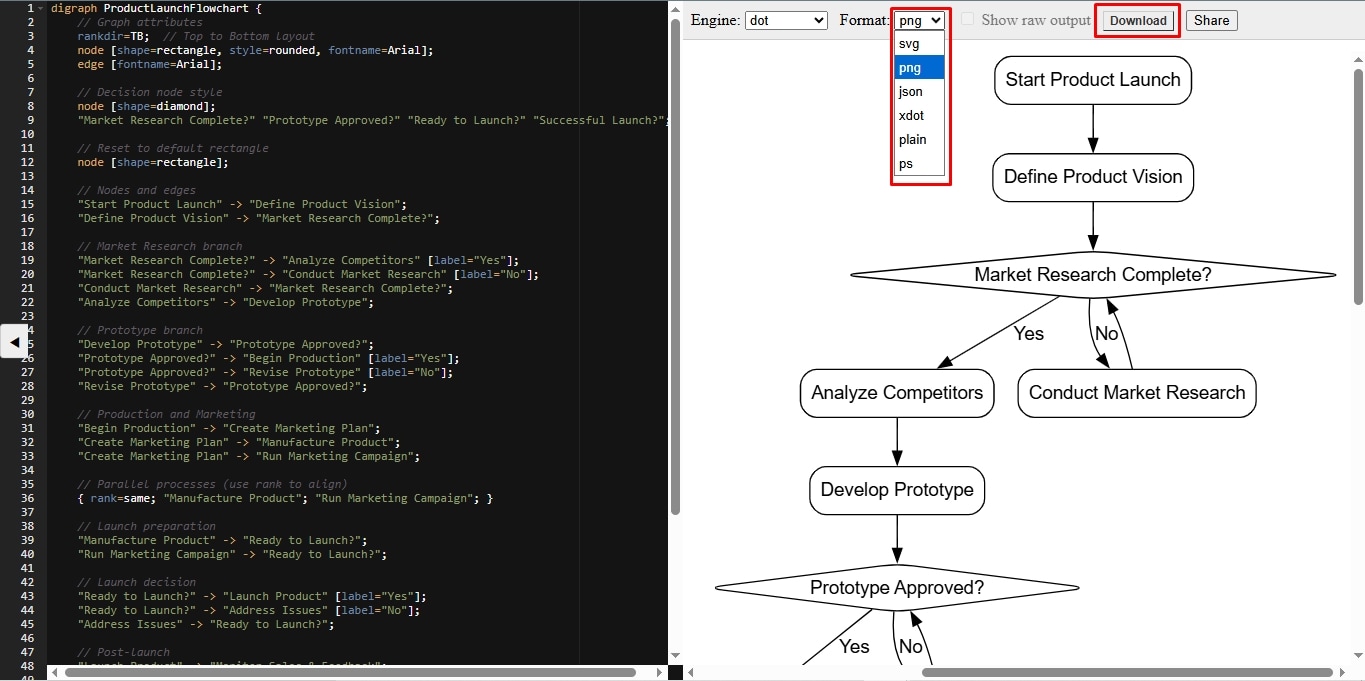
Step 03: Insert the DOT Code in Graphviz
Once you have the DOT description, open the Graphviz online editor from here. Paste your DOT description in the left side panel and see how it transforms into a visual.
// Default styles
node [fontname="Arial", fontsize=11, style=filled, fillcolor=white, color=gray50];
edge [fontname="Arial", fontsize=10, color=gray40];
// Node styles by type
StartEnd [shape=oval, fillcolor="#b3e6b3", style=filled];
Process [shape=box, style="rounded,filled", fillcolor="#cce5ff"];
Decision [shape=diamond, style="filled", fillcolor="#ffe6b3"];
Step 04: Download the Diagram
Finally, it’s time to download. Graphviz supports various formats, including SVG, PNG, PDF, etc. Select the format from the toolbar above and click Download.
How to Generate Diagrams Without Extensive Coding Using EdrawMax?
While easier than other coding alternatives, generating diagrams on Graphviz is not simple. It requires a fair understanding of DOT language, source coding, and even then, you will have issues regarding the order, hierarchy, and overall aesthetics. Instead, a non-coding alternative like EdrawMax might work better. It is an advanced diagramming solution with AI assistance and resourceful design tools. Let’s see how you can replicate a similar process flow using EdrawMax with minimal effort and no time.
Step 01: Access the AI Diagram Generator
Install the EdrawMax desktop version or try its online version.
Log in to your Wondershare account or register for an account. Once on the dashboard, visit the Edraw AI tab and choose your desired diagram. Let’s select Flowchart for this tutorial.
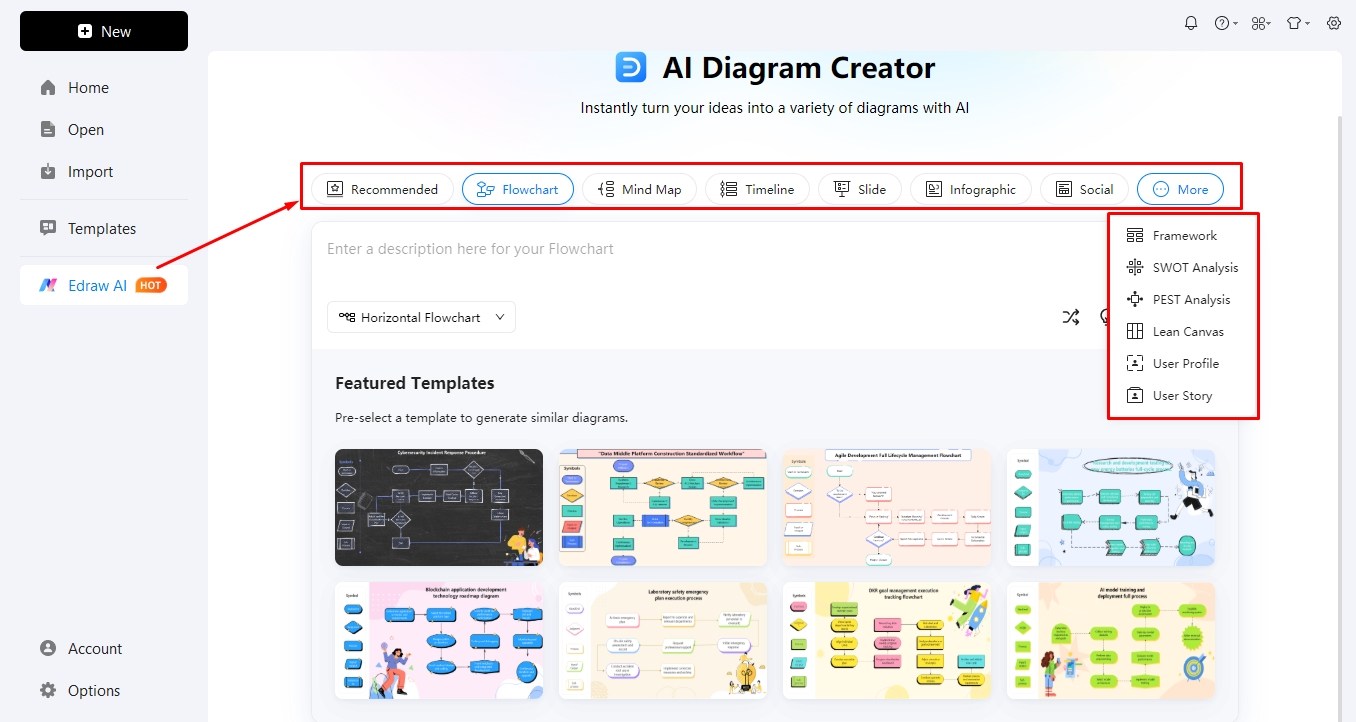
Step 02: Generate a Diagram
Begin by entering a command prompt in the search box. Always remember, a detailed prompt will give you an accurate deliverable. Use the Optimize Prompt button to further refine it.
Select whether it will be a horizontal or vertical flowchart.
You can also choose one of the given AI Templates to integrate in the outcome.
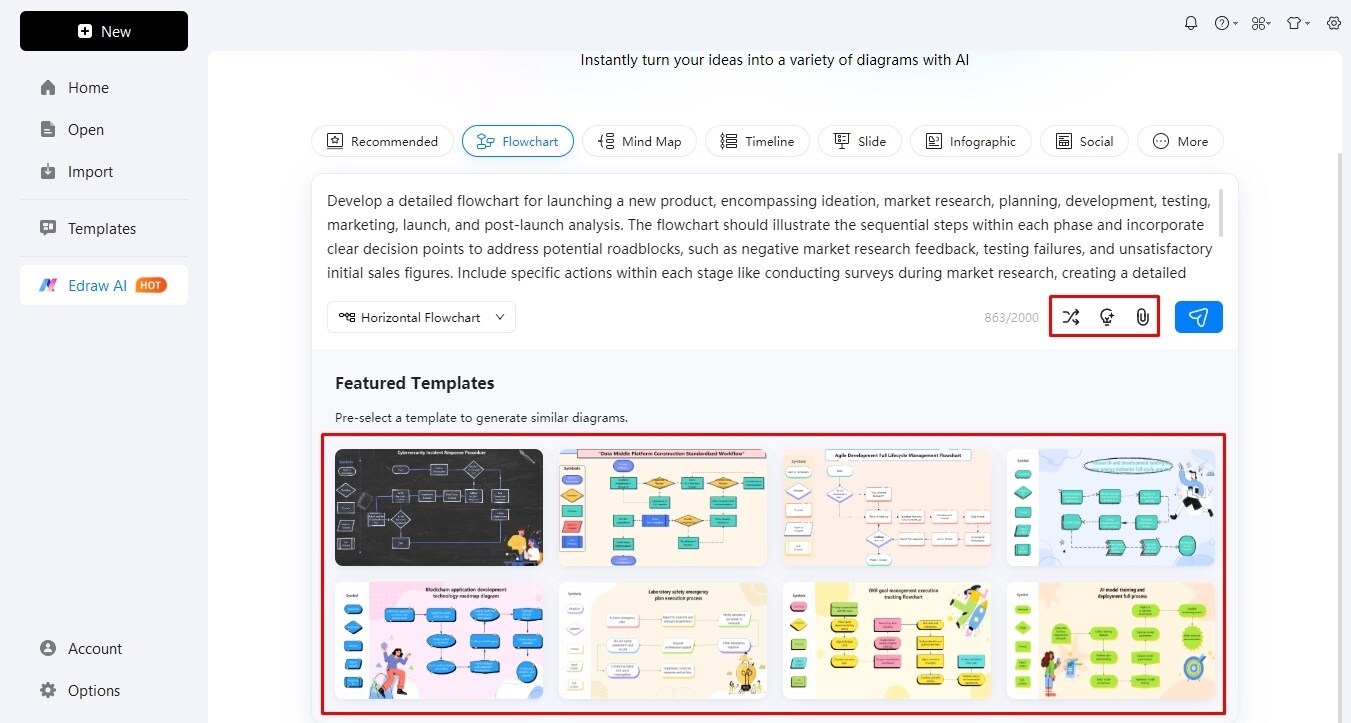
Step 03: Generate the Diagram
Click the Generate button and see how the AI generator converts your text into a detailed flowchart.
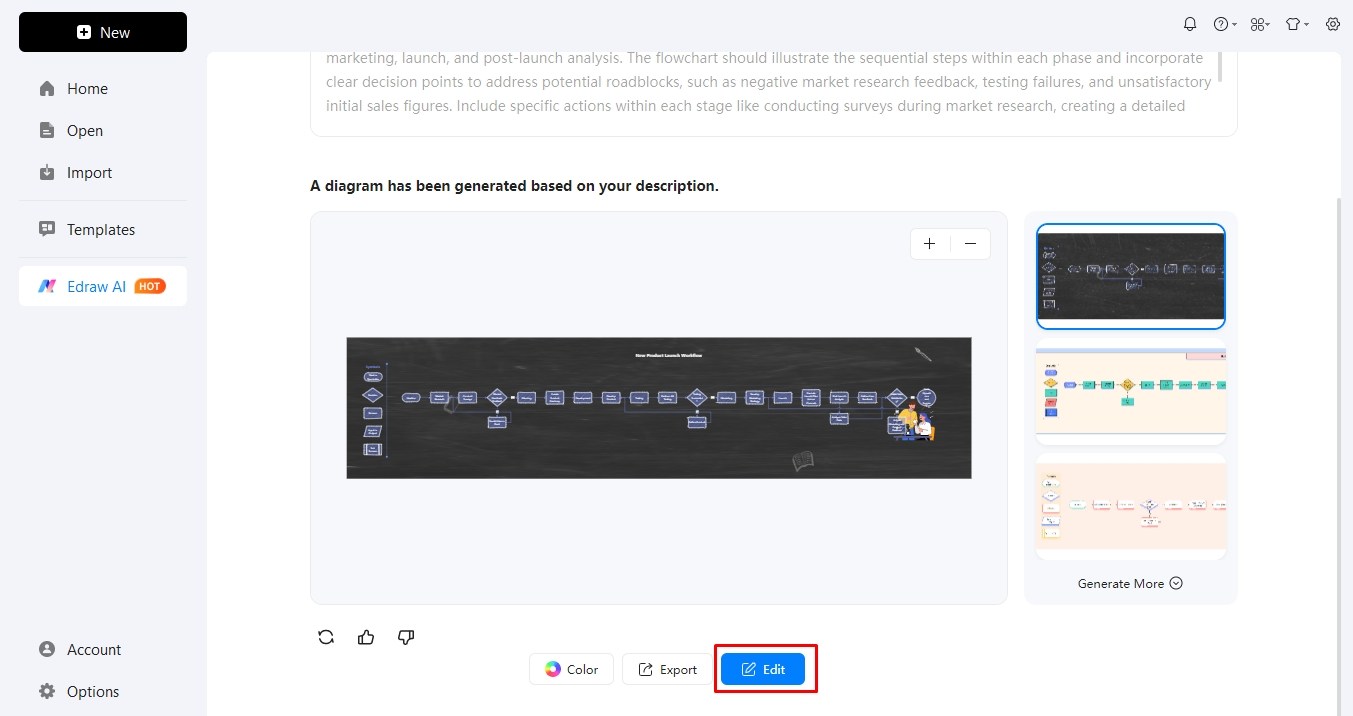
Step 04: Edit the Diagram in Canvas
You can always decide to change a few things in the generated diagram with EdrawMax. Click Edit below the generated diagram to enter the editing panel.
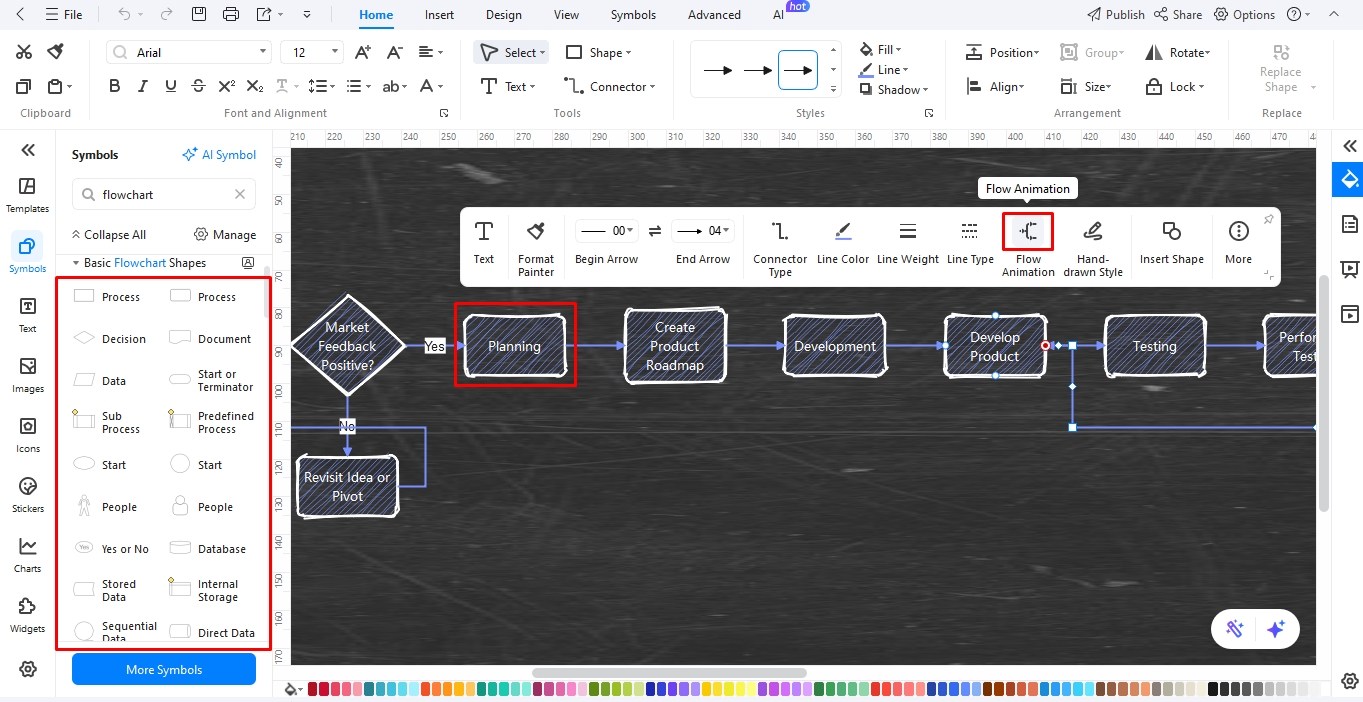
Visit the symbol library from the left side to add or replace shapes for steps. Moreover, double-click anywhere on the canvas and start typing for text labels.
Apply Flowchart Animations from the on-screen prompt to better visualize the process flow.
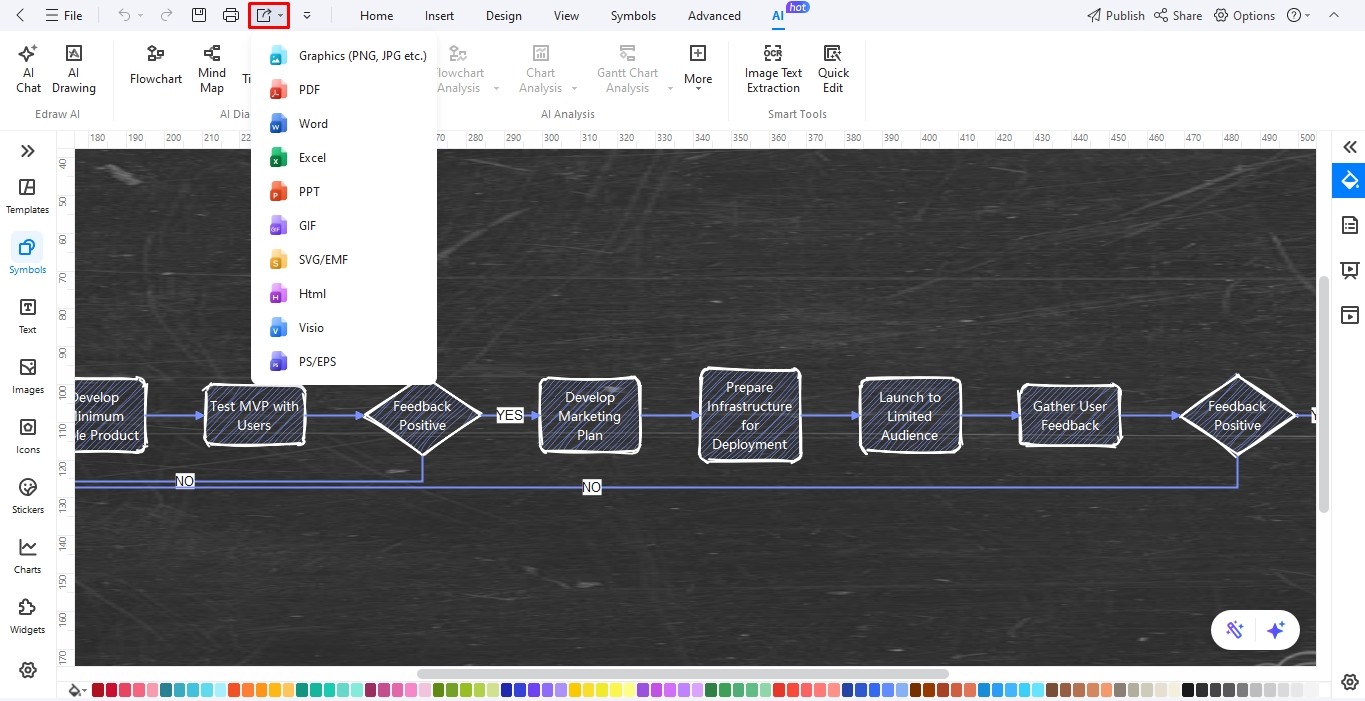
Step 05: Download the Diagram
Now, you can download this diagram. EdrawMax supports over ten formats, including Visio, MS Office, PDF, and Graphics. Click the Export icon from the quick-access toolbar and choose your desired format.
Final Thoughts
Most software engineers and data analysts use Graphviz to derive visuals from datasets. However, it is hard and suitable only for those already familiar with the DOT language and Graphviz attributes. Instead, an intuitive, drag-and-drop canvas like EdrawMax might work better for someone just stepping into the data visualization world. It has a free version. Give it a shot to see if it works for you.
AI Diagram Generator
Enter your prompt. Upload files if needed. Generate diagrams, charts, or slides instantly.


