


Designing diagrams for systems or hierarchies can be tedious if you’re doing it all manually. Graphviz offers a different approach. Just write out your structure in text, and it handles the layout for you. In this guide, I’ll show you how to make the most of it without much setup. I’ll also cover why some folks prefer EdrawMax when they’d rather click and drag than write code.
In this article
Graphviz: A Different Way to Diagram
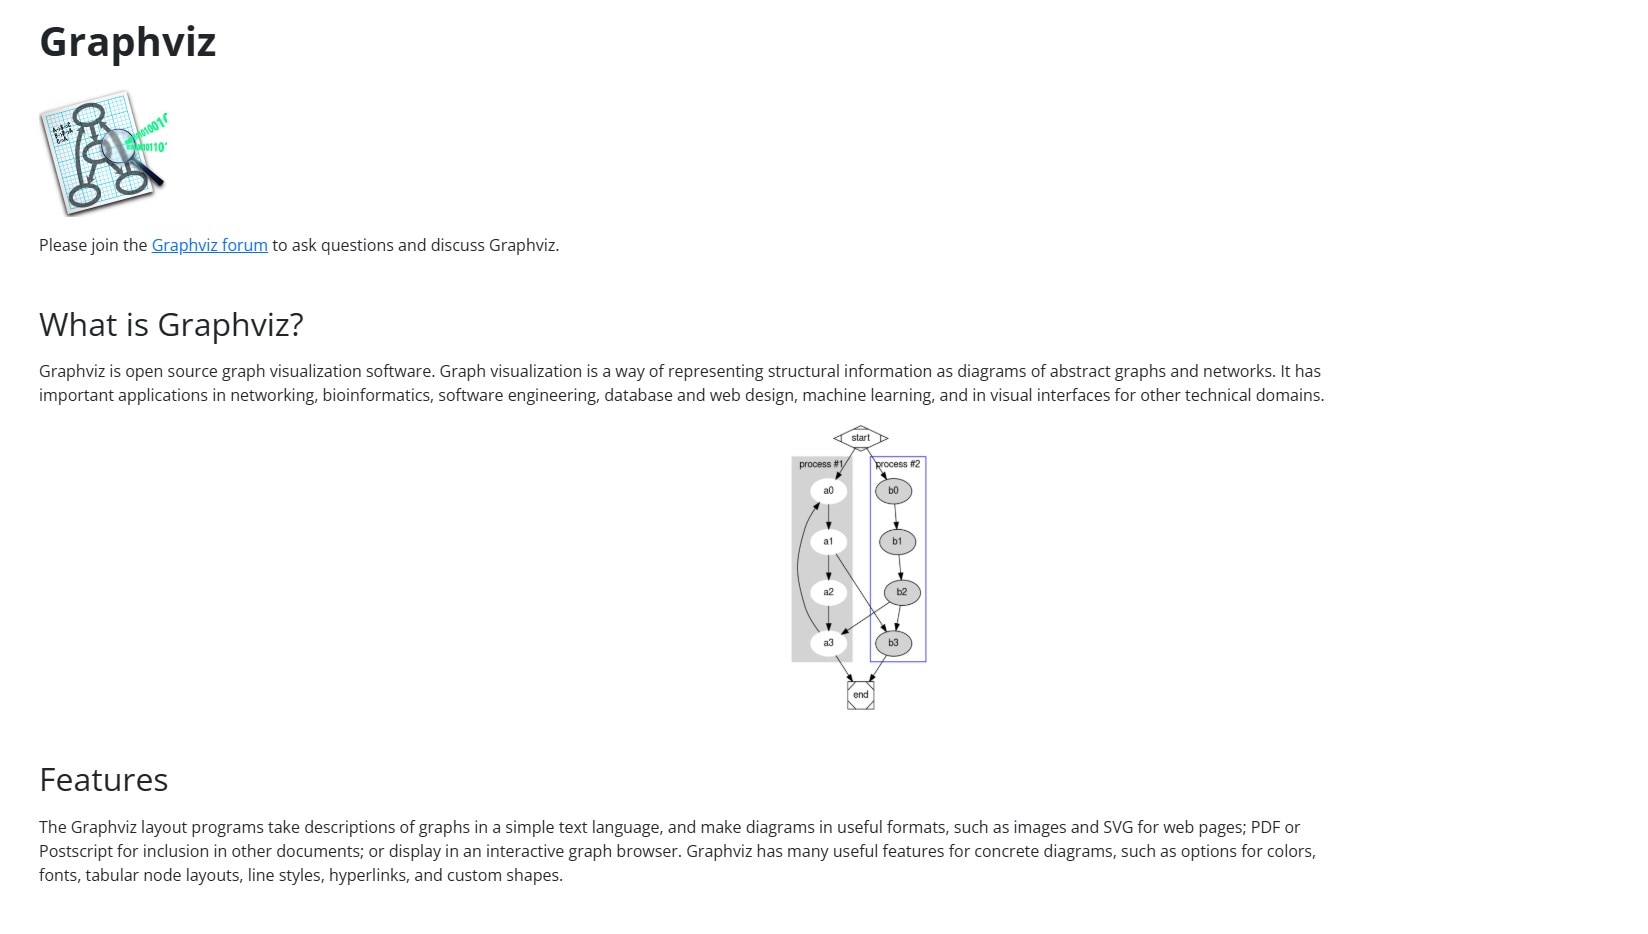
Graphviz is an open-source tool that lets you draw diagrams by writing simple code. You use a language called DOT to describe what you want, and Graphviz figures out the layout for you. I’ve used it when I needed quick, structured diagrams without spending time dragging shapes around. You write a text file, define the elements, and the tool builds a clean visual from that logic.
Why It’s a Go-to for Many Technical Folks
- You can update diagrams quickly just by editing the script.
- Every element can be reused, which keeps your work consistent.
- It works well with code, allowing you to generate diagrams automatically from data.
Common Use Cases
- Flowcharts
- File trees or decision trees
- Software dependencies
- Network layouts
- Data structure visuals
For people used to working in code, Graphviz saves a lot of time. You stay focused on what matters, logic, not layout. Diagrams can be generated on the fly.
How to Create a Diagram with Code Using Graphviz?
Creating diagrams with Graphviz is all about writing and tweaking simple code. Once you understand the basics of the DOT language, you can generate everything from flowcharts to complex system diagrams in just a few lines. Here are the simple steps to build a diagram with code online:
Step 1Open the Online Graphviz Editor
Open the Graphviz online editor in your browser. No signup or setup needed. You’ll see a split screen:
- Left: DOT code editor
- Right: Diagram preview area
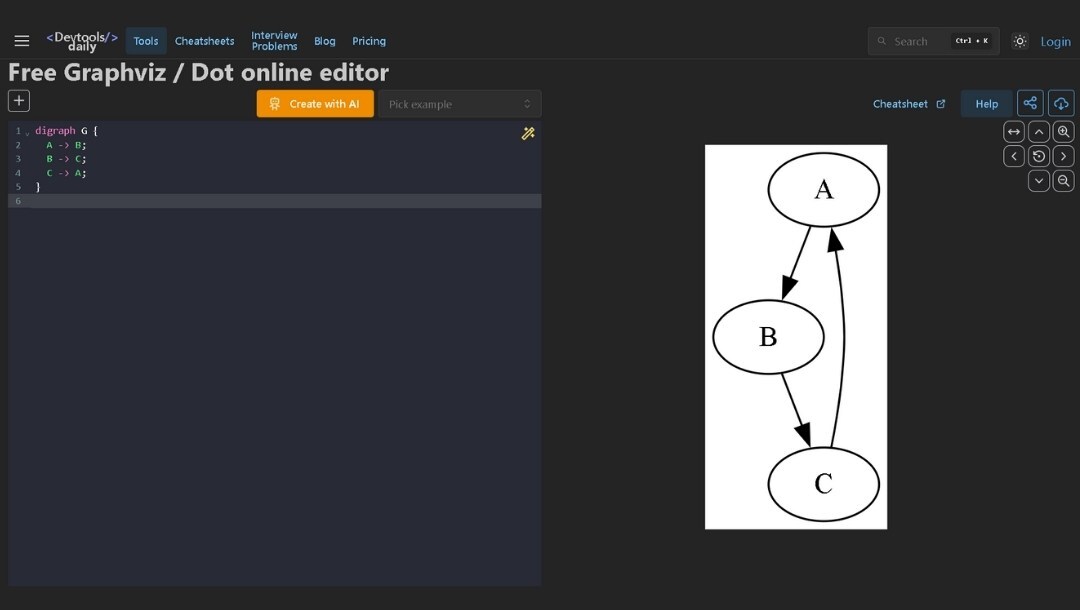
Step 2Write Basic DOT Code
Start with a minimal structure. The preview pane will immediately update and render a basic triangle diagram.
Code
digraph G {
A -> B;
B -> C;
C -> A;
}
What This Code Does
- digraph tells Graphviz you’re building a directed graph (with arrows).
- A -> B; creates an edge from node A to B.
- You can use any labels or node names.
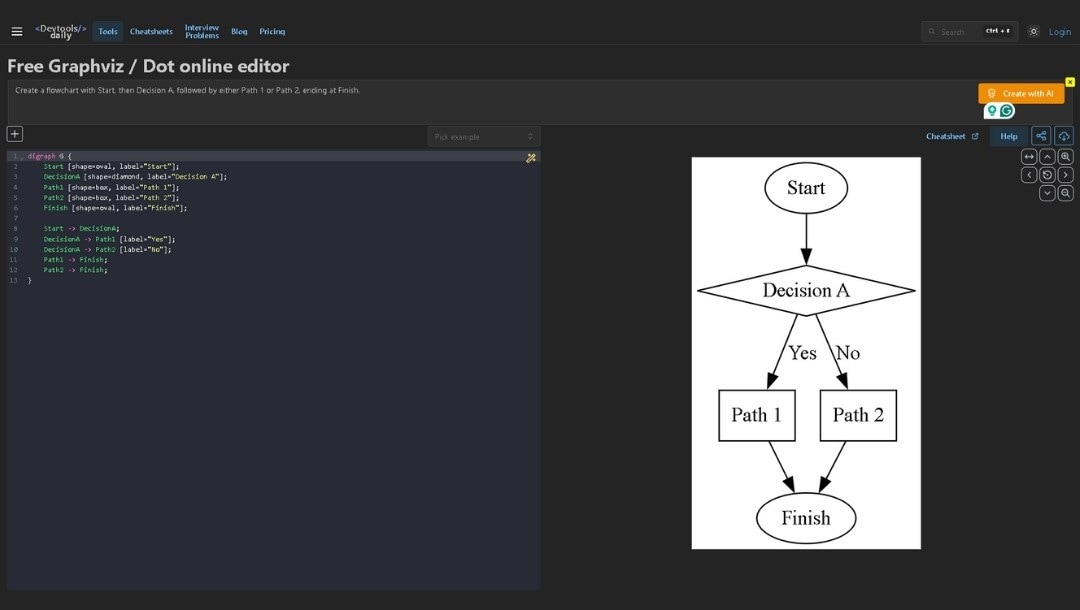
If you don’t want to write code manually, use the AI assistant. Just type a plain-English prompt like: “Create a flowchart with Start, then Decision A, followed by either Path 1 or Path 2, ending at Finish.” The AI will instantly generate DOT code like:
Code
digraph G {
Start -> "Decision A";
"Decision A" -> "Path 1";
"Decision A" -> "Path 2";
"Path 1" -> Finish;
"Path 2" -> Finish;
}
This gets added to the code editor automatically. You can then tweak the code and see the updated diagram on the right. It’s ideal for beginners who aren’t familiar with DOT syntax yet but still want to use Graphviz for fast, structured diagrams.
Step 3
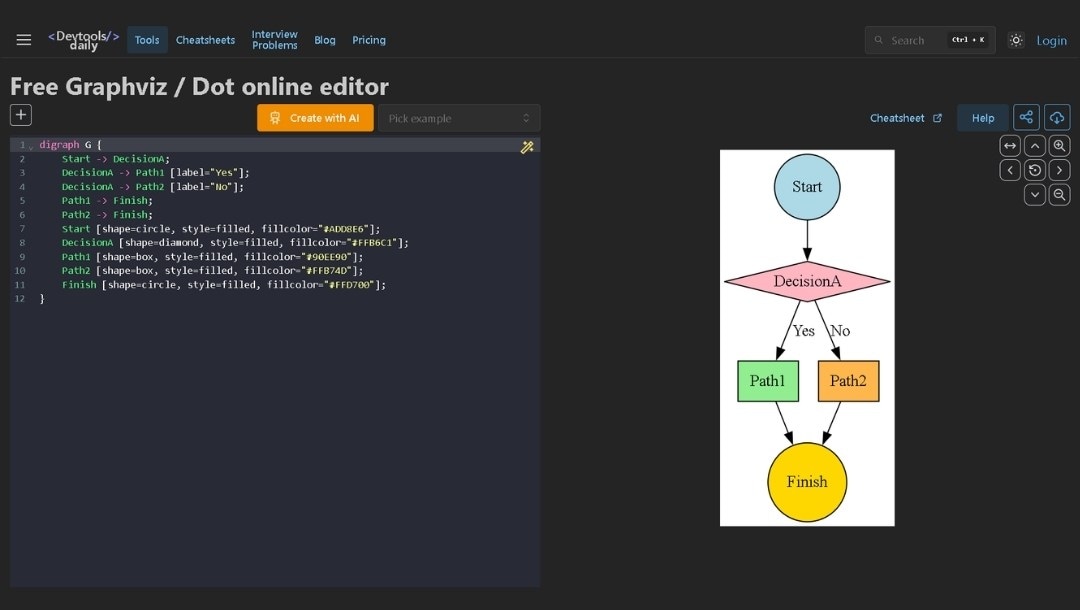
Add Labels and Styles
You can customize shapes, colors, and edges.
Code
digraph G {
Start -> DecisionA;
DecisionA -> Path1 [label="Yes"];
DecisionA -> Path2 [label="No"];
Path1 -> Finish;
Path2 -> Finish;
Start [shape=circle, style=filled, fillcolor="#ADD8E6"];
DecisionA [shape=diamond, style=filled, fillcolor="#FFB6C1"];
Path1 [shape=box, style=filled, fillcolor="#90EE90"];
Path2 [shape=box, style=filled, fillcolor="#FFB74D"];
Finish [shape=circle, style=filled, fillcolor="#FFD700"];
}
What This Code Does
- shape=box makes all nodes rectangular.
- style=filled adds background color.
- label="..." lets you customize the display name for each node.
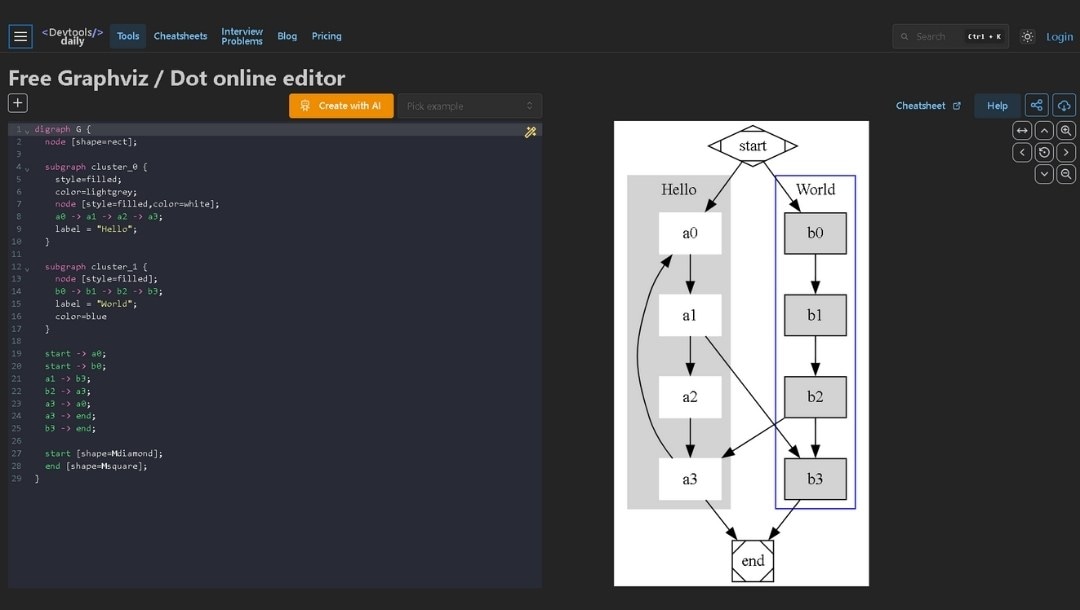
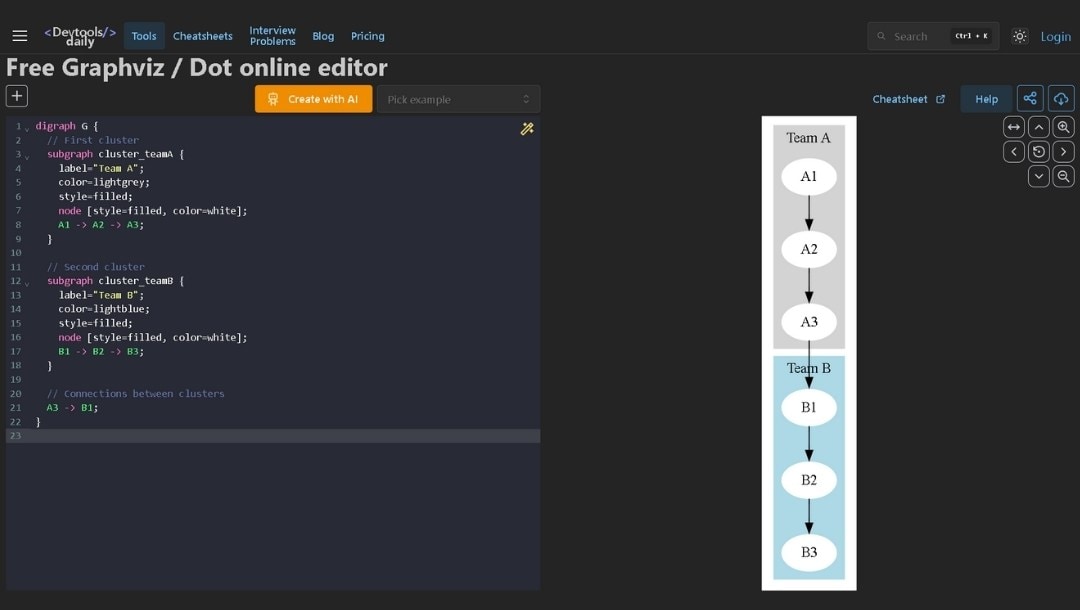
Step 4Use Subgraphs for Clusters
Subgraphs let you group related nodes into visual clusters. In Graphviz, adding a subgraph with the cluster_ prefix will automatically render a box around the grouped elements. Here’s an example:
Code
digraph G {
// First cluster
subgraph cluster_teamA {
label="Team A";
color=lightgrey;
style=filled;
node [style=filled, color=white];
A1 -> A2 -> A3;
}
// Second cluster
subgraph cluster_teamB {
label="Team B";
color=lightblue;
style=filled;
node [style=filled, color=white];
B1 -> B2 -> B3;
}
// Connections between clusters
A3 -> B1;
}
What This Code Does
- subgraph cluster_teamA groups nodes A1, A2, A3 under Team A.
- label="Team A" names the cluster.
- color and style define the cluster’s background.
- Nodes in each cluster are styled uniformly for clarity.
- The edge A3 -> B1 shows how the clusters are linked.
Subgraphs are especially helpful when visualizing:
- Microservices grouped by function
- Org charts with departments
- Systems broken into modules or environments (like Dev, Staging, Prod)
Once the code is in, the preview will show each group inside a labeled, styled box, clearly separating sections of your diagram without needing additional layout tricks.
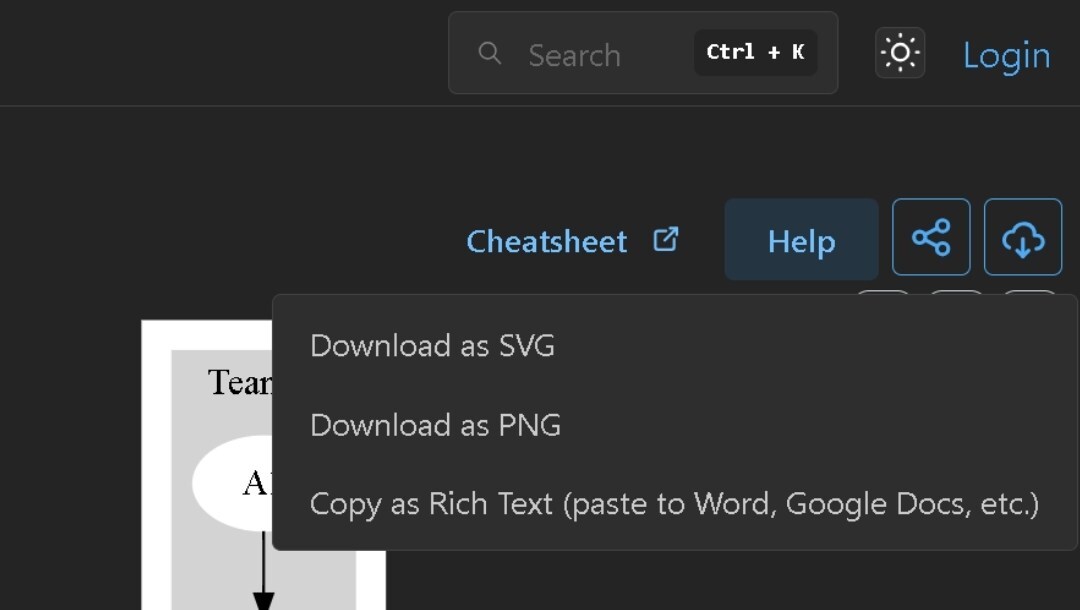
Step 5Export or Save
Click the download icon in the top right corner to save your diagram as:
- PNG
- SVG
- Copy as Text
Sample: Decision Tree Diagram
Code
digraph G {
node [shape=ellipse];
Start -> "Condition A" -> "Yes Path";
"Condition A" -> "No Path";
}
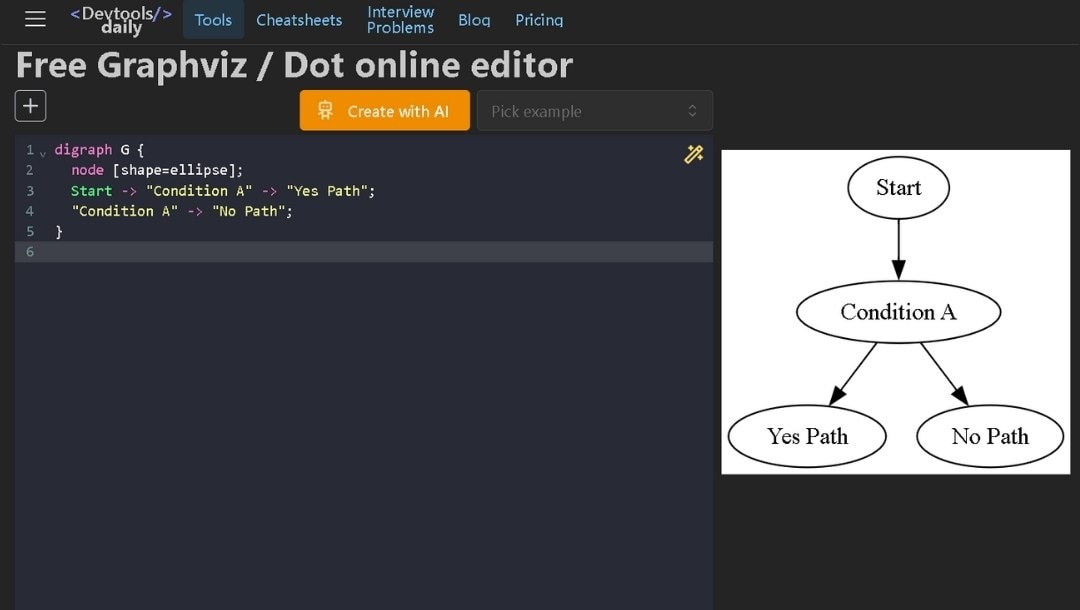
With just a few lines of text, Graphviz lets you generate scalable, structured visuals in seconds. But what if you’re someone who prefers visual editing or wants more design flexibility?
Want More Visual Control? Try EdrawMax Instead
Graphviz is great for fast, code-based diagrams, but not everyone wants to deal with coding and syntax. There’s no drag-and-drop interface. EdrawMax is a better fit if you wish to have complete visual control without messing with code. You just need to describe what you want. The AI creates the diagram for you instantly. Then you can adjust, style, and arrange everything by hand if needed.
Here’s why EdrawMax stands out:
AI + Manual Freedom
Prompt the tool with something like: Draw a login flow. It builds the chart. You then drag shapes, adjust connections, and apply your styles.
Supports Over 210 Diagram Types
Whether it’s mind maps, Gantt charts, flowcharts, org charts, or technical diagrams, you’ve got full coverage.
Plenty of Built-in Resources
Pick from thousands of templates. Use icons, connectors, and custom shapes. Export to PDF, JPG, Word, Visio, Markdown, or any other available format.
Works Anywhere
Use it on desktop, web, or mobile. Sync with the cloud or work offline. Sharing is simple.
How to Generate a Diagram in EdrawMax?
Follow these simple steps:
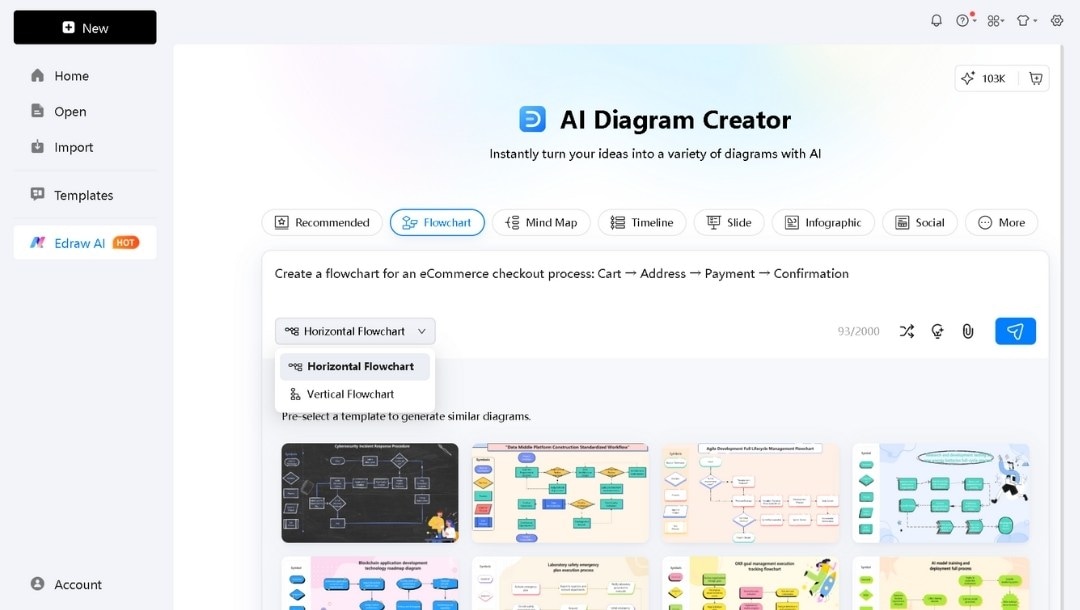
Step 1Launch EdrawMax and Access Edraw AI
Open the EdrawMax desktop app. From the dashboard, click Edraw AI in the left side panel, then choose diagram type: Flowchart. Enter your prompt, like: “Create a flowchart for an eCommerce checkout process: Cart → Address → Payment → Confirmation.” You can also choose:
- A horizontal or vertical layout
- A template style (optional, but useful)
Hit Enter to generate.
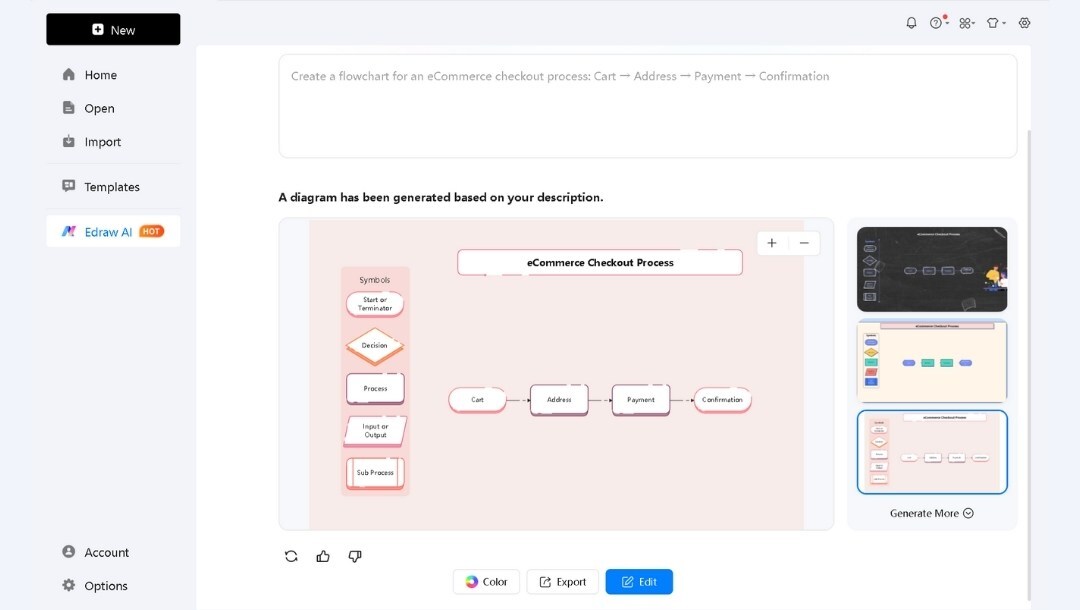
Step 2Review AI-Generated Diagrams
EdrawMax will show multiple versions of your diagram, each with different themes and layouts. Browse the results, then click Edit on the one that fits your needs. You can also use the Color button to try different color themes and download your diagram without editing by clicking the Export button.
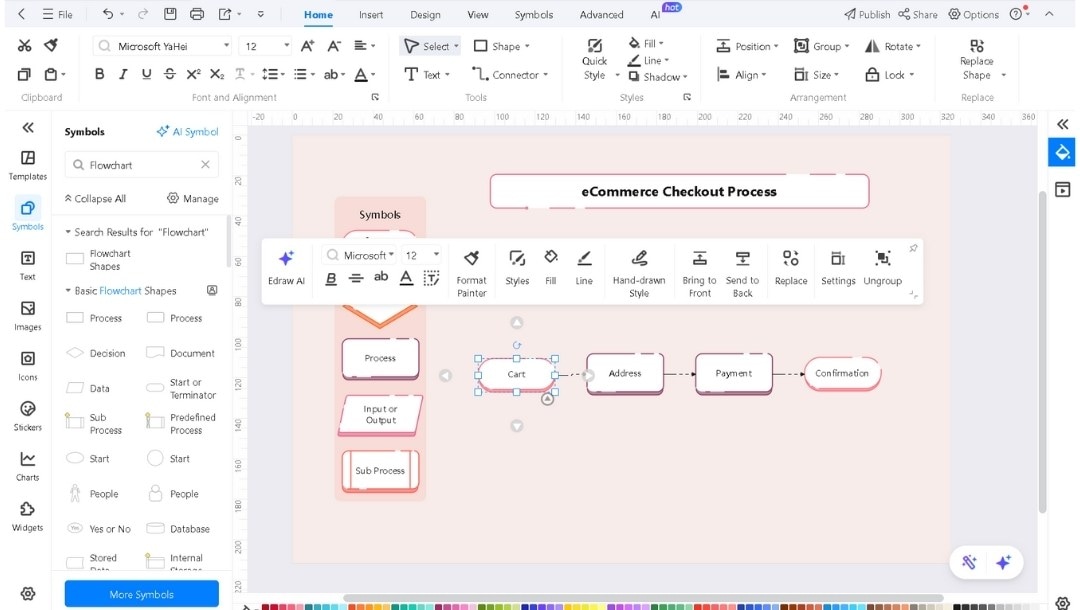
Step 3Customize Your Diagram
Once in the editor:
- Use the Symbols library on the left to drag new shapes or connectors.
- Click any element to modify text, colors, or styles via the pop-up toolbar.
- Resize, align, or group items with visual controls.
- Try the Instant Style Change button in the bottom right corner for one-click theme modification.
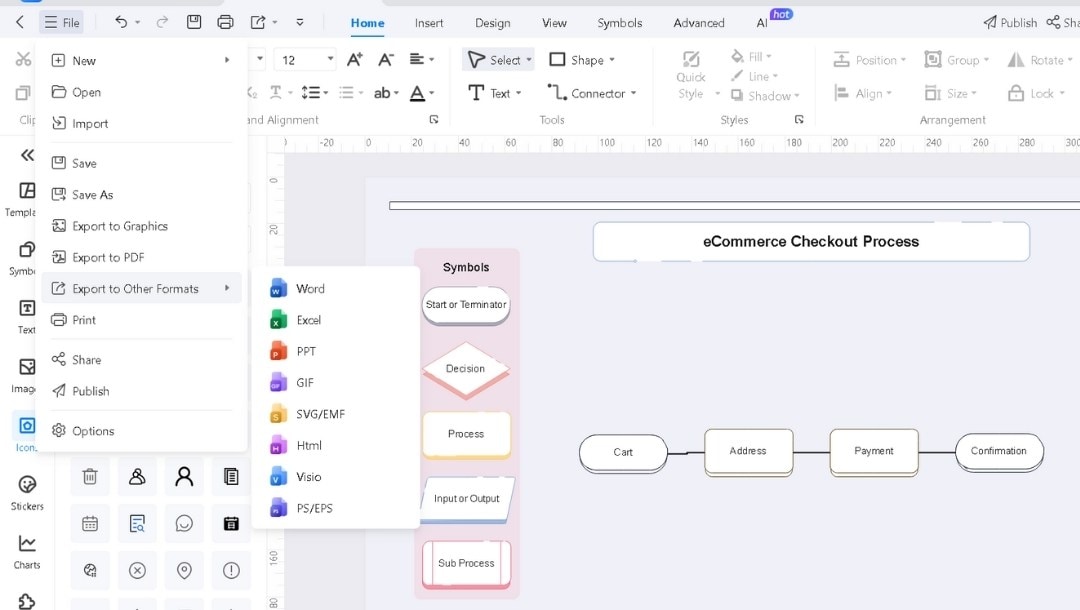
Step 4Export Your Diagram
When your diagram is ready, go to File > Export (Graphics, PDF, or Other Formats). Download it with a few clicks to set its name and select the folder, and you're done.
Tips to Create Better Code-Based Diagrams
Creating diagrams with Graphviz can be powerful if you structure your code well. Here’s how to improve clarity, consistency, and output quality.
Start Small and Scale
Begin with a minimal DOT file, one cluster, or a handful of nodes. Verify it renders correctly before adding more elements. It helps you catch syntax errors early and keeps diagrams manageable.
Choose Clear, Consistent Labels
Use meaningful names for nodes and edges. Instead of generic IDs like A1 or node2, write Login, ValidateUser, or GenerateReport. Clear labels make both the code and output self-documenting.
Experiment with Layout Engines
Graphviz offers several engines: dot (hierarchical), neato (force-directed), fdp (spring model), and more. Test your diagram under different engines to find the best fit for your content. For example, use neato for undirected graphs or dot for workflow charts.
Comment Your Code
Add // or /*…*/ comments to explain complex sections or cluster logic. Well-placed comments guide future edits and help collaborators understand your structure.
Leverage Subgraphs for Organization
Group related nodes using subgraph cluster_…. That adds automatic borders and labels, clarifying module boundaries or team ownership without manual positioning.
Keep Style Declarations Together
Define common styles at the top or in a dedicated section:
Code
node [shape=box, style=filled, color=lightgrey];
edge [fontname="Arial"];
This ensures a consistent look and simplifies global tweaks. Pro tip: When you want to skip scripting and jump straight to visual edits, try EdrawMax’s AI-powered diagram generator. It converts text prompts into editable diagrams, no DOT syntax required.
Graphviz vs EdrawMax: Which One Should You Use?
| Feature | Graphviz | EdrawMax |
| Ease of Use | Code-first. Requires familiarity with DOT language. | Drag-and-drop. No coding needed. |
| Templates | None built-in. All diagrams are defined from scratch. | 20,000+ ready-to-use templates across 210+ diagram types. |
| Customization | Style nodes via code. Fine control, but manual. | Full visual styling, themes, and instant layout options. |
| AI Support | AI assistant converts prompts into basic DOT code. | AI generates multiple editable diagrams instantly. |
| Export Options | PNG, SVG, or copy as text. Code-driven outputs only. | Export to PDF, PNG, Visio, Word, Markdown, and more. |
| Best For | Developers, engineers, automation workflows. | Designers, teams, non-coders, and visual thinkers. |
Go with Graphviz if speed, repeatability, and code-level control matter more than looks. Choose EdrawMax if you want beautiful diagrams without writing a single line of code. Want to skip code and create stunning visuals faster? Try EdrawMax's AI diagram generator.
AI Diagram Generator
Enter your prompt. Upload files if needed. Generate diagrams, charts, or slides instantly.


