


There is a fundamental flaw of energy loss at the heart of global agricultural production. This process of energy loss, known as photorespiration, causes plants to waste energy and release CO₂ that is only partially absorbed. C3 plants, which are more than 85% of total plant species, are major food sources. They drain energy through the incorrect reaction catalyzed by the RuBisCO enzyme. This enzyme fixes oxygen instead of carbon dioxide. As a result, CO₂ is released, and energy is wasted.
A biology diagram of this process is necessary to illustrate the changes. In this blog guide, there is an easy diagram tutorial on EdrawMax covering all major steps and events. You can edit the template online or draw your own diagram. Moreover, you can also use online templates in various digital tools.
In this article
What is Photorespiration?
Photorespiration is a process that occurs in green plants during photosynthesis. Plants make their food by using sunlight, water, and carbon dioxide. This food gives energy to the plant and helps it grow. An enzyme called RuBisCO (ribulose-1,5-bisphosphate carboxylase/oxygenase) plays a crucial role in this process.
RuBisCO Oxygenation
RuBisCO helps plants fix carbon dioxide from the air. This step starts the process of food formation in plants. However, RuBisCO has a weakness. It cannot clearly distinguish between carbon dioxide and oxygen. Because of this problem, RuBisCO sometimes reacts with oxygen instead of carbon dioxide. Scientists call this reaction RuBisCO oxygenation.
RuBisCO oxygenation initiates photorespiration. This process usually occurs in hot, dry conditions. During hot weather, plants close their stomata to save water. When stomata close, the carbon dioxide level inside the leaf decreases. At the same time, oxygen level increases. As a result, RuBisCO begins using oxygen more frequently.
When RuBisCO reacts with oxygen, it forms two products: a 3-carbon compound called 3-PGA, which helps the plant. The other product, called phosphoglycolate, creates problems for the plant. This harmful product cannot help make food. The plant must remove it quickly to stay healthy.
The plant uses energy to remove this harmful product. During this process, the plant releases carbon dioxide into the air. The plant also uses ATP and does not make glucose during photorespiration. As a result, photorespiration causes a loss of energy.
In addition, photorespiration reduces the rate of photosynthesis. It slows down plant growth and reduces food production. This process mainly occurs in C3 plants such as wheat, rice, barley, and oats. These plants suffer more in hot climates.
Scientists consider photorespiration a wasteful process. It wastes energy, releases carbon dioxide, and reduces crop yield. Farmers face problems because photorespiration reduces the amount of food that plants can produce.
The Photorespiration Pathway
Three Organelle Process
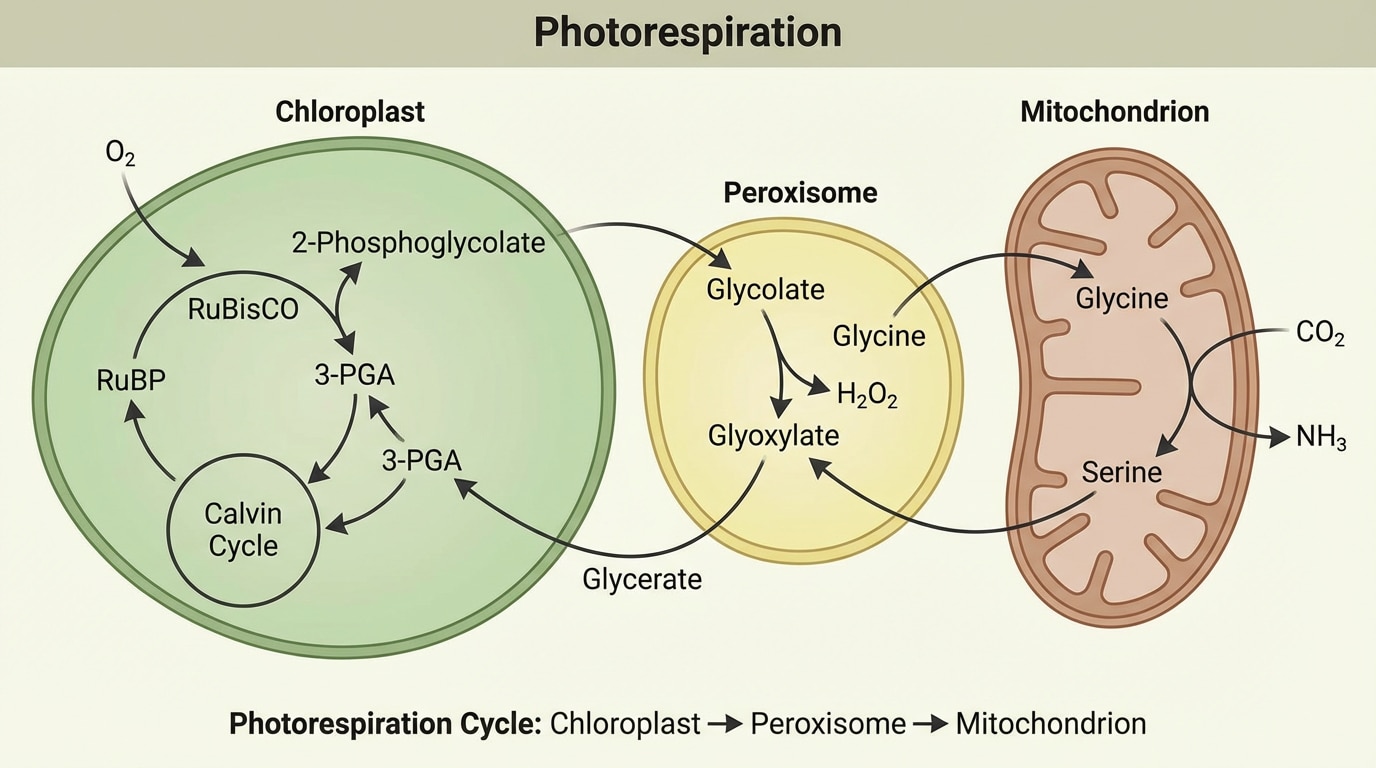
The photorespiration pathway includes many steps. This pathway involves three organelles of the plant cell. These organelles are the chloroplast, peroxisome, and mitochondrion. Due to this reason, scientists call photorespiration a three-organelle process.
The pathway begins in the chloroplast. In the chloroplast, RuBisCO reacts with oxygen. This reaction produces a harmful compound. The chloroplast converts this harmful compound into glycolate. The cell then sends glycolate to the peroxisome.
Inside the peroxisome, glycolate is converted to glycine. This step also produces hydrogen peroxide. Hydrogen peroxide can damage the cell. Special enzymes inside the peroxisome break it down quickly. These enzymes protect the plant cell from damage.
After this step, glycine is transported into the mitochondrion. In the mitochondrion, two glycine molecules combine and form one serine molecule. During this step, the plant releases carbon dioxide and ammonia. This release results in a loss of fixed carbon and nitrogen.
Next, serine moves back to the peroxisome. The peroxisome changes it again. The cell then sends it back to the chloroplast. In the chloroplast, the plant reforms RuBP. This RuBP can again take part in photosynthesis.
Although the plant recovers some material, the pathway results in significant energy loss. The plant uses ATP during photorespiration. The plant also loses the carbon dioxide it had fixed earlier.
This energy loss reduces photosynthesis efficiency. Plants grow slowly. Leaves produce less food. Crop plants give a lower yield. Farmers in hot regions face problems due to this process.
Photorespiration also increases stress in plants. Plants become weak in dry climates. This pathway explains why many C3 plants cannot survive well in hot environments.
C4 and CAM Adaptation
Avoiding Photorespiration
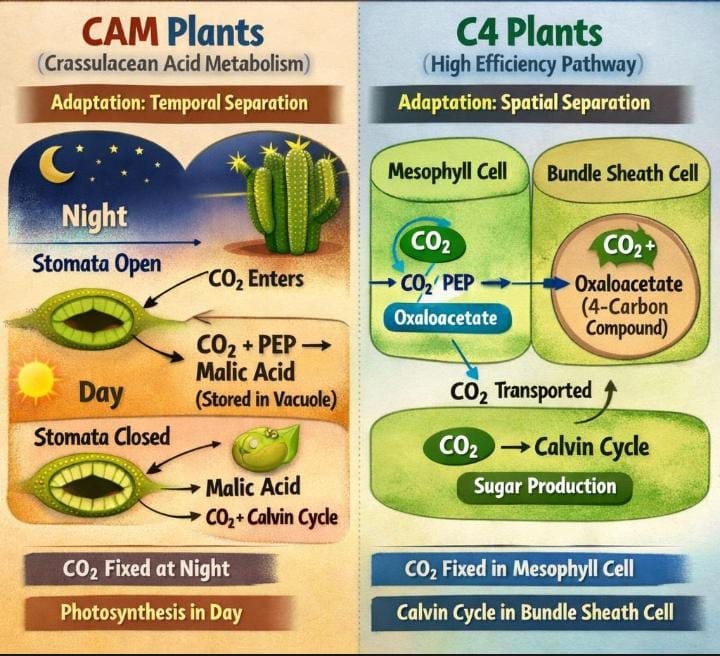
Some plants develop special adaptations to avoid photorespiration. These plants include C4 plants and CAM plants. These plants live in hot and dry areas. They use special methods to reduce the effect of RuBisCO oxygenation.
C4 plants include maize, sugarcane, corn, and sorghum. These plants fix carbon dioxide in mesophyll cells first. They form a four-carbon compound called oxaloacetate that moves to bundle sheath cells.
In bundle sheath cells, RuBisCO operates in a high-carbon dioxide environment. Due to this condition, RuBisCO does not react with oxygen. This method greatly reduces photorespiration. C4 plants make food more efficiently. They grow faster in hot climates.
C4 plants also exhibit better water-use efficiency. They keep their stomata partially closed. This action reduces water loss and oxygen entry. This adaptation helps plants survive in dry conditions.
CAM plants include cactus, pineapple, and aloe vera. These plants use a different strategy. They open their stomata at night. At night, the temperature remains low, and water loss stays minimal. CAM plants take in carbon dioxide at night.
CAM plants store carbon dioxide in organic acids. During the day, these plants close their stomata. They release stored carbon dioxide inside the leaf. RuBisCO then readily uses this carbon dioxide.
CAM plants avoid photorespiration by separating gas exchange and photosynthesis in time. This method saves water and energy. CAM plants survive well in deserts.
Both C4 and CAM adaptations reduce photorespiration. These adaptations improve photosynthesis. These plants show better growth in harsh environments.
How to Make a Photorespiration Diagram with EdrawMax
You can draw a photorespiration diagram in EdrawMax for free. It offers the following features for drawing biology diagrams:
- Free templates, symbols, and icons for biology diagrams
- Connector tools
- Drag and drop options
- Shapes for organelles and other components
- Multiple export options like images, documents, or GIFs in high resolution
Here, you can draw a photorespiration diagram from scratch using easy steps.
Step1 Selecting Plant Biology Templates
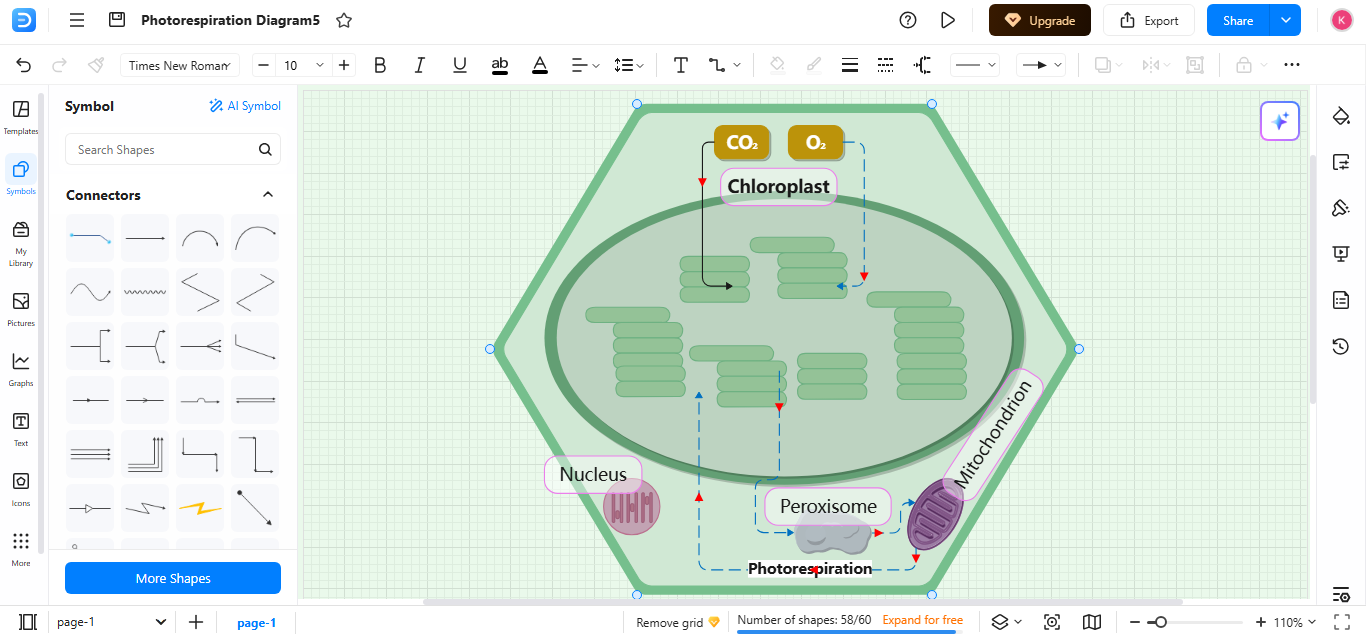
- Open EdrawMax and log in to it. Then, tap on the 'New' button on the left side of the screen. In the templates section, you can choose ready-made templates for plant biology, such as photosynthesis and cell structure.
- You can select one from them, or you can opt for a blank drawing to draw from scratch.

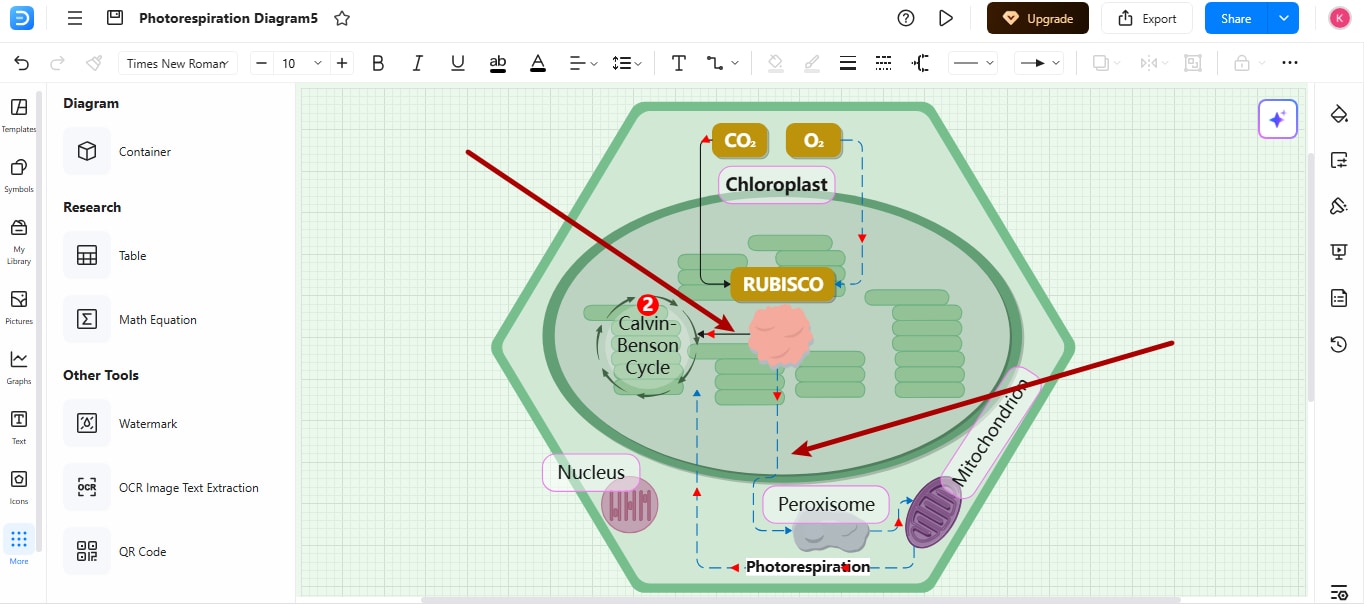
Step2 Drawing the 3-Organellar Pathway
- Use the basic drawing shapes and symbols from the symbols library and drag them into the canvas. Draw the shapes for mitochondria (bean-shaped structure), chloroplasts (oval shape with internal sacks), and peroxisomes (a small circle).
- Arrange these shapes in a triangular workflow where the photorespirator will connect these parts. Now, use arrows to show the pathway loop
- From the chloroplast to the peroxisome
- From peroxisome to mitochondria
- Back from mitochondria to the peroxisome and finally back to the chloroplast
Draw arrows for gaseous exchange: CO₂ and O₂ inputs into the chloroplast, and add a text box for photorespiration.
Step3 Illustrating RuBisCO Reactions
- Place a text box for RubisCo enzyme inside the chloroplast
- Draw dual reaction pathways. Label one arrow for CO₂ for carboxylation, which undergoes the Calvin cycle and sugar production. This production is helpful for plants.
- Draw one arrow for oxygenation, O₂, which is a wasteful process. This shows the exit from the chloroplast into the photorespiratory pathway
- Use different colors for O₂ and CO₂ reactions
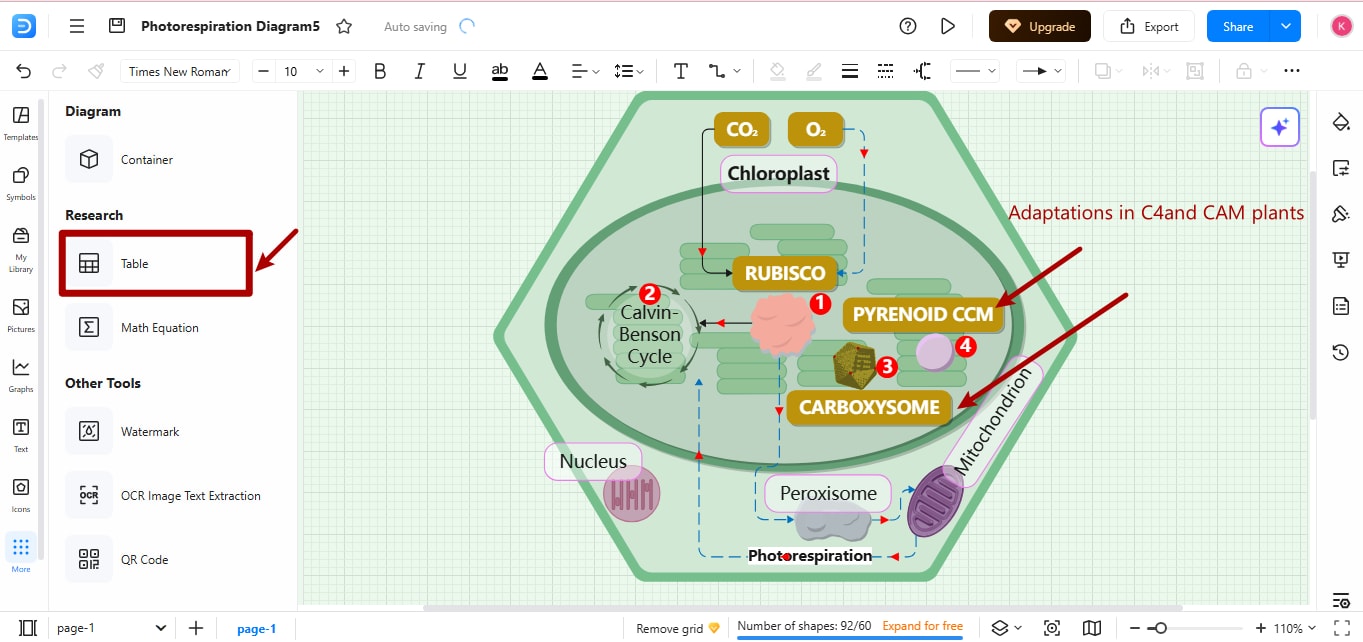
Step4 Creating C3, C4, CAM Comparison Charts
You can create a comparison chart using Edraw's table tools to compare C3, C4, and CAM plants.
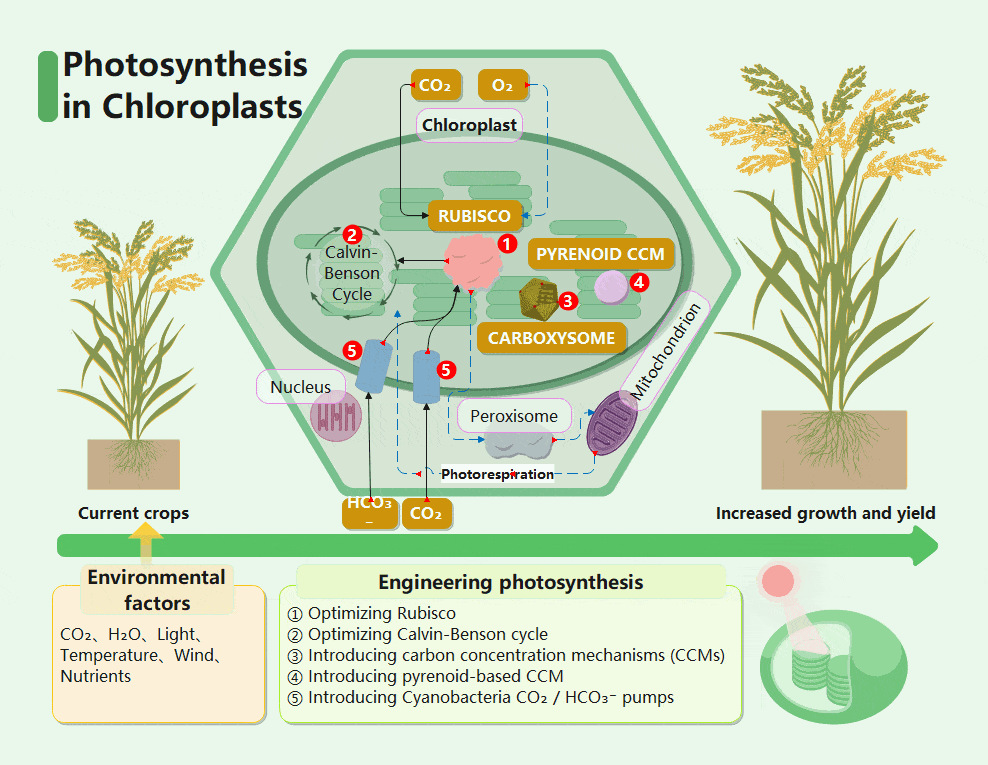
Use a text box for CCM (Carbon Concentration Mechanism), used by C4 and CAM to fix CO₂ in a 4-carbon compound.
Place a text box for the carboxysome, used to minimize photorespiration.
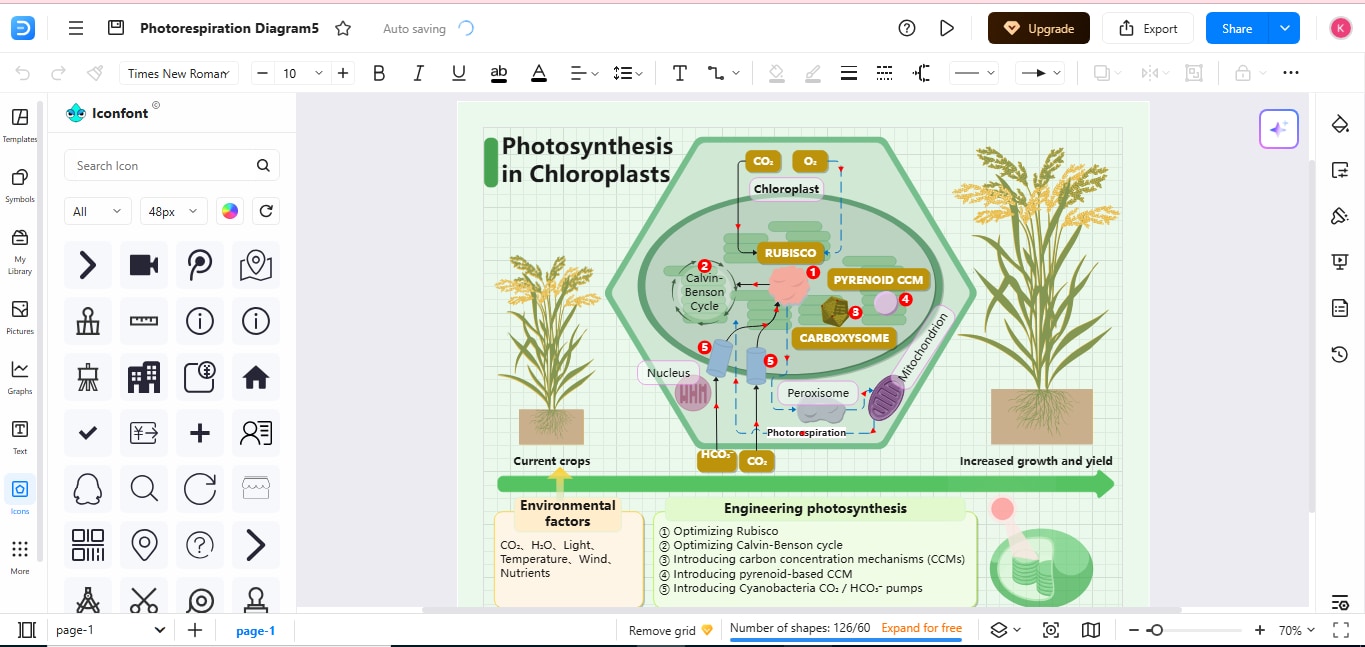
Step5 Adding Biochemical Details
- Use EdrawMax text boxes and shape tools to add biochemical details.
- Add text boxes for the following and label them
- HCO₃⁻ (bicarbonate)
- CO₂ pumps
- Carboxysome: originates from cyanobacteria, which concentrates CO₂
- Pyrenoid CCM: present in chloroplasts of algae
- Environmental factors, such as CO₂, H₂O, light, temperature, wind
- Engineering goals for C3 crops
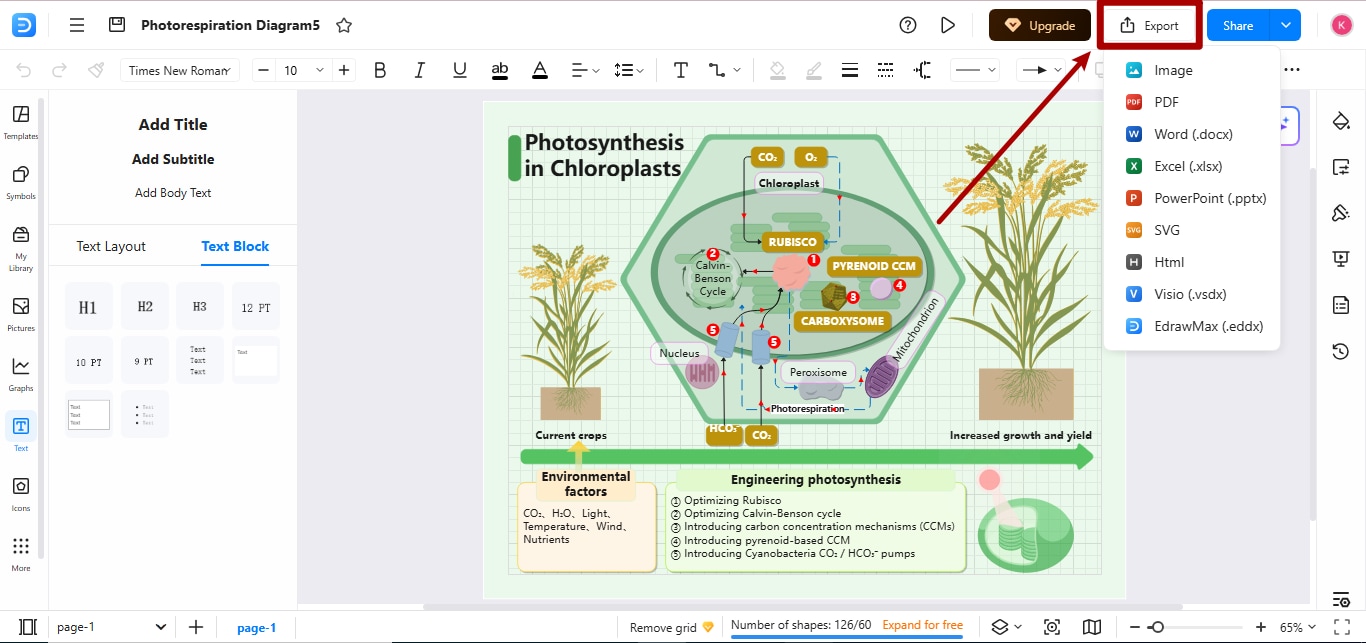
Once the diagram is completed, you can export it. Here you can find the different options and download as per your needs. In fact, you can choose to export your diagram in the format of GIF like this one:
Whether you are a student, teacher, or biology enthusiast, you can draw biology diagrams on EdrawMax for free and export them to share with your friends or social circle.
Explore More Free Biology Diagram Templates
It might take hours to draw a complex biological structures from scratch. That's why a good diagram template could save you a lot of time, but finding a good one is not easy! Whether you need a detailed metosis process diagram, or viral infection process diagram, or a clear cell structure diagram, the EdrawMax Template Community has you covered.
Browse through thousands of user-generated, free biology templates that are 100% customizable. Simply pick a template, tweak the details, and export it for your lab report, presentation, or study notes in seconds.
Conclusion
Photorespiration is not only a biological process but also a constraint on global food production. Because it competes with the Calvin cycle, which produces sugar in plants. A visual illustration using digital tools like EdrawMax can elaborate on this process more effectively. Highlighting its major steps and events, students can gain a better understanding of this process.
AI Diagram Generator
Enter your prompt. Upload files if needed. Generate diagrams, charts, or slides instantly.


