


An Ishikawa model or fishbone diagram is a visual tool for root cause analysis. It helps you identify the main source of a problem instead of treating surface symptoms.
As the name implies, the structure mimics a fish skeleton and organizes factors into distinct categories. By creating an Ishikawa diagram, you can bring order to your brainstorming sessions and support your continuous improvement efforts.
This clarity allows you or your team to fix issues faster and prevents them from recurring later.
So, if you want to simplify your problem-solving process, keep reading. This article covers the Ishikawa model, examples, and a step-by-step guide to creating one.
In this article
- What Is an Ishikawa Diagram?
- Origin and History of Fishbone Diagrams
- Fishbone Diagrams vs. Cause-and-Effect Diagrams
- When To Use Fishbone Diagrams
- Benefits of Using Fishbone Diagrams
- Examples of Fishbone Diagram
- How To Create a Fishbone Diagram With EdrawMax?
- Tips for Designing Effective Fishbone Diagrams
What Is an Ishikawa Diagram?
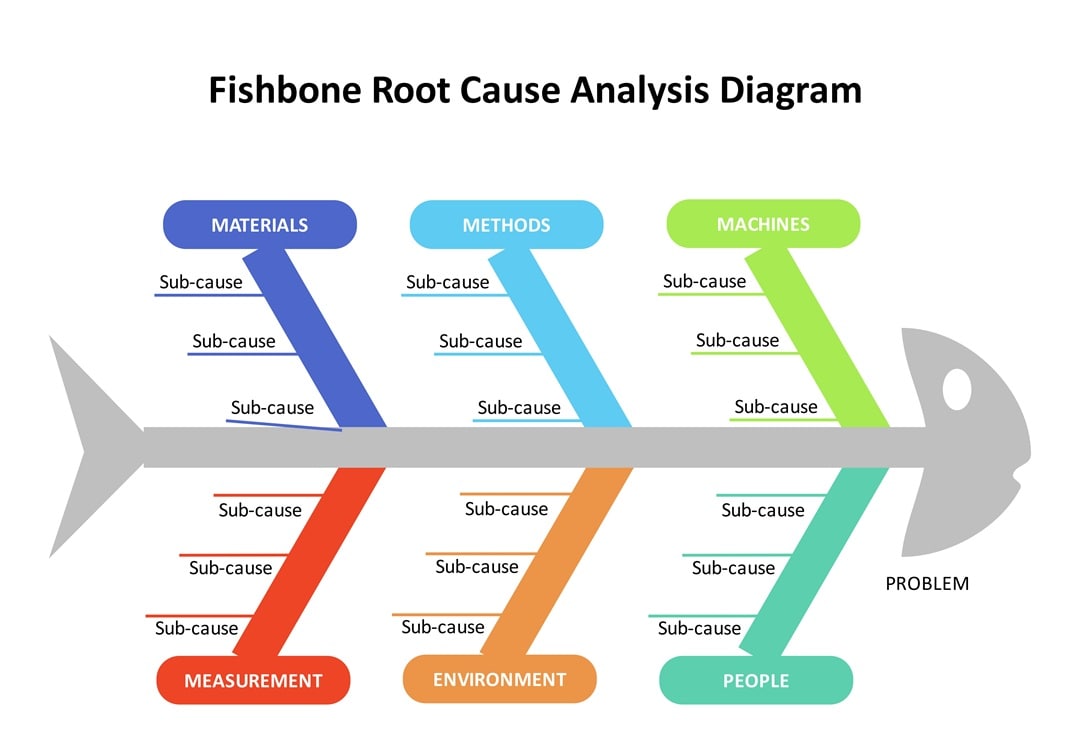
The Ishikawa chart functions as a visual cause-and-effect tool. You place the central problem at the "head" of the fish skeleton to keep the focus sharp.
Extending from the central spine, the "ribs" branch out to represent major categories where you might find the root causes. Because of its distinct skeletal shape, it is frequently referred to as a fishbone diagram.
Common categories often include:
- Manpower (People): The individuals involved in the process.
- Methods: The procedures or rules in place.
- Machines: The technology and equipment available.
- Materials: The raw inputs or supplies.
- Measurement: The data and metrics used for inspection.
- Mother Nature (Environment): The environmental conditions.
This depth makes a fishbone analysis far more effective than a simple list of complaints.

Origin and History of Fishbone Diagrams
Quality control processes looked very different before the 1960s. During that era, Dr. Kaoru Ishikawa, a professor at the University of Tokyo, sought a better way to handle complex industrial problems.
He noticed that employees often felt overwhelmed by the sheer number of factors affecting their work quality. To fix this, he introduced a visual method at Kawasaki Heavy Industries.
The goal was simple. He wanted to help teams see the relationship between causes and the effect. Since the resulting shape resembled a fish skeleton, the name Ishikawa fishbone stuck.
This approach quickly gained traction. Mazda Motors used it to design the Miata, ensuring every part of the sports car met high standards. Over time, the technique evolved beyond the factory floor.
Now, teams across various sectors rely on fishbone analysis to organize their ideas and improve continuous quality management.
Fishbone Diagrams vs. Cause-and-Effect Diagrams
To understand the difference, view "cause and effect" as the umbrella term.
When comparing Ishikawa diagrams to cause-and-effect diagrams, remember that the latter represent the logic of causality. It focuses on the relationship where one event triggers another. You can express this through diagrams like flowcharts, simple lists, or causal loops.
In contrast, an Ishikawa diagram example always relies on a distinct " fish skeleton" structure. This visual tool allows teams to categorize inputs into specific categories, such as the 6 Ms (Manpower, Method, etc.).
It creates a framework to sort ideas, whereas a general cause-and-effect analysis traces the path of events.
You get a quick overview below:
| Feature | Fishbone / Ishikawa Diagram | Cause-and-Effect Diagram |
| Scope | A specific visual methodology created by Kaoru Ishikawa. | A broad functional category of analysis. |
| Format | Fishbone shape using categories like the 6Ms. | Flexible formats, including flowcharts, lists, or trees. |
| Focus | Grouping and sorting potential detailed root causes. | Tracing the linear or circular path of events. Broad cause clusters |
| Ideal Use | Quality issues or process flaws | General problem exploration |
When To Use Fishbone Diagrams
Clear insight comes from matching the visual tool to the situation. Fishbone analysis works best for problems that seem simple but hide deeper causes. This method guides you through every angle to identify the real trigger.
Below are five scenarios that show where it works best:
- Finding root causes: The Ishikawa chart breaks big problems into smaller cause groups that help you spot patterns.
- Solving challenges: If you are generating ideas to fix a problem, it helps you see connections others might miss. Each branch opens space for input from your team.
- Improving processes: Designing or refining a workflow demands precision. Categories in the Ishikawa fishbone diagram highlight weak points that need attention.
- Understanding customers: Interpreting survey data can be overwhelming. Clusters help you match feedback to possible causes.
- Reviewing results: Assess the performance of a marketing campaign. Use the Ishikawa diagram to isolate the specific factors that led to success or failure.

Benefits of Using Fishbone Diagrams
Visualizing the issue makes the solution obvious. An Ishikawa model helps pinpoint the exact error without relying on guesswork. The tool organizes details to show exactly where the process failed.
Here is why it adds value:
- Precise clarity: A thorough view of the issue emerges. Specific triggers replace assumptions, ensuring the focus remains on the actual source of the trouble.
- Stronger teamwork: Diagnosis becomes a group effort. Groups contribute ideas without talking over each other. The visual aid keeps the discussion on track.
- Better choices: Facts drive the plan. Evidence supports the decisions to ensure the outcome works.
- Stops repeats: Reduced the likelihood of the same problem happening again. Clear causes help you fix weak points. Risks decrease significantly for the future.
- Flexible usage: The Ishikawa model works well with other inputs. Extra info fits easily to create a complete analysis.

Examples of Fishbone Diagram
Understanding how a visual tool like the fishbone diagram works in the real world helps you apply it effectively. Below are scenarios showing how different industries use it to solve problems.
Shipment Delay
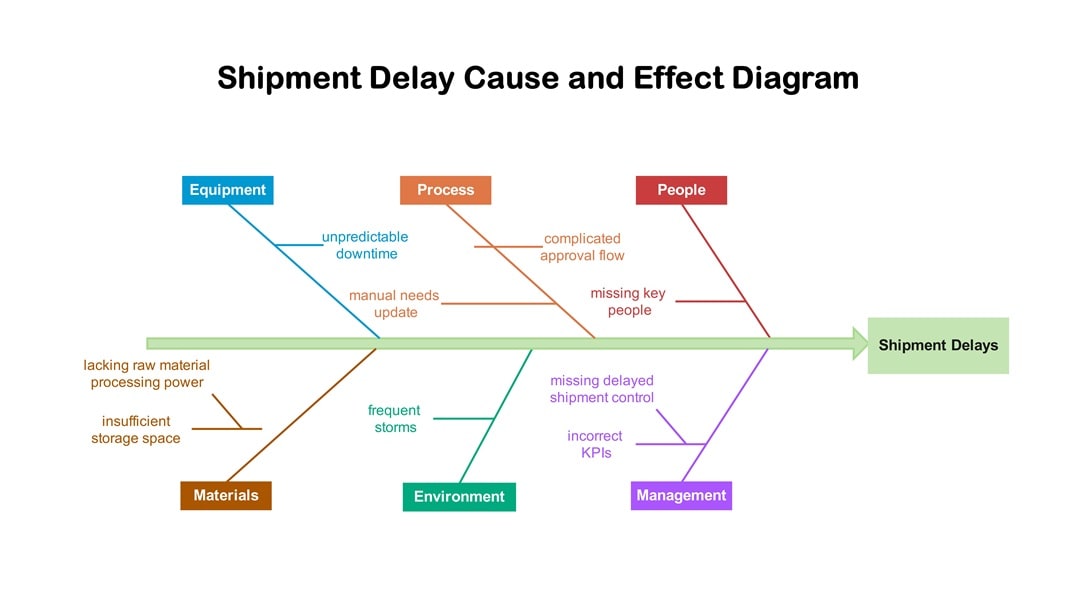
Customers expect speed, yet logistics often face interruptions. When a package arrives late, the Ishikawa diagram example reveals that the issue rarely stems from a single source.
Transportation often breaks down due to mechanical failures, such as a delivery truck engine overheating mid-route. Also, external factors like severe weather storms can force drivers to pull over, halting progress.
Personnel issues also play a significant role. If a warehouse lacks enough staff during holiday rushes, sorting slows down immediately.
Incorrect customer addresses further complicate the process, causing drivers to circle neighborhoods in vain. Mapping these out shows that fixing the delay requires addressing both maintenance schedules and hiring practices simultaneously.
Root Cause Analysis
Let's say a pizza shop is dealing with late deliveries. Place the main problem at the fish's head to start. The Ishikawa diagram branches into six areas to organize your thoughts.
You might list running out of dough under Materials, or a confusing route system under Methods and Machines. Then, look below the center line for Measurement errors, a crowded Environment, or a shortage of People.
Listing these sub-causes on the ribs exposes the truth. The fishbone analysis traces the delay to the actual source, covering everything from equipment flaws to human error.
Fishbone Chart With Emphasis
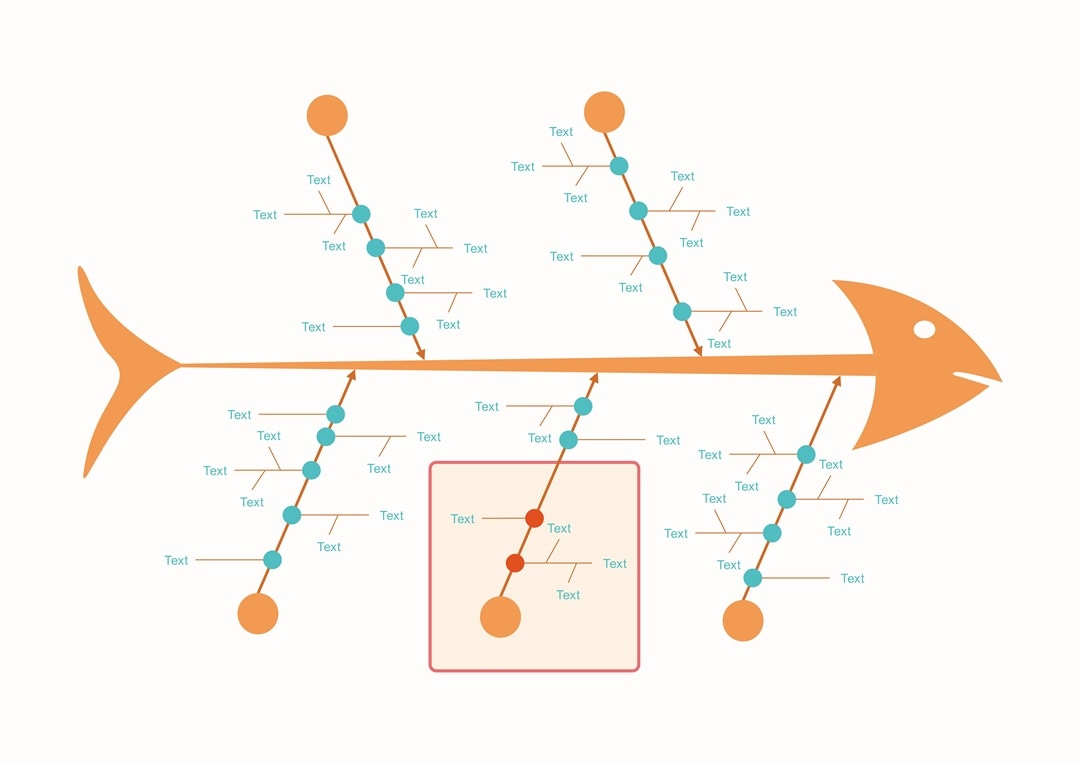
Take a coffee shop struggling with spilled drinks and slow service. Focus on the workspace by filling out the "Environment" branch highlighted here. The Ishikawa model organizes physical problems on these specific ribs.
Write "narrow counters" or "dim lighting" on the smaller lines to pinpoint why baristas bump into each other. These details expose the issues hiding in the layout.
A fishbone analysis maps the room, showing exactly which tight corners cause the delays. Now, your team can identify the source instead of treating symptoms.
Oil Company Revenue and Profit Drop

Large energy corporations operate in a volatile market where profits can vanish overnight. The Ishikawa fishbone chart here reveals the specific reasons behind Saudi Aramco's revenue drop.
Place that financial loss at the fish's head. You might list market oversupply or economic struggles on the top spines. Meanwhile, political pressure and strict green rules sit below the center line.
Don't forget internal issues like old facilities. The fishbone analysis connects these various problems to the main decline. Seeing these factors together helps leadership decide whether to cut costs or lobby for policy changes.
Ozone Depletion

The Earth needs a shield, but pollution weakens it daily. The Ishikawa chart separates the reasons for ozone depletion from the fallout. Causes sit on the top section, where nitrogen compounds and unregulated rocket launches do the most damage.
Common chemicals like CFCs from sprays also float up to harm the layer. Consequences fill the bottom half. UV radiation hurts marine life by killing the plankton that fish eat.
Humans suffer too, as more exposure weakens the immune system. Mapping it out this way links industrial mistakes directly to the environmental harm they cause.
Product Sales

Creating a successful product depends on how well different teams work together. You need to align every effort, from the research phase in Design to the final tests in Engineering.
The Ishikawa model sorts these contributions into four main branches to keep teams on track. Marketing and Customer Service sit at the top spines, driving the message and user support. Meanwhile, technical details like functionality and maintenance anchor the bottom.
Finding a sales gap becomes easier when you can trace it back to a specific messaging flaw or a missing feature.
How To Create a Fishbone Diagram With EdrawMax?
Wondershare EdrawMax makes creating an Ishikawa fishbone diagram effortless. Aside from starting from scratch, you can use AI tools and creative templates.
With cross-platform compatibility, you can build over 210 diagram types for various industries, wherever you are. This all-in-one diagramming platform helps you visualize solutions quickly, removing the hassle from your design process.
Follow these steps to create a fishbone diagram using EdrawMax on your desktop:
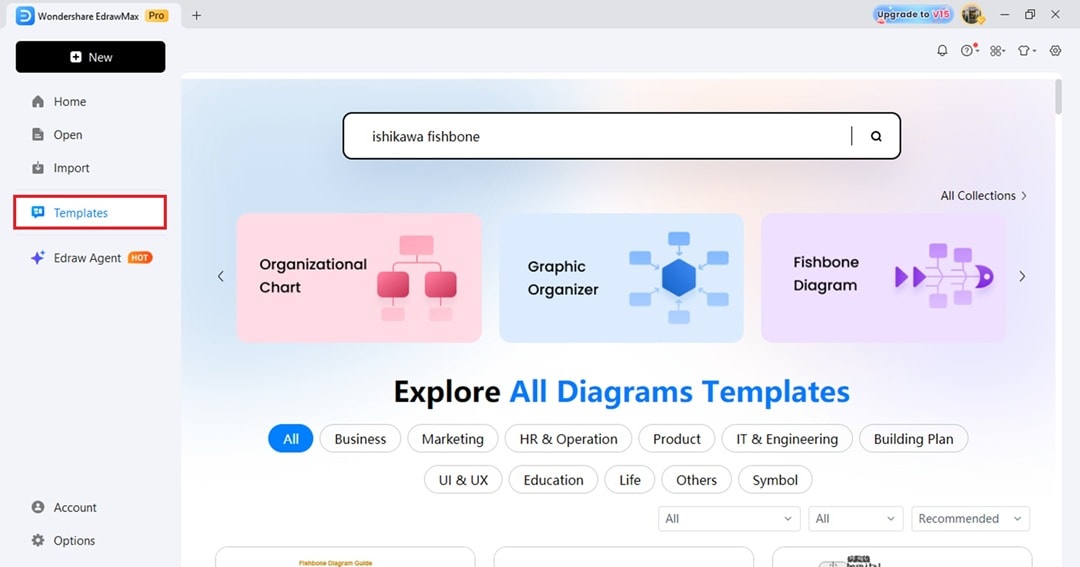
Step1 Create a New Project
- Navigate to the Home section, then click New in the top-left corner. Choose Blank Drawing to start from scratch.
- Alternatively, go to Templates from the left-side navigation pane. Enter a keyword like "ishikawa fishbone" in the search bar or click Fishbone Diagram from the categories.
- Next, scroll down for the results and click Use immediately to open in the canvas.
Step2 Add the Branches
- Define the Main Issue
- The "head" of the fish represents the specific problem you need to solve.
- Input the problem statement in this text box.
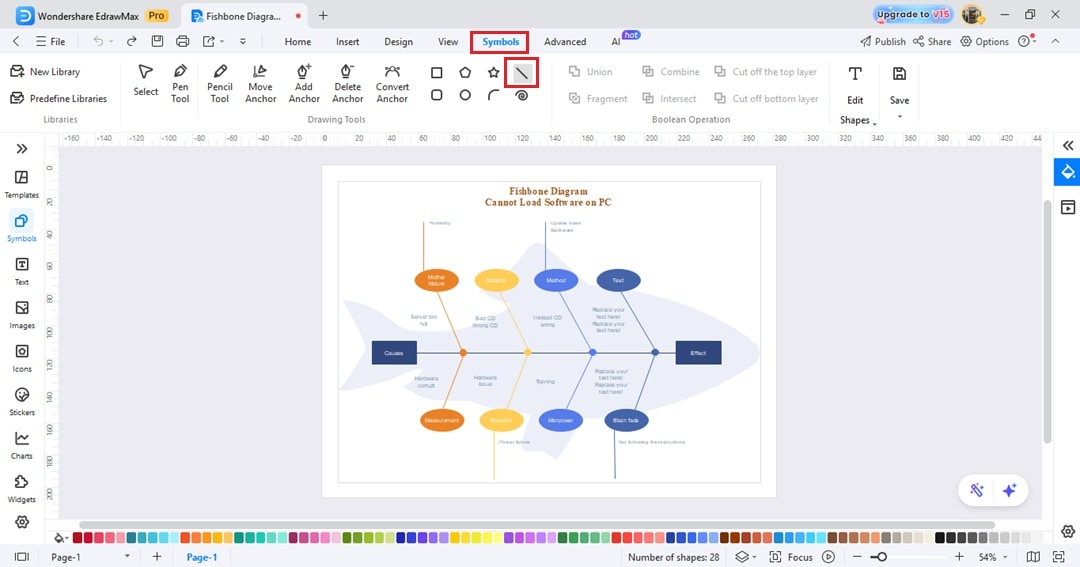
- Add Major Categories
- Go to Symbols from the top menu and choose the line. Draw lines branching off the central spine.
- Most users follow the standard Ishikawa model categories like Methods, Machines, People, and Materials.
- Brainstorm Specific Causes
- Add smaller horizontal lines to the major branches.
- List specific contributors to the problem. Conducting a thorough fishbone analysis means digging deep, so include every potential factor.
Step3 Input the Cause and Effects
- Place the text boxes at the ends of the large bones extending from the spine.
- Double-click on the shape to enter the detailed causes.
- From the floating toolbar, you can customize the text font, style, and size.

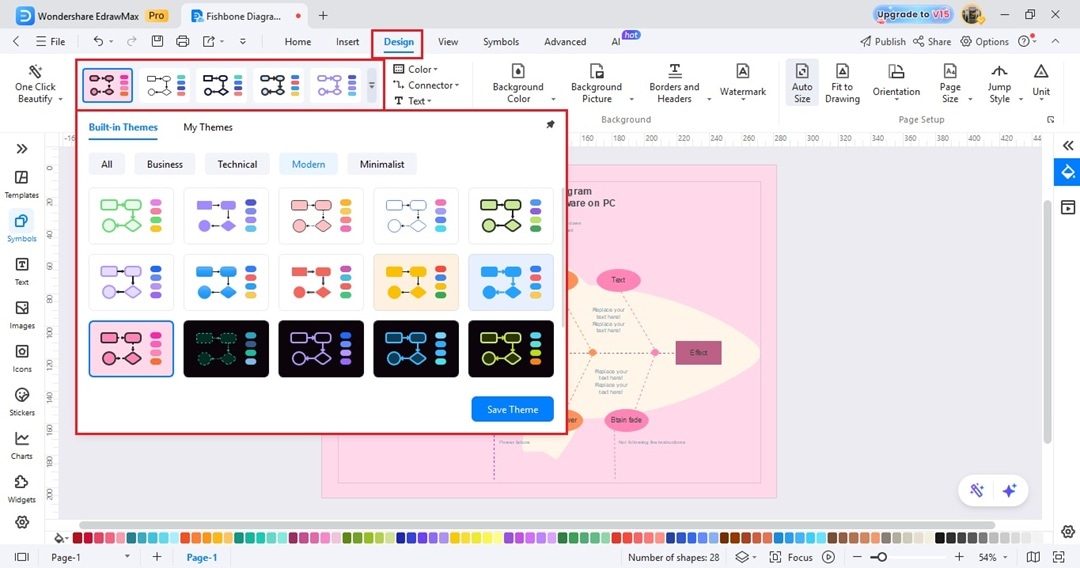
Step4 Customize the Ishikawa Diagram
- Adjust colors and fonts to make the data distinct.
- Go to the Design tab from the upper navigation pane.
- Choose an option from the built-in themes to change the colors with a single click.
Step5 Export Fishbone Diagram
Once the content appears accurate, save the file or export it to a common format, such as PDF or PNG, for easy sharing.
Tips for Designing Effective Fishbone Diagrams
Building a diagram requires more than just drawing lines. You want a tool that solves problems, not one that confuses the team. Good design leads to better answers. Follow these tips to ensure your analysis yields results.
Brainstorm Causes
Ideas flow better when people talk openly and contribute simultaneously.
Digital tools like EdrawMax enable the group to input concepts in real-time, turning a standard meeting into an interactive session. An effective Ishikawa diagram needs input from everyone to capture every angle.

Use Meaningful Categories
Generic labels often lead to vague results. Grouping items requires clear categories that fit your industry. While the classic 6Ms work well for manufacturing, service industries benefit from using the 4Ps (Policies, Procedures, People, Plant).
Prioritize the Causes
Once the ideas are on the board, identify the heavy hitters. You cannot fix everything at once. Highlight the factors that most severely impact the problem.
Visual cues, like circling top issues or using bold text, make the fishbone analysis actionable. This tells the viewer exactly where to focus their energy first.
Apply Color Coding
Monochrome charts often look dull and blend. Grouping categories by color helps the eye distinguish between different branches of the fishbone analysis. Visual separation makes the data faster to scan and digest.
Keep Labels Concise
Long descriptions crowd the space. Text should remain short and direct. Your audience grasps the point more quickly when words are fewer. So, use phrases instead of full sentences on your Ishikawa chart.
Conclusion
Root cause analysis does not have to be difficult. In fact, teams work better when they can clearly see the actual source of an issue. The Ishikawa model provides that necessary structure by forcing everyone to look past surface symptoms.
You will find clarity by systematically organizing these factors. Ultimately, a well-made Ishikawa fishbone chart guides the group toward a real solution.
Take these tips and apply them to your next project with EdrawMax, because solving problems becomes much easier with a solid plan in place.
FAQ
Below are some frequently asked questions.
-
What Are the 6 Major Areas of the Fishbone Diagram?
Manufacturing teams use the "6 Ms" to categorize root causes. These specific areas include Manpower, Method, Machine, Material, Measurement, and Mother Nature (Environment). This framework brainstorms and sorts source issues effectively for production environments.
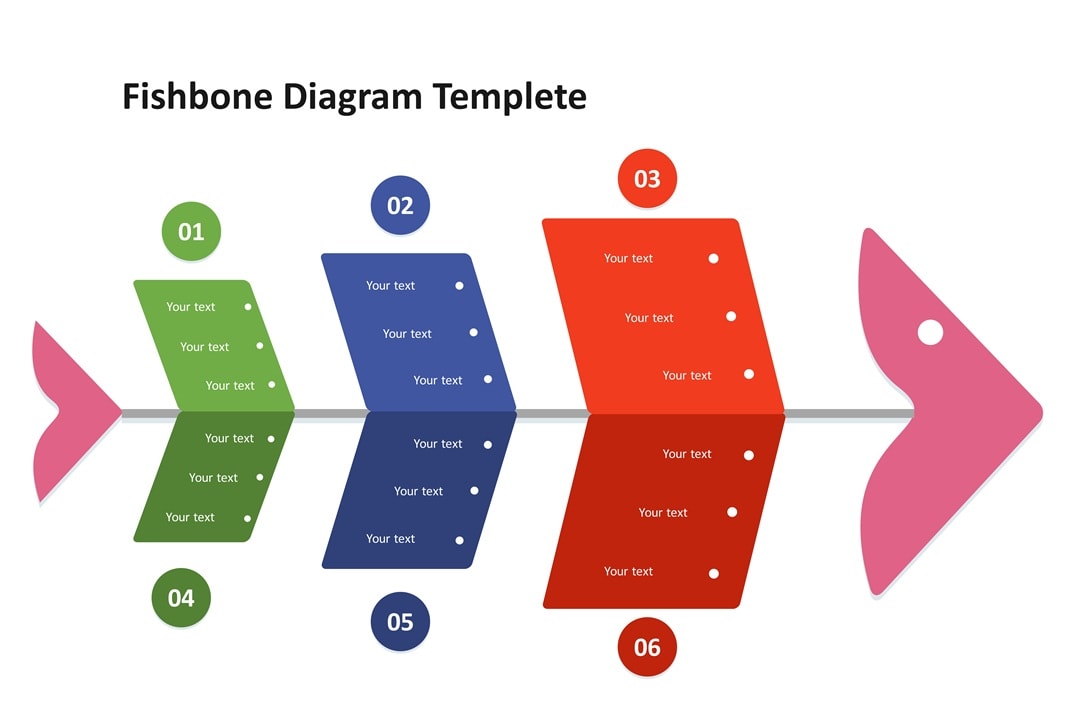
Ishikawa Diagram Template

-
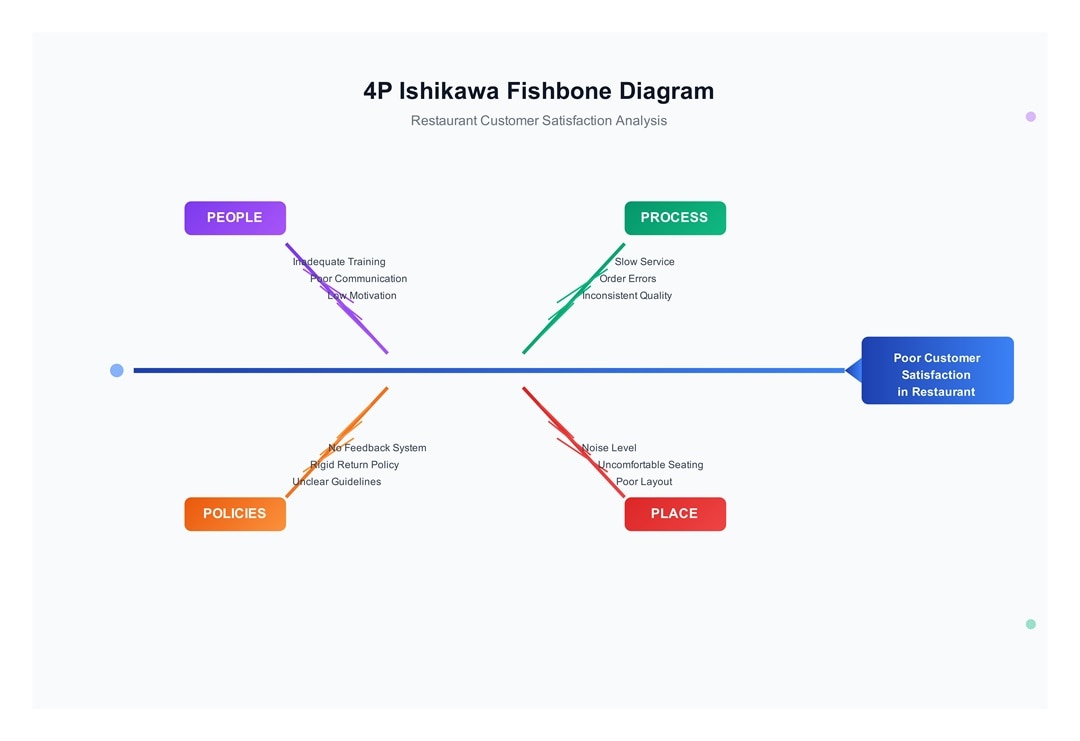
What Are the 4 Ps of the Fishbone Diagram?
Service industries and transactional environments use the "4 Ps" model. These four categories include People, Place, Policies, and Procedures. This approach organizes potential problems relevant to non-manufacturing processes.
4Ps Fishbone Diagram Template -
What Is the Difference Between Fishbone and 5 Whys?
The Fishbone diagram spans many categories to identify every potential cause. Conversely, the 5 Whys technique digs deep into a single line of inquiry.
One visual tool looks wide to find the scope, while the other drills down to see the specific root.
-
Why Is the Fishbone Diagram Used for Risk Analysis?
Risk analysts use the Ishikawa fishbone diagram to map all potential root causes of an event visually. It forces teams to look past simple symptoms to find underlying system failures.
This comprehensive view supports better risk identification and stronger mitigation strategies.

AI Diagram Generator
Enter your prompt. Upload files if needed. Generate diagrams, charts, or slides instantly.


