



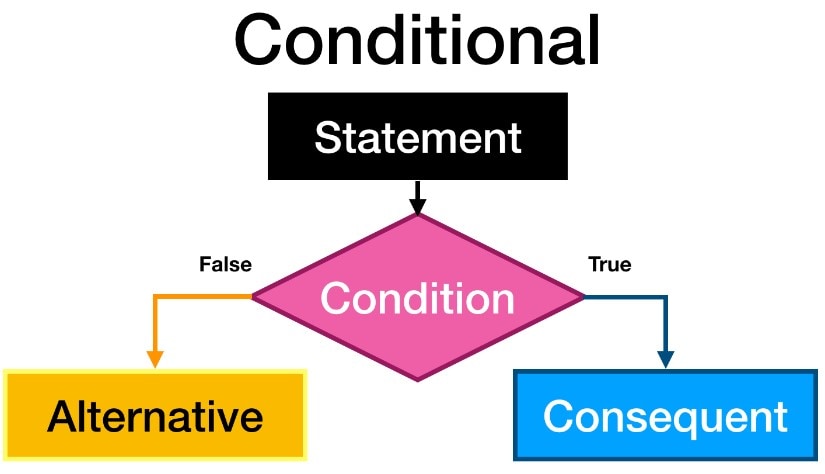
Flowcharts are a visualized solution to resolve potential problems or execute a condition-based computer algorithm. Whenever we are making a targeted flowchart regarding problem-solving or decision-making, we embed a decision box to take two alternative paths. Thus, any flowchart encompassing different routes to dive into a problem's solution falls in the criteria of condition flowcharts.
Given this background, we have composed a comprehensive guide about conditional flowcharts, free conditional flowchart examples, and the step-by-step procedure to construct them.
At a glance: A conditional flowchart uses decision diamonds and labeled branches to show how a condition changes the next step.
In this article
What is a Conditional Flowchart
Conditional flowcharts involve incorporating certain conditions into the encountered situation to solve an issue or make a decision. The simplest elucidation of conditional flowcharts is "All those flowcharts that contain a decision box are regarded as conditional flowcharts". This is because the decision box imposes two different conditions on solving the problem; the next process route depends upon the trueness of the applied conditions.
For example, we check whether a given number is a multiple of 5. We can solve this problem by applying the condition, "Whether the answer after division by 5 equals zero or not". If the answer equals after dividing by 5 comes as zero, the given number would be a multiple of five, and vice versa.
Another example of a condition in flowcharts is whether the train will arrive on time. If yes, take the train and go to the city. On the other hand, if the train doesn't arrive in time, you can travel by bus or plane.
Applications of Conditional Flowcharts
Condition flowcharts can be employed in numerous fields to verify different available solutions for checking whether they work out or not.
The most obvious applications of flowchart conditions are observable in :
- computer programming,
- architecture, business,
- mathematical expressions,
- scientific experiments,
- project management,
- financial policy development,
- information validation,
- making plans,
- etc.
8 Free Conditional Flowchart Examples
Conditional flowcharts consist of various types, such as yes/no, true/false, if/else, and more. Here, we have curated the eight best conditional flowchart examples from EdrawMax for improved perception:
Quick Tip:
EdrawMax provides multiple free and helpful conditional flowchart templates, along with other types of flowcharts and diagrams. You will find complex flowcharts like functional, matrix, and data flowcharts, etc. All are free and easy to download. Click the download button and try it for free!
 Get 500 free AI tokens
Example 1: Algorithm Yes/No Conditional Flowchart

 below.

The above algorithm-based flowchart involves finding the value of x when S equals 15.
The first condition is whether the x is even; if yes, 1 is added to the value of x. If not, you would have to check whether the x lies in odd prime numbers.
In case the x lies in the prime numbers, the next step is identifying whether the x is smaller than S; otherwise, subtract the value of x from S.
If the x is not included in prime numbers, subtract 1 from S and check whether the output comes as S=0. The output value of x will be displayed when S becomes 0.
Example 2: Temperature Conversion If/Else Conditional Flowchart

The above condition flowchart pertains to temperature unit conversion if a particular unit and the magnitude of temperature are given.
The first step involves identifying the given temperature unit; for example, if the given unit is F, you can calculate the value of C by applying the (F-32)x5/9 formula. You can also calculate K when the value of C is found using the former equation through C+273.
On the other hand, if C is given, you can find out f through (Cx9/5)+32; similarly, if K is given, you can evaluate the value of C using the formula K-273.
Example 3: Typical Yes/No Conditional Flowchart

This traditional algorithm flowchart encompasses printing A, B, and C using certain conditions.
The first condition is "Whether A is greater than B"; there are two routes to this condition, yes and no. If A is greater than B and also greater than C, then A would be printed.
On the other hand, if A is smaller than B and B is larger than C, B would get printed.
The third condition is whether C is greater than both A and B; if yes, C would be printed.
Example 4: Management Yes/No conditional flowchart

The above-mentioned conditional flowchart describes a complete procedure for steel product manufacturing, management, maintenance, and shipping to the customers.
The raw material is first supplied to the material department, which inspects the quality by sending it to the Internal Quality Control (IQC). If the quality checking process is performed, the steel is inspected using different methods; after inspection, the steel is cut, bent, and stamped in the industry.
If the stamping is completed, it is welded, sprayed, and sent to the quality check department. After the final evaluation by IQC, the product is transported to the customers.
Example 5: CRM Yes/No conditional flowchart

This simplified conditional flowchart explains the Customer Relationship Management (CRM) process on a proprietary site for getting a custom quote.
The first step entails clicking the CRM website link, entering your ID & password if the account is already created, and adding contact information. If the contact details are not added, navigate to the left side, enter the contact information, and save them.
After adding contact details, order a custom quote by filling in the necessary boxes, such as price, product type, members, etc., and send your requirements via email.
Example 6: PIR Yes/No conditional flowchart

If you have ever used LED-based alarms, you will better understand this conditional flowchart. Passive Infrared Sensors (PIR) operate by sensing temperature changes or particle motions to predict the threat.
In the above flowchart, the PIR LED sensor starts working by f
AI Diagram Generator
Enter your prompt. Upload files if needed. Generate diagrams, charts, or slides instantly.




 (AI & Web)