


The Fishbone diagram, also known as the ishikawa diagram, is crucial in root cause analysis as it familiarizes you with the potential reasons behind a specific problem. In addition, it enables you to understand the areas that need improvement.
Read further to learn more about this diagram and an easy way to create it within minutes using excellent diagramming software.
In this article
Part 1. What Is a Fishbone Diagram?
A Fishbone diagram is also called an Ishikawa diagram, root cause analysis diagram, Herringbone diagram, and Cause and Effect diagram. In 1990, Kaoru Ishikawa introduced the term “Fishbone diagram” for the first time.
How Does this Diagram Work?
The Fishbone diagram identifies various factors that can lead to a problem to make it easy for you to eliminate the problem at any stage. Simply put, this diagram helps you identify the root cause of a problem. You can develop an efficient solution to eliminate the problem using the outcomes.
Implementing the Fishbone diagram during the development brainstorming session helps you find the roots of a particular problem or highlight the bottleneck in a specific process. This is done by dividing the root causes of problems into different categories.
Key Elements of a Fishbone Diagram
Generally, the Fishbone diagram has three elements, i.e., the head, the spine, and the branches. The head of the fish assists you in recording a specific problem. The spine or backbone connects all the causes of the problem. At the same time, the bones or branches present all reasons that can result in the main problem.
Well, the elements of the Fishbone diagram may vary depending on the nature of the industry. The critical elements of this diagram for the manufacturing industry are 5Ms, as listed below.
1. Manpower: It is associated with anything that deals with people, like quality control specialists, maintenance teams, operators, supervisors, employees, etc.
2. Machine: It covers all equipment and machines used in the manufacturing process that causes any problem. The causes of problems can be related to assembly, usage, or maintenance.
3. Method: Operators may need to follow the instructions accurately. This is why an evaluation process must ensure everything is going in the right direction.
4. Material: All the resources and supplies required for manufacturing are called material. Improper inspection, mishandling, material defect, and low quality can cause severe problems.
5. Measurement: The tools, strategies, or techniques followed to measure quality standards also play a crucial role in Fishbone analysis.
Potential Benefits of Fishbone Diagram for Root Cause Analysis
The Fishbone or Ishikawa diagram offers a long list of benefits, including the major ones below.
- The most significant benefit of the root cause analysis diagram or Fishbone diagram is finding the leading causes of the problem.
- This diagram helps you reveal the bottlenecks in a particular process or weak areas. As you get into the detailed specific problem, you get familiar with all areas of weakness.
- Accelerating the problem-solving process is another leading benefit of the Fishbone diagram for root cause analysis.
Part 2. Understanding 5 Examples of Fishbone Analysis
A list of the 5 Ishikawa root cause analysis diagram examples is attached below. These examples will help you learn how this diagram works.
1. Fishbone Medical Diagram
The root cause analysis Fishbone template below presents how you can live a healthy and good life. You can look at various ways to improve the quality of your life. This diagram consists of four main branches that are further divided into sub-branches. Each sub-branch deals with different parameters, like physical activity, gyming, maintaining mental health, meditating, writing, etc.

 below.
  below.
2. Pet Caring Fishbone Diagram
Nowadays, everybody has a tight and busy schedule. The same is the case with pet owners. Some pet owners can’t spend enough time with their pets due to their hectic routines and they become unhealthy. At the same time, some people have insufficient resources to maintain the health of their pets. This is where the below pet caring Fishbone diagram comes in handy.

3. Reducing Carbon Footprint Fishbone Diagram
This Fishbone diagram root cause analysis example tells how you can improve your living standard by reducing water wastage. This diagram has three main branches, i.e., easily distracted, low cold tolerance, and habit. These branches highlight the problem that leads to water wastage. You can avoid doing the listed tasks (like letting the water run when bathing) to reduce the wastage of water.

4. Fishbone Manufacturing Diagram
This root cause analysis Fishbone template presents the potential causes associated with the manufacturing process. It has eight branches in total, and every branch has different sub-causes. The leading branches include; management, measurement, material, maintenance, environment, manpower, method, and machine. These are known as 8Ms.

5. Fishbone Labs Diagram
The Fishbone diagram has been considered an effective way to show lab investigations and clinical results in recent times. To get the maximum out of this Ishikawa root cause analysis diagram, the laboratorian should be familiar with all instruments, procedures, and supply chains. Simply put, this Fishbone diagram identifies all the major causes of a problem and highlights the areas of improvement.

Part 3. How Can You Make a Fishbone Analysis Diagram in Minutes?
Do you want to make your Fishbone diagram template? Searching for an efficient and dependable tool to get this job done for you? If yes, give Wondershare EdrawMax a try today. You will be surprised to see what the free diagram maker has for you.
What Sets EdrawMax Apart?
The factors listed below take EdrawMax to the next level.
- It carries 280+ diagrams, 15,000+ templates, and 26,000+ symbols
- Beginner-friendly user interface
- Quick and reliable diagramming solution
- Easy customization
- Effective collaboration
- Trusted by world-leading brands and millions of users
A Step-By-Step Guide to Creating a Fishbone Analysis Diagram Using EdrawMax
Creating your Fishbone diagram with Wondershare EdrawMax is super easy. You have two options, i.e., making it from scratch or using a pre-built template. Let’s look at the steps you must follow.
Step1
Download, install, and open the tool on your system. Once done, create your account and log in.
Step2
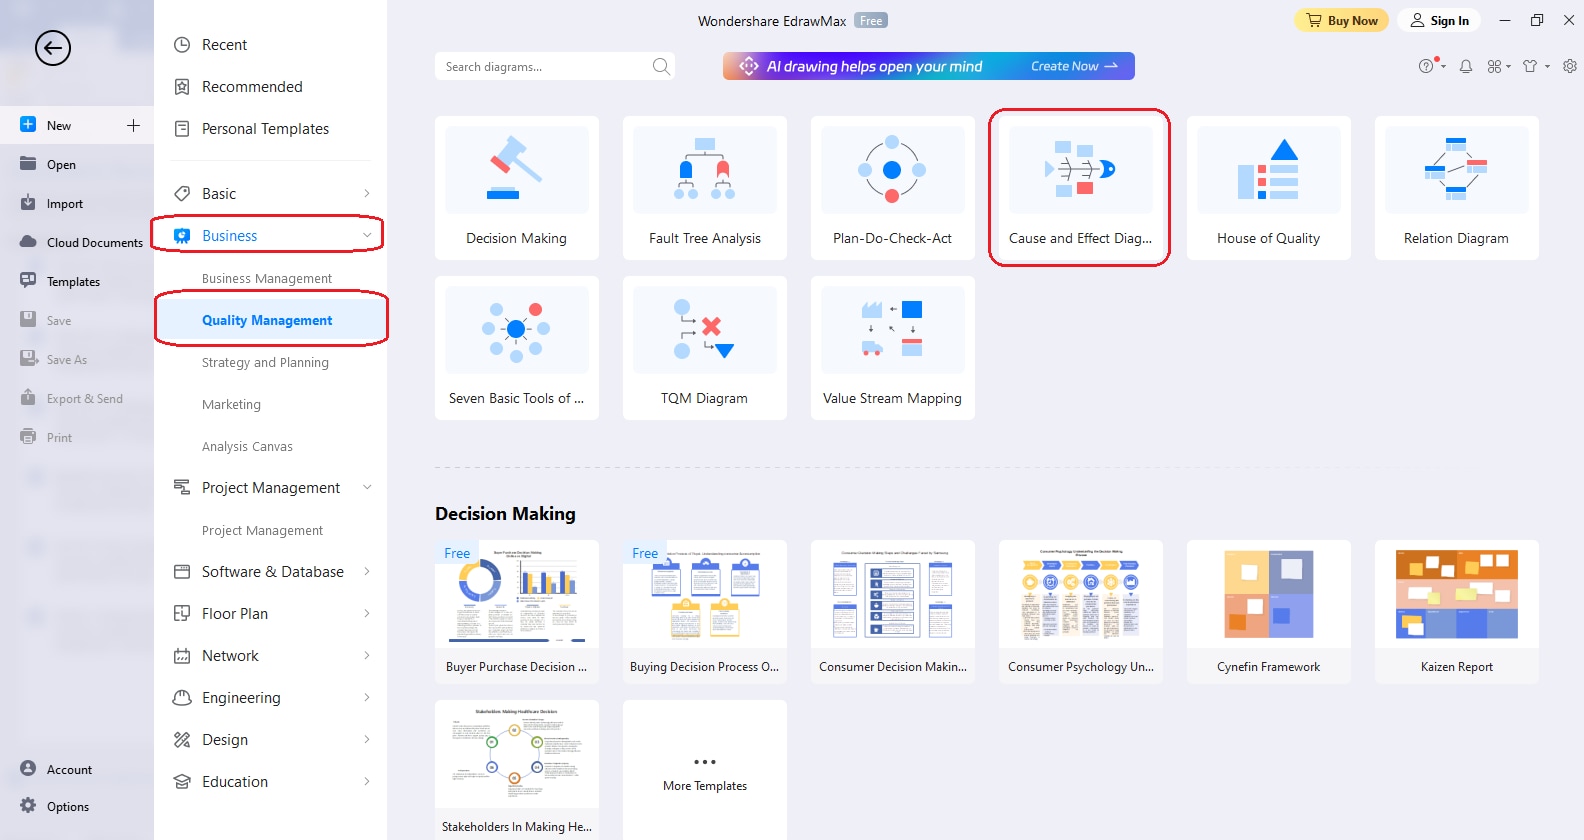
Go to the “New” option by entering the “File” menu. Then, tap on “Management” and hit the “Cause and Effect Diagram” icon.
Step3
Now, you can select any Fishbone diagram template, keeping your requirements in mind. If you don’t want to use a built-in template, you can make this diagram from scratch.
Step4
Customize the chosen template according to your needs.
Step5
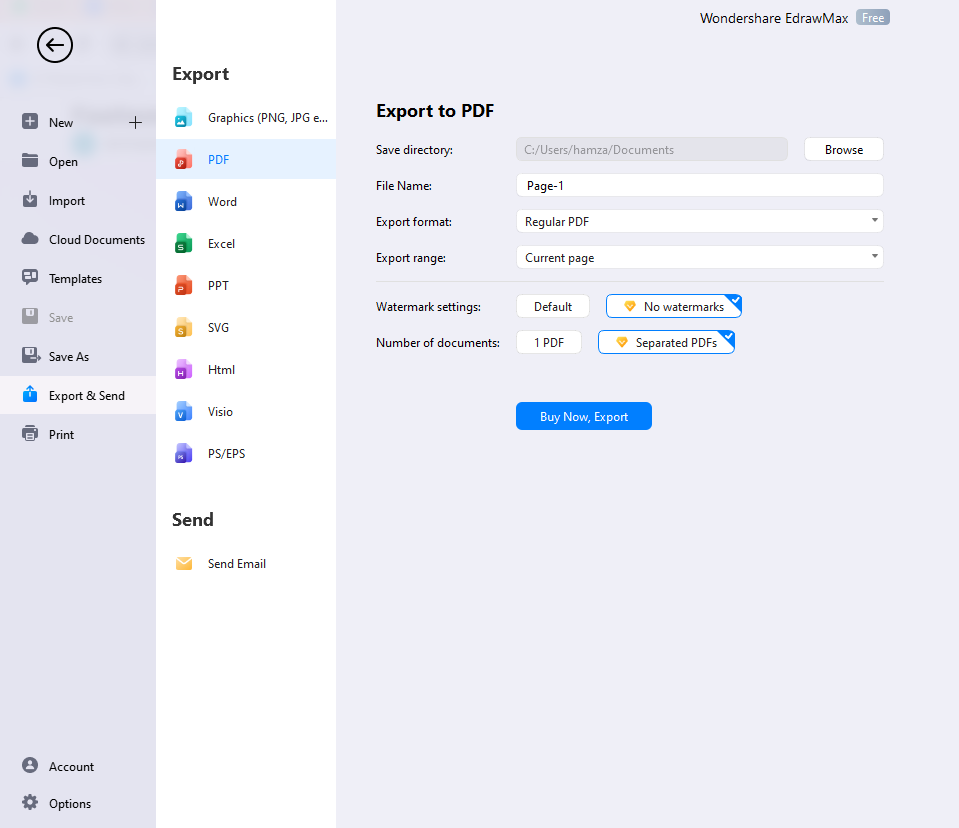
Export the final diagram from the “File” menu. For this, hit the “Export & Send” option and choose the output format from the list, as shown below.
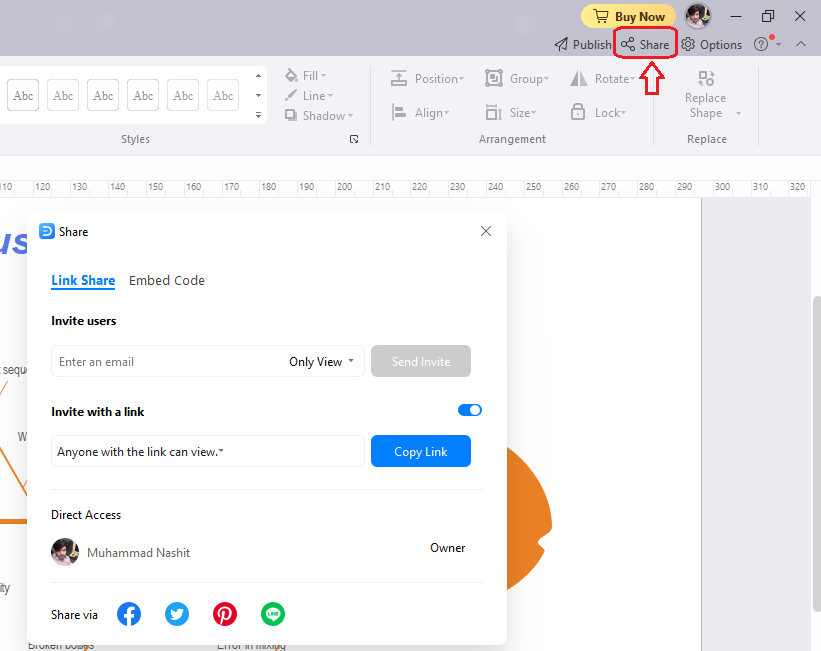
If you want to share this diagram, click the share button from the top-right corner, as shown below.
Ending Note
The Fishbone diagram or root cause analysis diagram highlights the leading causes of a problem. This way, avoiding the problem becomes easy and efficient. How this diagram plays its part in root cause analysis is presented above with 5 best examples. Try Wondershare EdrawMax if you want to make your own Fishbone diagram.
[没有发现file]AI Diagram Generator
Enter your prompt. Upload files if needed. Generate diagrams, charts, or slides instantly.


