


A Data Flow Diagram (DFD) indicates the flow of data within a system. It can be used in e-commerce to trace activities such as visiting products, adding them to a basket, and making payments. This simplifies the complex systems.
DFDs are essential in the case of online shopping platforms. They visualise the interaction of users and databases and payment systems. When developers and businesses view these flows, they are able to increase efficiency, minimize mistakes, and provide flowing shopping experiences.
This article will tell you what a **Data Flow Diagram (DFD)** is, its main elements, examples, and how it can be used in the real world in online shopping. You will also see how to create one with EdrawMax. At the end, you will be prepared to create clear and useful DFDs.
In this article
What is a DFD for Online Shopping?
A Data Flow Diagram (DFD) is a plain drawing representing the flow of data in a system. It describes the sources of data, their processing, and the destination. DFD assists us in viewing the entire picture in a clear manner in online shopping.
A DFD in an e-commerce site depicts the process, such as searching for and purchasing products, adding the product to the cart, and making payments. It simplifies the line of communication. It demonstrates how customer information is sent to the system or how payment is sent to sellers.
DFS is not similar to diagrams such as UML. UML is applied to more coding and design details. **DFDs** are simplified and concentrate on the movement of data only. This renders them handy to both business teams and developers.
In the case of online stores, a **DFD** aids in minimizing errors. It demonstrates whether or not there are any missing data flows or a lack of clarity. Browsing, ordering, and payment teams: When teams know how these three connect, they can enhance customer experience and design. DFDs provide a diagram of the step-wise shopping processes.
Levels of DFD for Online Shopping Explained
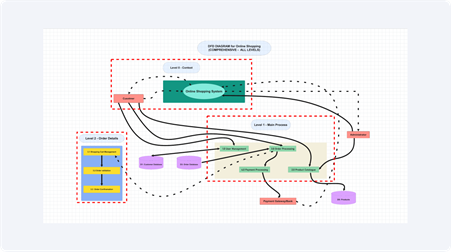
Data Flow Diagrams are constructed at more detailed levels. In the case of online shopping systems, these levels would aid in understanding the way customer requests are processed by processes such as search, order, and payment. I want to deconstruct them one step at a time.
Level 0 – Context Diagram
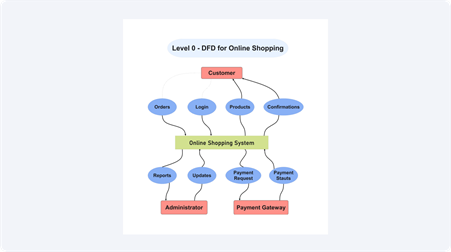
Level 0 is the highest view. In this case, the online shopping portal is presented in a single large process. There is an interface of the system with external entities such as the **customer**, **payment gateway**, and **suppliers**. Product requests, payments, and confirmations form part of the data flows. This perception is most suitable when it comes to brief reviews.
Level 1 – Main Processes
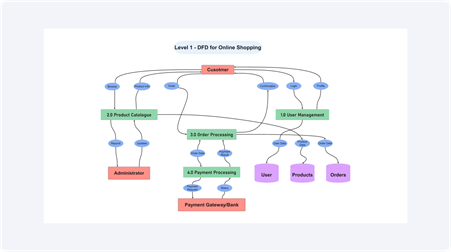
In Level 1, the large process is divided into small ones. In the case of shopping online, this involves **searching for a product**, **adding it to the cart**, and **checking out**. Every step will be linked to such data stores as customer profiles or product databases. This aids in the visualization of customer action interrelations.
Level 2 – Detailed Flows
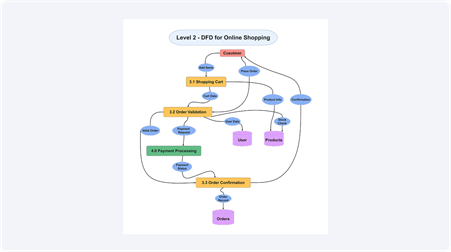
Level 2 takes things deeper. An example is that the system checks inventory during checkout to ensure that a check is made on whether items are present, and requests the gateway to check on payment. The system updates the stock as soon as the payment clears, the order becomes confirmed, and the customer is notified. This level is described in the procedure.
Together, the levels enable the businesses and developers to know more and more about the workflows, starting with an overall background of workflows and step-by-step operations.
Key Components of an Online Shopping DFD
The components that are used to construct a **Data Flow Diagram (DFD)** of online shopping consist of a number of key components, which are the representations of the flow of data across the system. All the components have a distinct purpose in visualizing user-process-data interplay. We can consider these elements individually.
Entities
The external parties that engage the system are the entities. The important players in online shopping are:
- Customer: searches products, adds purchases to the cart, and makes orders.
- Admin: handles the stock, changes the product information, and monitors the sales.
- Payment Gateway: handles the security of a payment between the customer's bank and the system.
- Inventory System: makes sure that after every purchase, there is an update on the availability of the products.
Processes
Actions that are undertaken in the system are called processes. For example:
- Product Search: customers are allowed to enter keywords, and the system retrieves products that match the keywords.
- Order Placement: involves placing goods in the cart and placing orders.
- Payment: verifies details with the gateway and confirms transactions.
- Delivery: it is used to connect with the logistics to report shipments.
Data Stores
Data stores store important data:
- Product Database: contains details about the product price, product description, and stock.
- User Accounts: store login credentials, wishlists, and order history.
- Order Records: keep invoices, payment confirmations, and tracking IDs.
Data Flows
All the above are tied together with data flows. An example is a customer transmits **login information** to the **User Account** database, or the **Payment Gateway** transmits **approval information** to the **Order Records**.
How to Create a DFD for Online Shopping in EdrawMax (It's Free)
Would you like to create a DFD for an online shopping site? With **EdrawMax**, it’s simple. It is a time-saving tool because it offers ready-made templates and symbols. You may choose a blank canvas or choose an existing template and modify it to create a professional diagram. You can create a DFD diagram for online shopping by following these steps:
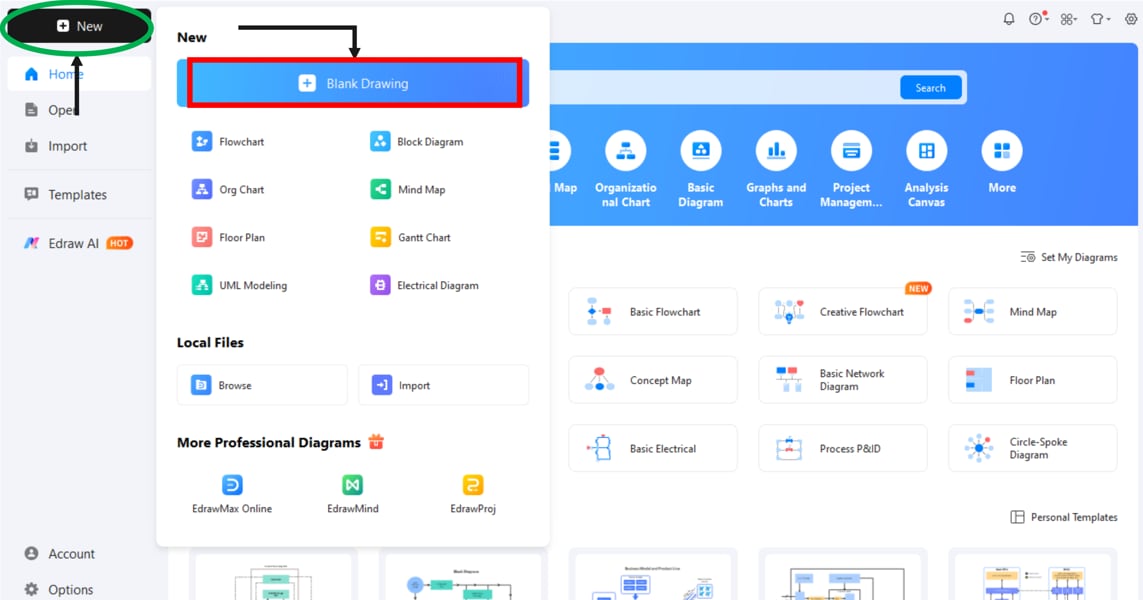
Step 1Open a Blank Canvas
Launch **EdrawMax** on your computer. Click New from the left panel. Select Blank Drawing to start with a clean workspace.
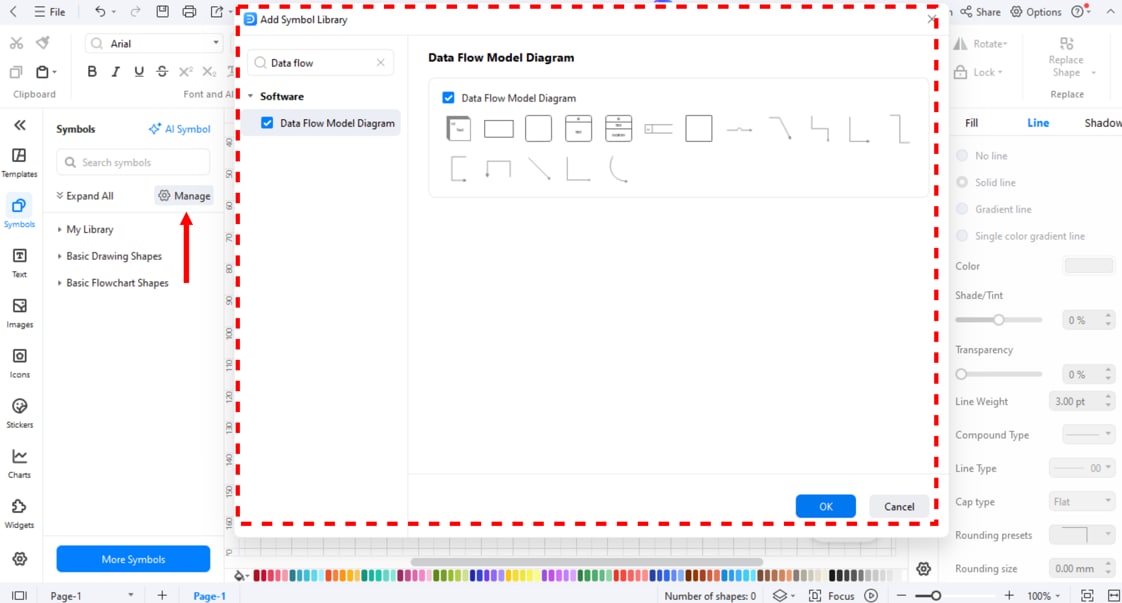
Step 2Enable DFD Symbols
Go to Symbols in the left menu. Click Manage and then Add More Symbols. From the list, enable DFD Modeling symbols. The library with all DFD symbols will appear.
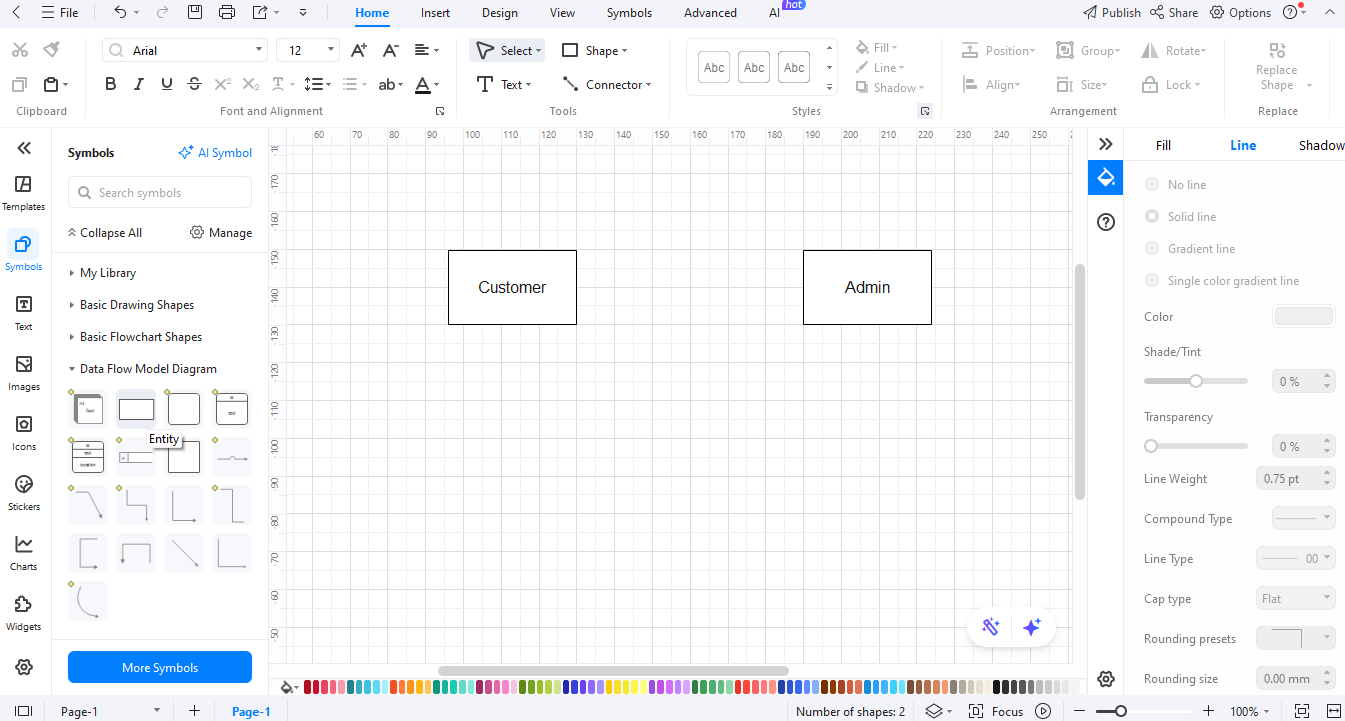
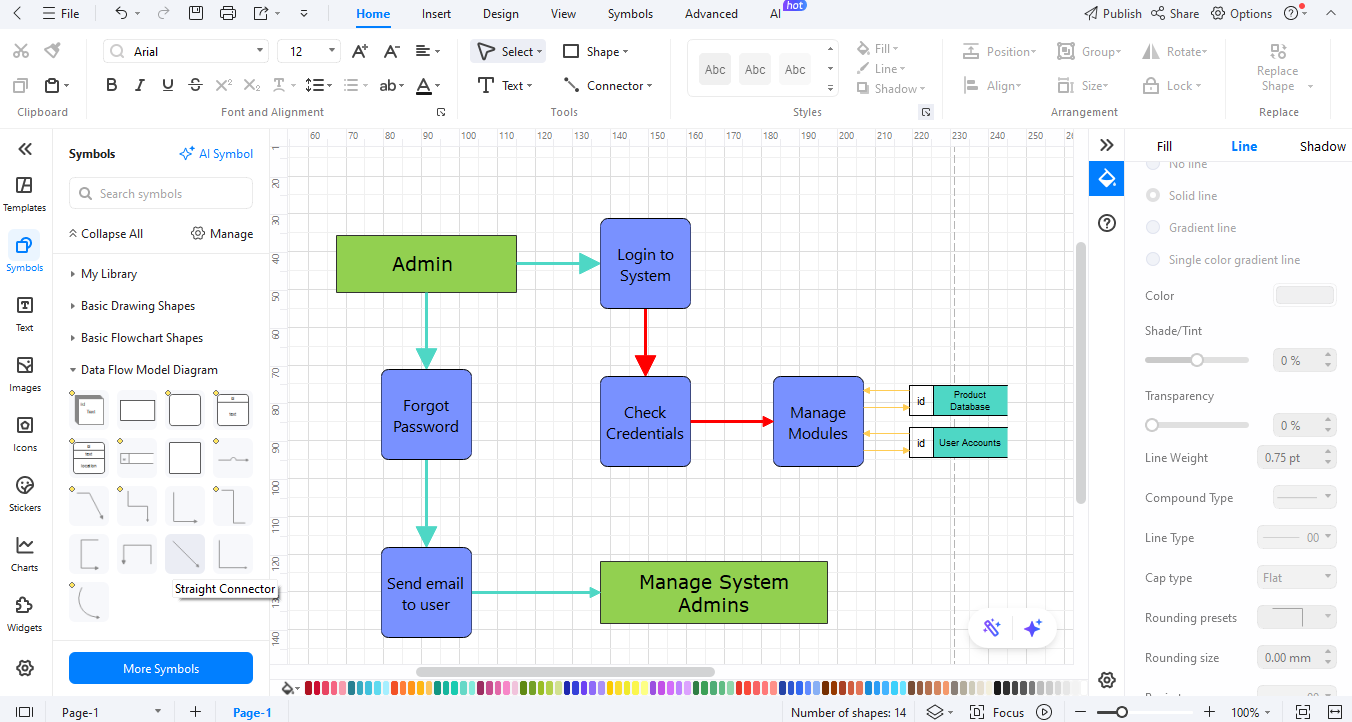
Step 3Add Main Entities
Drag external entities like Customer, Admin, and **Payment Gateway** onto the canvas. These are the individuals or systems that are in contact with your web store.
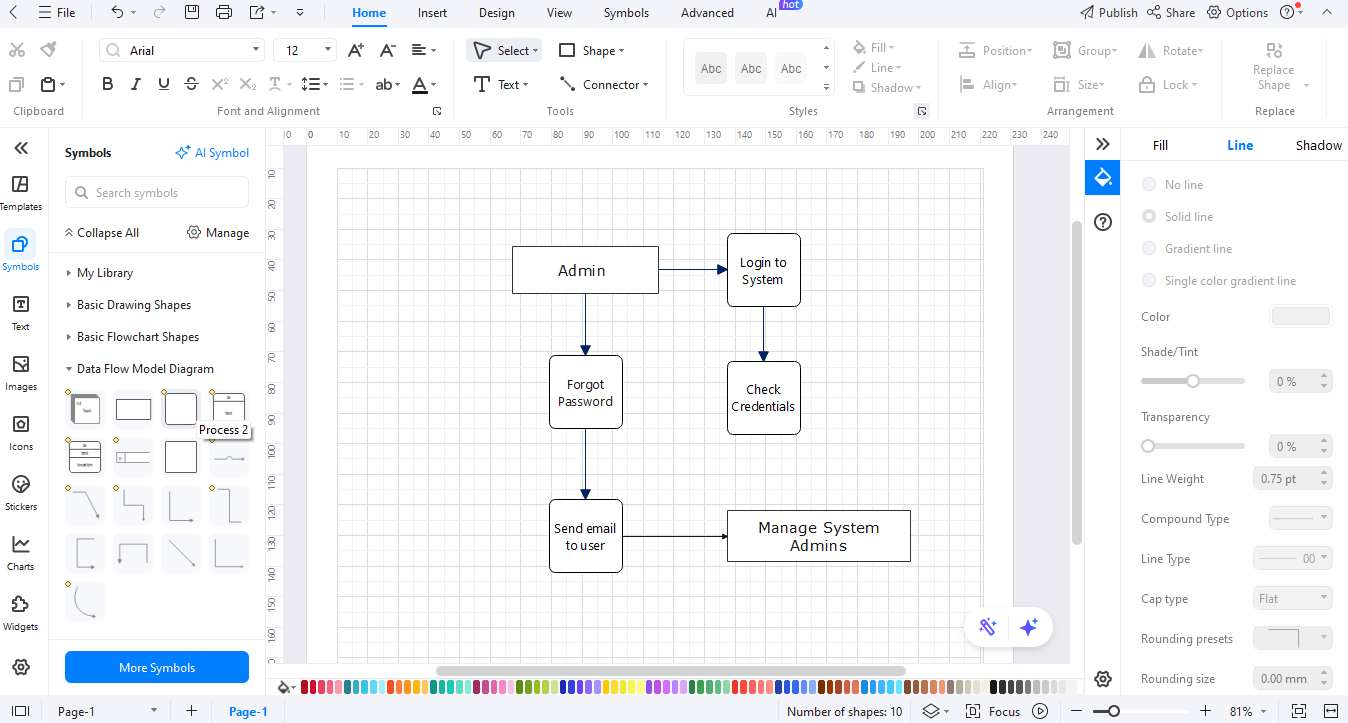
Step 4Insert Core Processes
Add the main processes of the system. **Search by Product** - to navigate. **Order Placement** - as customers add items to the cart. **Checkout** - payment and shipping information are typed. **Delivery** - the last phase that presents order fulfilment.
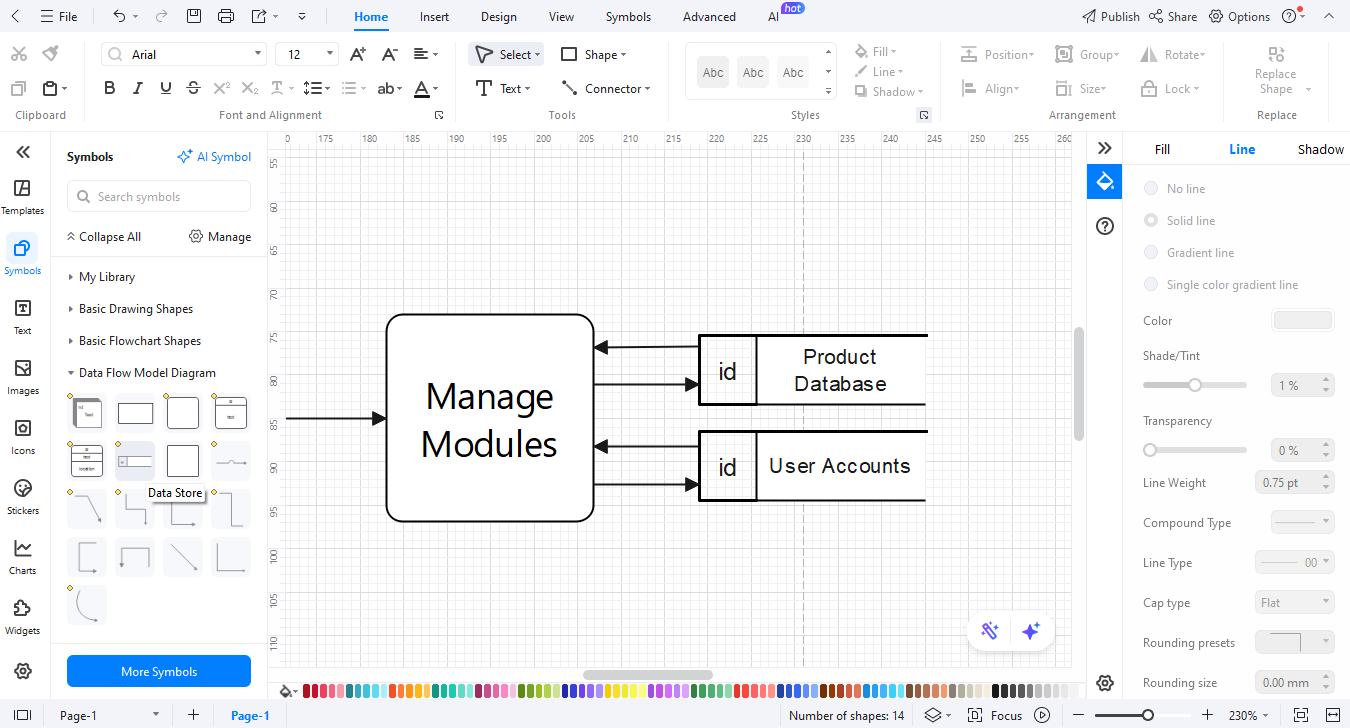
Step 5Add Data Stores
Next, put the information in the databases: **Product Database** - stores product details. **User Accounts**- stores customer and login details. **Order Records** - orders that have been placed and finished. These symbols demonstrate the location of system saves or retrievals.
Step 6Connect with Data Flows
Demonstrate the flow of data: Customer - Product Search - Product Database (Search Request). Order Placement - Order Records (Order Info). Checkout - **Payment Gateway** (Payment Details).
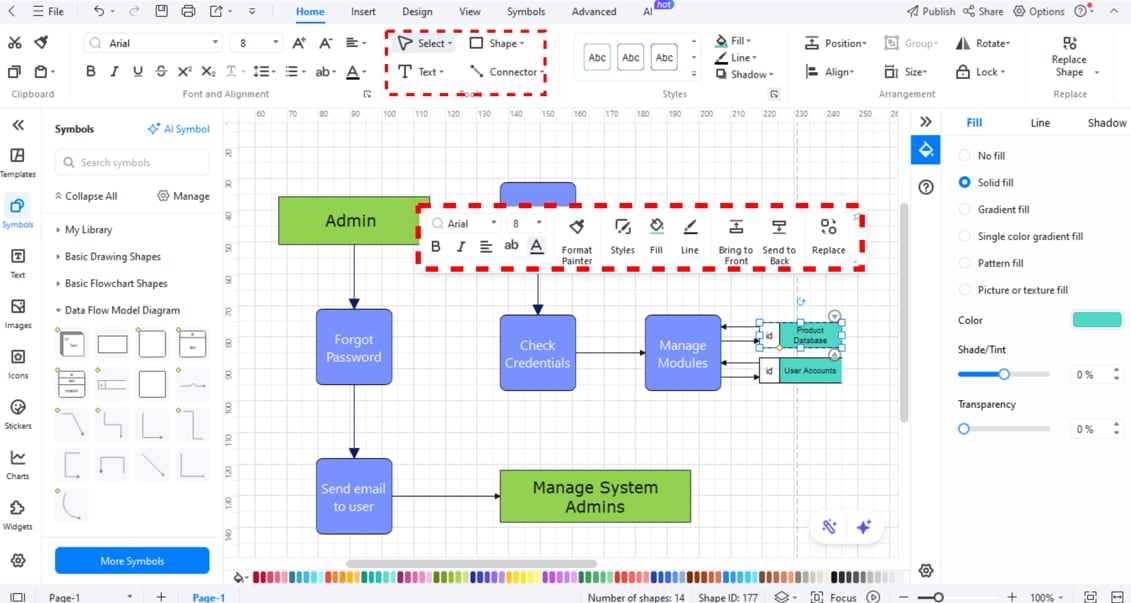
Step 7Refine with DFD Levels
Divide the diagram into layers by using labels and annotation tools: **Level 0** (Context Diagram): Customer, System, Payment Gateway. **Level 1** (Processes): Search, Cart, Checkout. **Level 2** (Detailed View): Inventory Check, Payment Verification, Order Confirmation. You can change colors, fonts, and alignment for readability. In such a manner, one is able to clearly see the details as one watches the high-level overview, narrowing down to particular details.
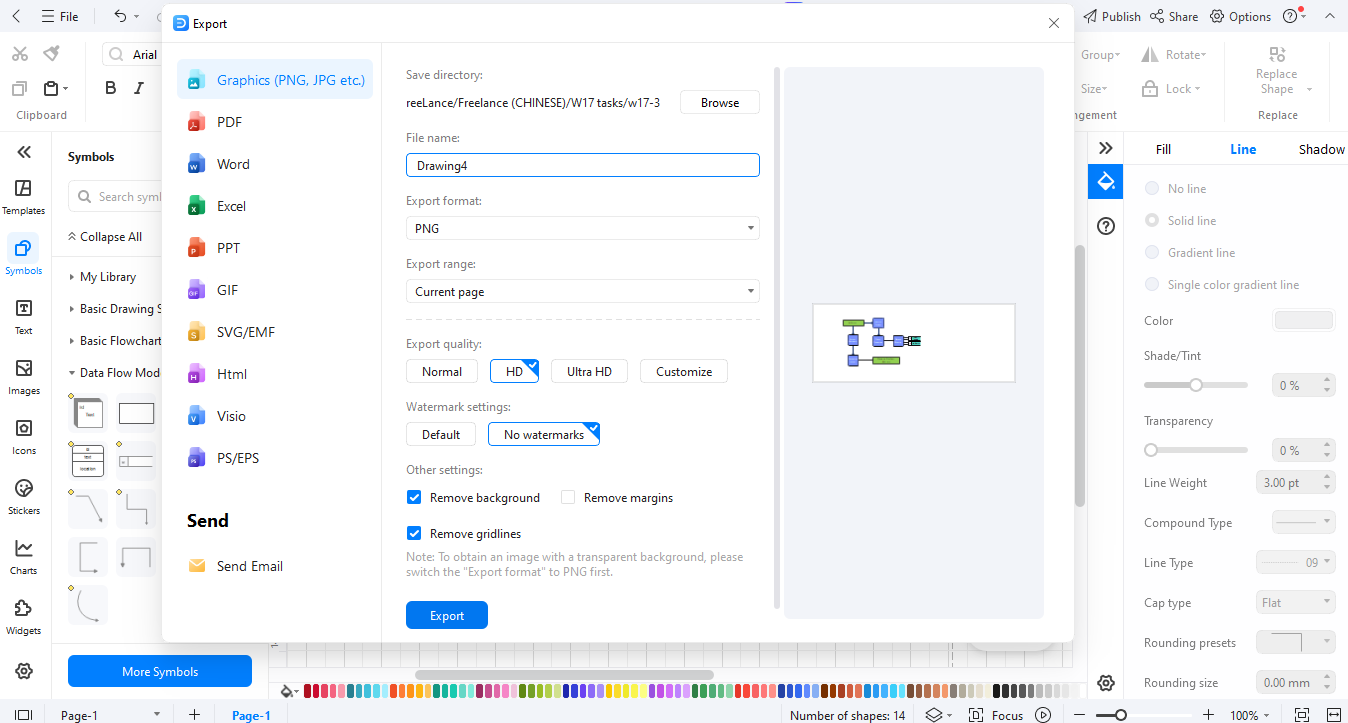
Step 8Export the Finalised Diagram
Use consistent symbols across all levels. Once finished, export the diagram as **JPG**, **PNG**, **PDF**, or **Word**.
Benefits of Using DFD in Online Shopping Systems
Applying the **Data Flow Diagram (DFD)** to online shopping systems design presents a number of practical benefits that have a direct effect on efficiency and reliability.
-
Clarity in Workflows
DFDs graphically depict the flow of information among the customers, the system, and the outside world. This is clear enough to enable technical stakeholders and non-technical stakeholders to have a clear view of how the shopping process works, and this includes searching for products and delivering the orders.
-
Error Reduction in Requirements
DFs simplify the identification of missing requirements or possible bottlenecks by providing processes and data flows step by step. As an example, when payment verification is not explicitly connected with order confirmation, it can be resolved in advance.
-
Improved Communication
DFs have straightforward symbols and flows, and therefore overcome the obstacles between the developers, the business managers, and the clients. The same diagram can be seen by everyone and keeps everyone on the same page regarding system expectations.
-
Scalability Support
DFDs can be used as a guide to the expanded features when the business increases. As an example, documentation of processes and data flows makes it easier to add new payment gateways or delivery partners.
Final Words
Data Flow Diagrams simplify the view of how the online shopping systems operate. They reveal the origin of data, its flow, and the destination. Such a clear picture contributes to the identification of the issues and the betterment of the system.
Drawings of these diagrams have been simplified and quickened in **EdrawMax**. You do not need to start with a blank piece of paper, and all you need is to choose one of the templates and customise it. At this point, you may start building your own diagrams using Try **EdrawMax** free of charge.
AI Diagram Generator
Enter your prompt. Upload files if needed. Generate diagrams, charts, or slides instantly.


