


Introduction
In the era of system analysis and design, Data Flow Diagrams (DFDs) serve as indispensable tools for visualizing and organizing information flow within a system. Understanding how to construct both Logical and Physical DFDs is crucial for effective system development. This comprehensive guide will walk you through the step-by-step process to create logical and physical DFD and empower you to design systems with precision and clarity.
In this article
Logical vs Physical Data Flow Diagrams: A Brief Overview
Definition:
- Logical DFD: Offers an abstract view of data flow, emphasizing processes and data sources/destinations without implementation specifics.
- Physical DFD: Details the concrete implementation, specifying hardware, software, databases, and networks involved in data flow.
Main Focus:
- Logical DFD: Prioritizes processes and data transformation, regardless of implementation details.
- Physical DFD: Concentrates on actual hardware, software, and network components in the system.
Processes:
- Logical DFD: Represents activities and transformations of data in a system.
- Physical DFD: Specifies how processes are executed, involving specific technologies and tools.
Data Stores:
- Logical DFD: Identifies where data is generated, consumed, or stored in an abstract sense.
- Physical DFD: Details actual databases or storage systems used in the process.
Complexity:
- Logical DFD: Less complex, providing a high-level overview of the system's functionality.
- Physical DFD: More complex, involving specific technical components and their interactions.
Examples of Logical and Physical DFD
Before learning how to craft Logical and Physical Data Flow Diagrams (DFDs), it's crucial to understand their distinct purposes. A Logical DFD abstractly portrays data flow and processes, while a Physical DFD delves into the concrete implementation details. These representations serve as invaluable tools in system analysis and design, offering a comprehensive view of information flow within a system.
Let’s understand the inner workings of physical and logical DFD with the help of an example:
Logical DFD Example – Grocery Store
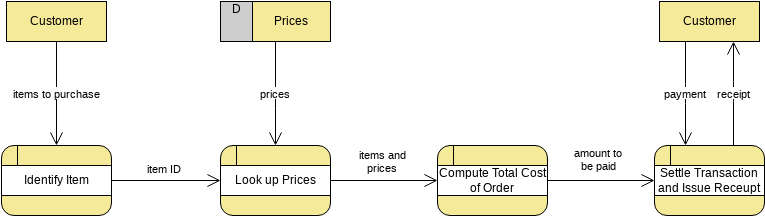
In a logical data flow diagram for a grocery store, processes like "Inventory Management," "Sales," and "Order Processing" are depicted, showcasing how data flows between these activities. It abstractly illustrates how information moves within the system, emphasizing the core functions without delving into implementation details.
Physical DFD Example – Grocery Store
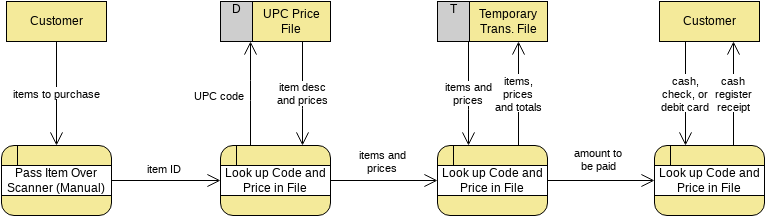
The physical data flow diagram for a grocery store offers a detailed view of the system's implementation. It includes specifics such as the UPC code, bank details, POS terminals, inventory database, and network connections. This diagram provides a concrete representation of the technical components involved in the store's operations.
How to Create Logical and Physical DFD Using Wondershare EdrawMax?
Wondershare EdrawMax's advanced design features and customization options allow users to produce high-quality, visually appealing diagrams. This is crucial for conveying complex information clearly and professionally, which is especially important in system analysis and design. It provides an intuitive and user-friendly interface, making it accessible to both beginners and experienced diagram creators. Its drag-and-drop functionality simplifies the process of designing intricate data flow diagrams.
The software offers a vast library of pre-made templates and symbols tailored for creating data flow diagrams. This saves time and ensures that users have access to the necessary elements for accurately representing processes, data stores, and flows.
Here are the steps to create a logical and physical DFD using EdrawMax:
Step 1: Launch EdrawMax and select the 'Data Flow Diagram' template from the template library to start your diagram. Browse through the extensive library of predefined templates specifically designed for logical and physical DFDs. Choose the template that best aligns with your system requirements.
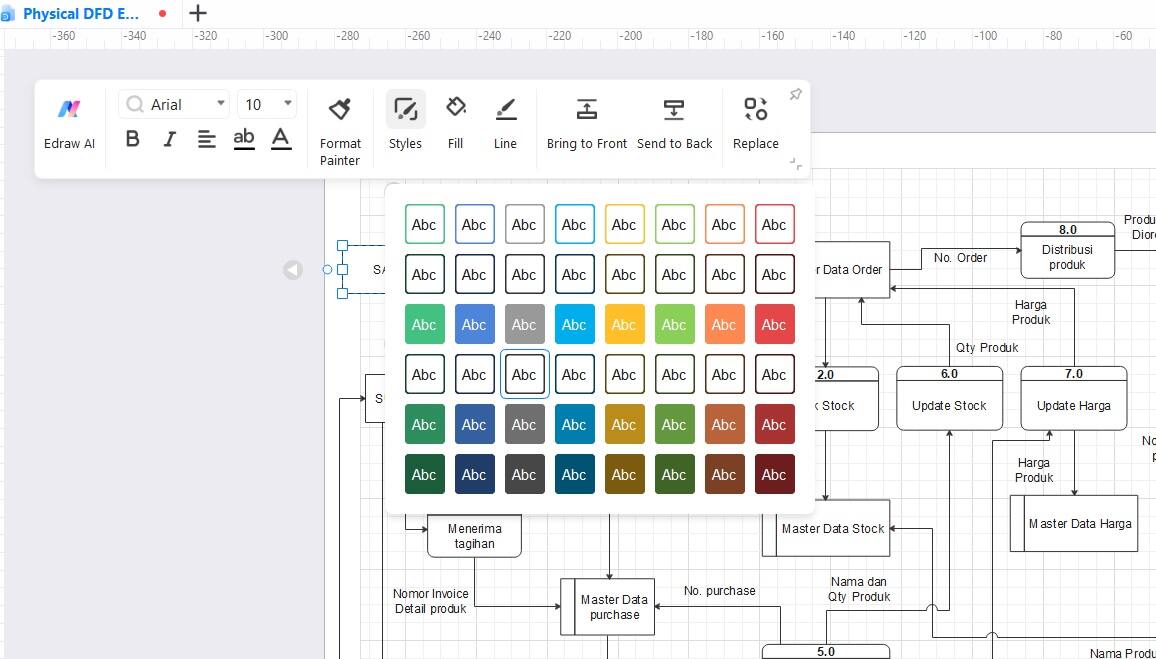
Step 2: Begin by adding processes, data stores, and external entities to the canvas using the drag-and-drop interface. Customize each element with relevant labels and descriptions.
Step 3: Establish data flows between the processes, data stores, and external entities. Use connecting lines and arrows to represent the flow of information.
Step 4: For the physical DFD, incorporate hardware components such as servers, databases, and network devices into the diagram. Specify their connections and interactions within the system.
Step 5: Add any necessary annotations, formatting changes or additional information to provide clarity and context to your DFD.
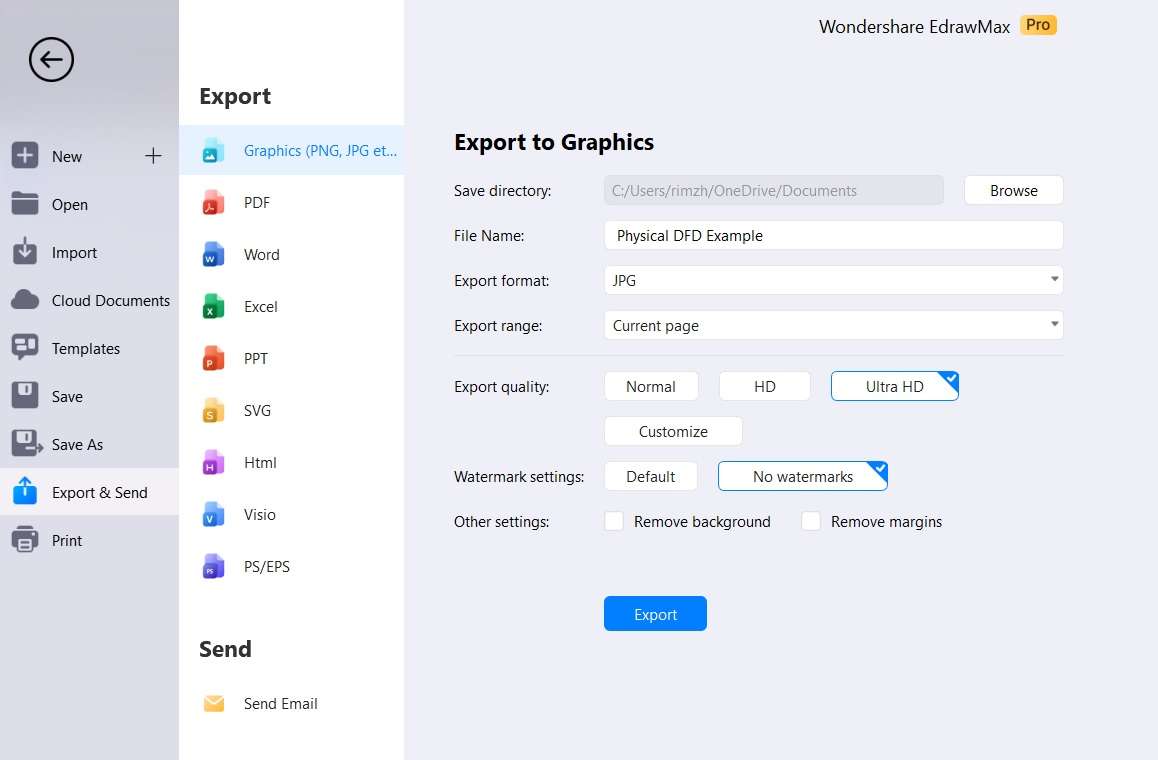
Step 6: Once your DFDmis ready, here is what you need to do. Tap on File> Export and Send. Save your DFD in a preferred format, such as PNG or PDF, for easy sharing and integration with other documents or presentations.
Summary: Logical DFD vs Physical DFD
Creating a logical Data Flow Diagram (DFD) is about understanding how data and processes move in a system without focusing on the technical nitty-gritty. It's more about the big picture and less about the specific ways things are done.
Creating a physical Data Flow Diagram (DFD) means detailing the actual tools like computers, programs, databases, and connections that make the system work. It gives a close-up view of all the technical details that make the system function.
Conclusion
Crafting both Logical and Physical Data Flow Diagrams stands as a crucial proficiency in the realm of system analysis and design. This comprehensive guide empowers you with the know-how to proficiently illustrate information flow within a system.
The logical DFD provides a bird's-eye view, accentuating processes, and data flow while sidestepping intricate implementation details. In contrast, the physical DFD zooms in on the tangible components, meticulously outlining the hardware, software, databases, and networks that underpin the system's operations.
EdrawMax further streamlines this process with its intuitive interface and extensive library of templates, making it an invaluable tool for diagram creation.
AI Diagram Generator
Enter your prompt. Upload files if needed. Generate diagrams, charts, or slides instantly.


