Step into the realm of UML Data Flow Diagrams with our comprehensive guide. From understanding core concepts to hands-on construction, this guide equips you with essential skills. Dive into step-by-step instructions, practical tips, and real-world examples, empowering you to model and analyze data processes effectively.
Get ready to elevate your understanding of system architecture today.
In this article
What is UML?
UML, or Unified Modeling Language, is a standardized visual modeling language used in the field of software engineering. It provides a way to visualize and design a system's structure and behavior. UML uses a set of graphical notations to represent various aspects of a system, such as classes, objects, relationships, activities, and more.
It helps in communicating, understanding, and documenting the architecture and functionality of a software system, making it a valuable tool for software developers, analysts, and designers.
Benefits of UML:
Here are some key benefits of a UML structure:
- Simplifies complex systems for easy comprehension.
- Facilitates clear understanding among project stakeholders.
- Offers a structured blueprint for system architecture.
- Promotes components that can be utilized in future projects.
- Eases updates and enhancements with clear visual guidance.
- Provides a standardized format for comprehensive system records.
- Supports in-depth examination for potential improvements and optimizations.
Types of UML Diagrams
UML diagrams serve as powerful tools for visualizing and designing complex systems, categorized into two main types:
Structural UML Diagrams:
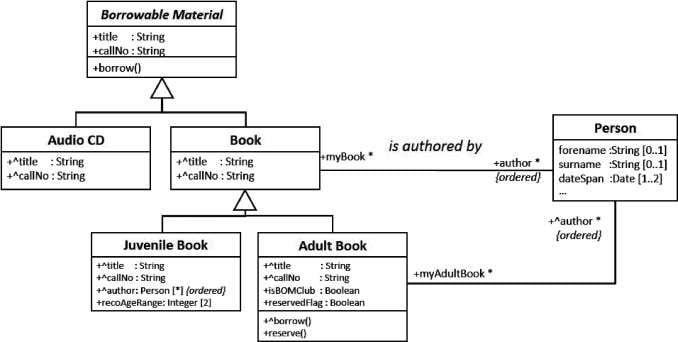
Structural UML diagrams focus on the static elements of a system, illustrating its composition and organization. They include diagrams like Class Diagrams, Object Diagrams, Component Diagrams, and Deployment Diagrams. These diagrams emphasize the elements that make up a system and their relationships.
Behavioral UML Diagrams:
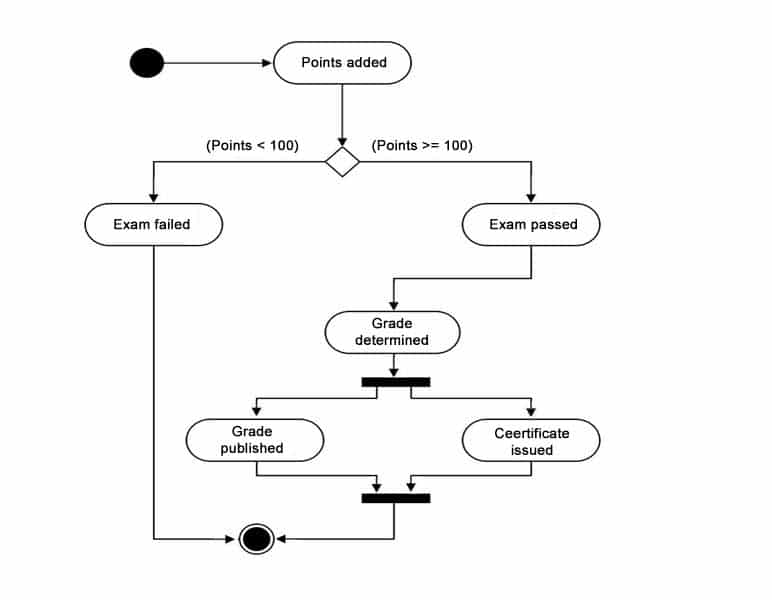
Behavioral UML diagrams emphasize the dynamic aspects of a system, showcasing how it behaves and interacts with external entities over time. They include diagrams like Use Case Diagrams, Activity Diagrams, Sequence Diagrams, and State Machine Diagrams. These diagrams highlight the processes, interactions, and states within a system's operation.
Where to Use Class Diagrams?
Class diagrams are used in software engineering to depict the static structure of a system, showcasing classes, their attributes, methods, and relationships. They provide a high-level overview, aiding in initial design, documentation, and communication among development teams. Class diagrams are indispensable in the early stages of software development, helping stakeholders grasp system architecture. They guide developers in writing code by providing a clear blueprint of class relationships and attributes.
Use Wondershare Endrawmax to create a UML data flow diagram
Wondershare EdrawMax offers a seamless experience for creating UML Data Flow Diagrams. Its intuitive interface and extensive UML symbol library simplify the process, saving users valuable time.
Additionally, its powerful features enable easy collaboration and export options, enhancing team efficiency and project documentation. This tool ensures a smooth and efficient workflow for UML diagram creation.
Furthermore, EdrawMax provides a range of customization options, allowing users to tailor diagrams to their specific project needs. Its user-friendly drag-and-drop functionality ensures a hassle-free design process, even for beginners. With regular updates and a responsive support team, users can rely on EdrawMax for a consistent and reliable UML diagramming experience.
Here are the steps to use Wondershare EdrawMax to create a UML data flow diagram:
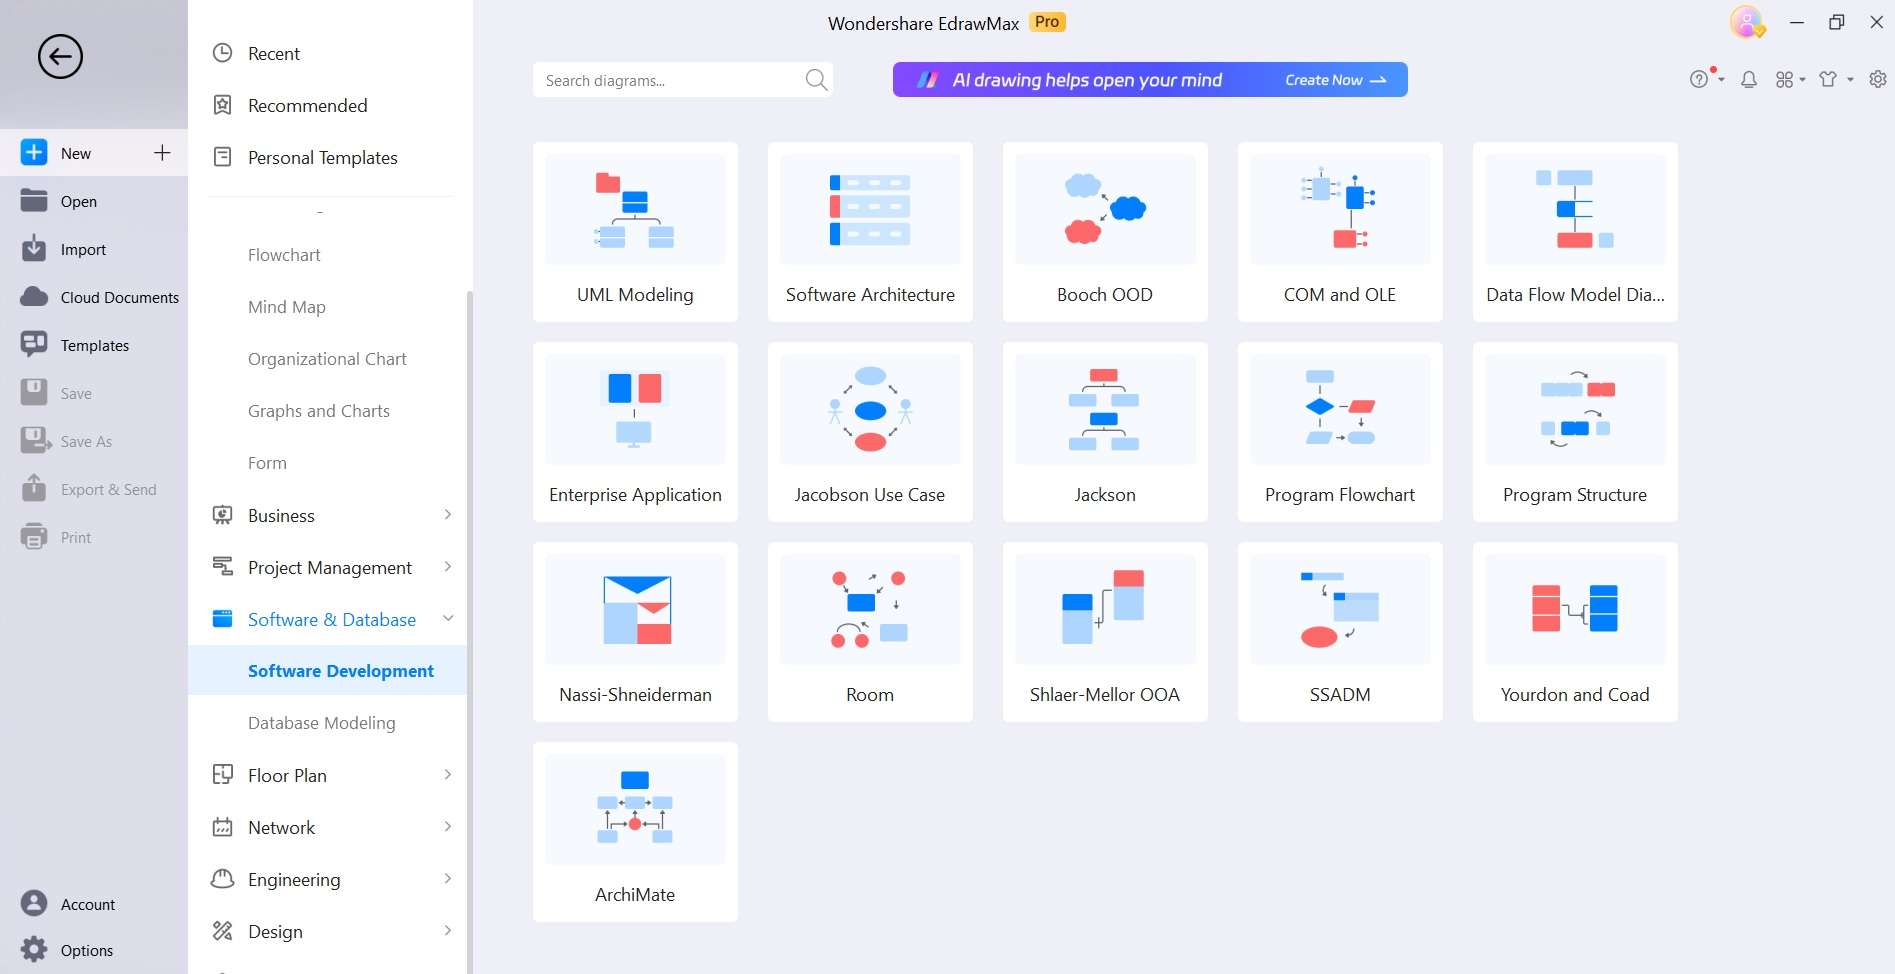
Step 1: Launch EdrawMax, your comprehensive diagramming tool. Navigate to the Software & Database> Software Development category and click on the 'UML Modeling' to kickstart your project.
Step 2: Access a rich library of UML symbols. Drag and drop these onto the canvas to represent processes, data stores, and external entities, aligning them intuitively.
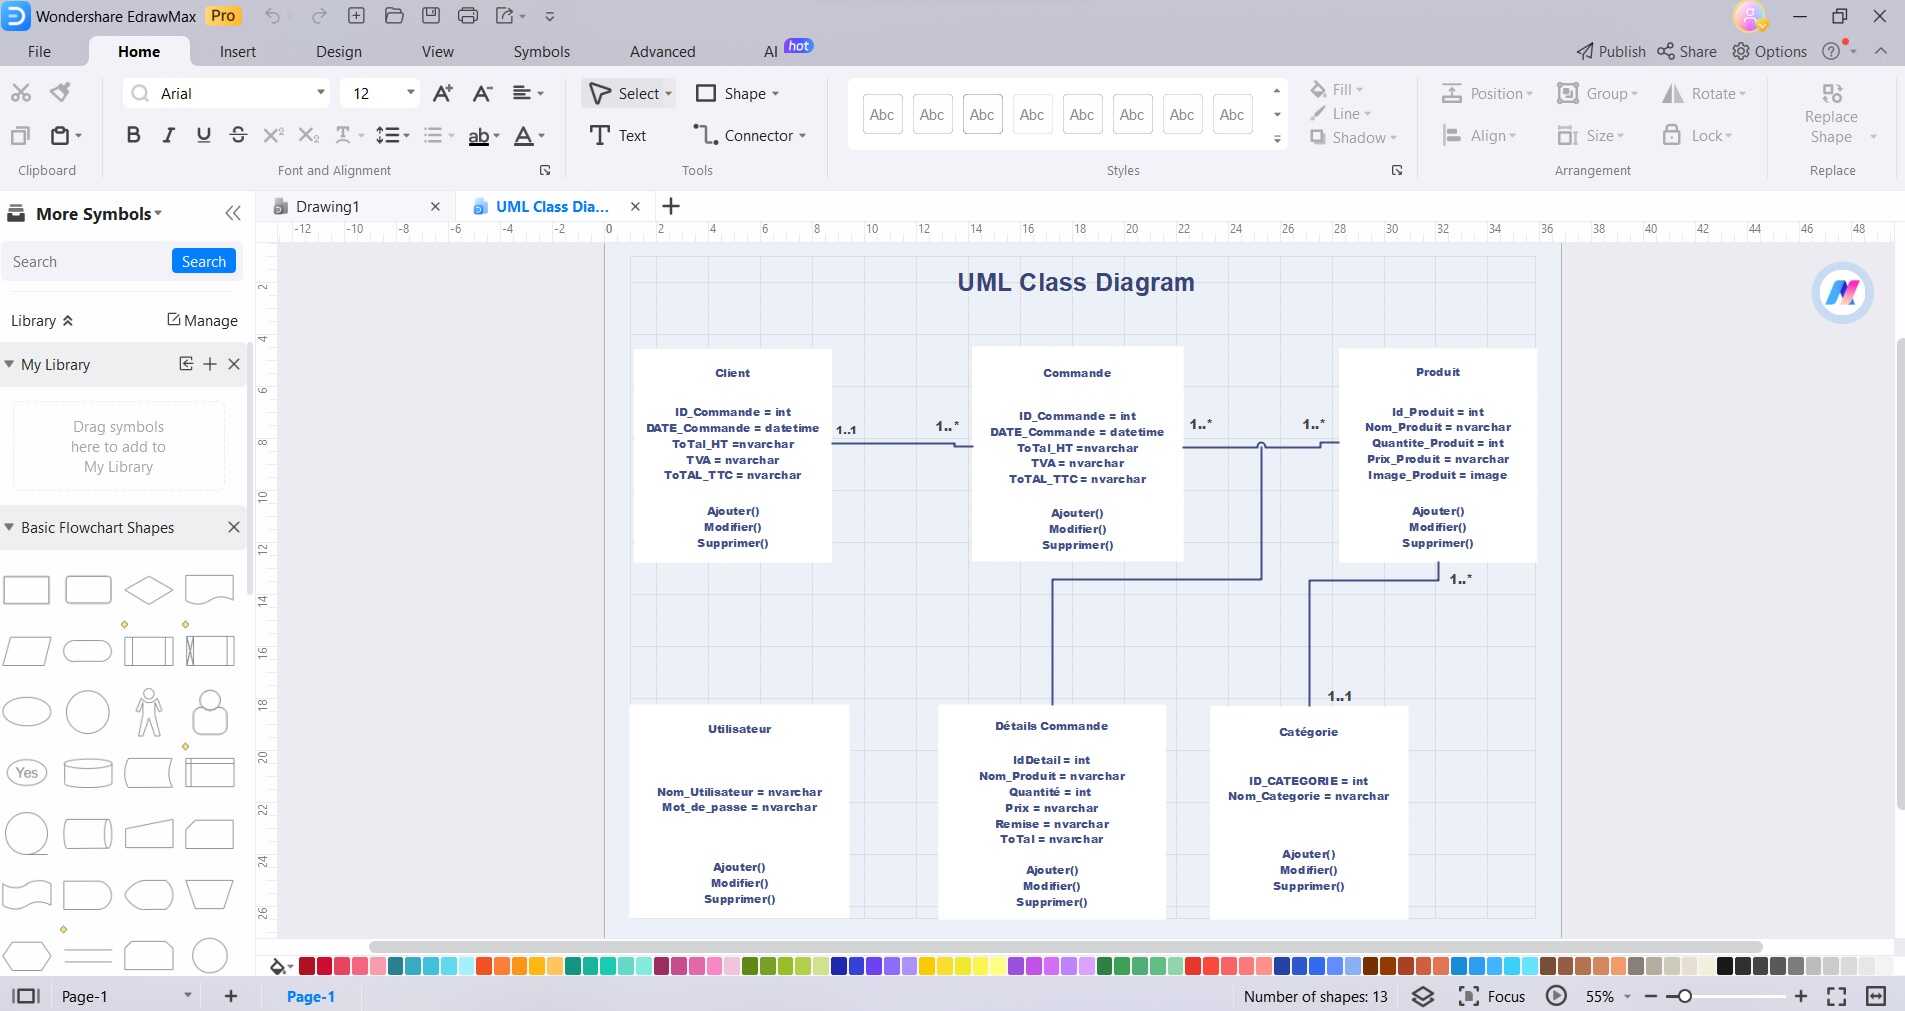
Step 3: Establish connections using arrows to illustrate data flow between elements. Leverage connectors to denote relationships, ensuring a clear representation of the system's dynamics.
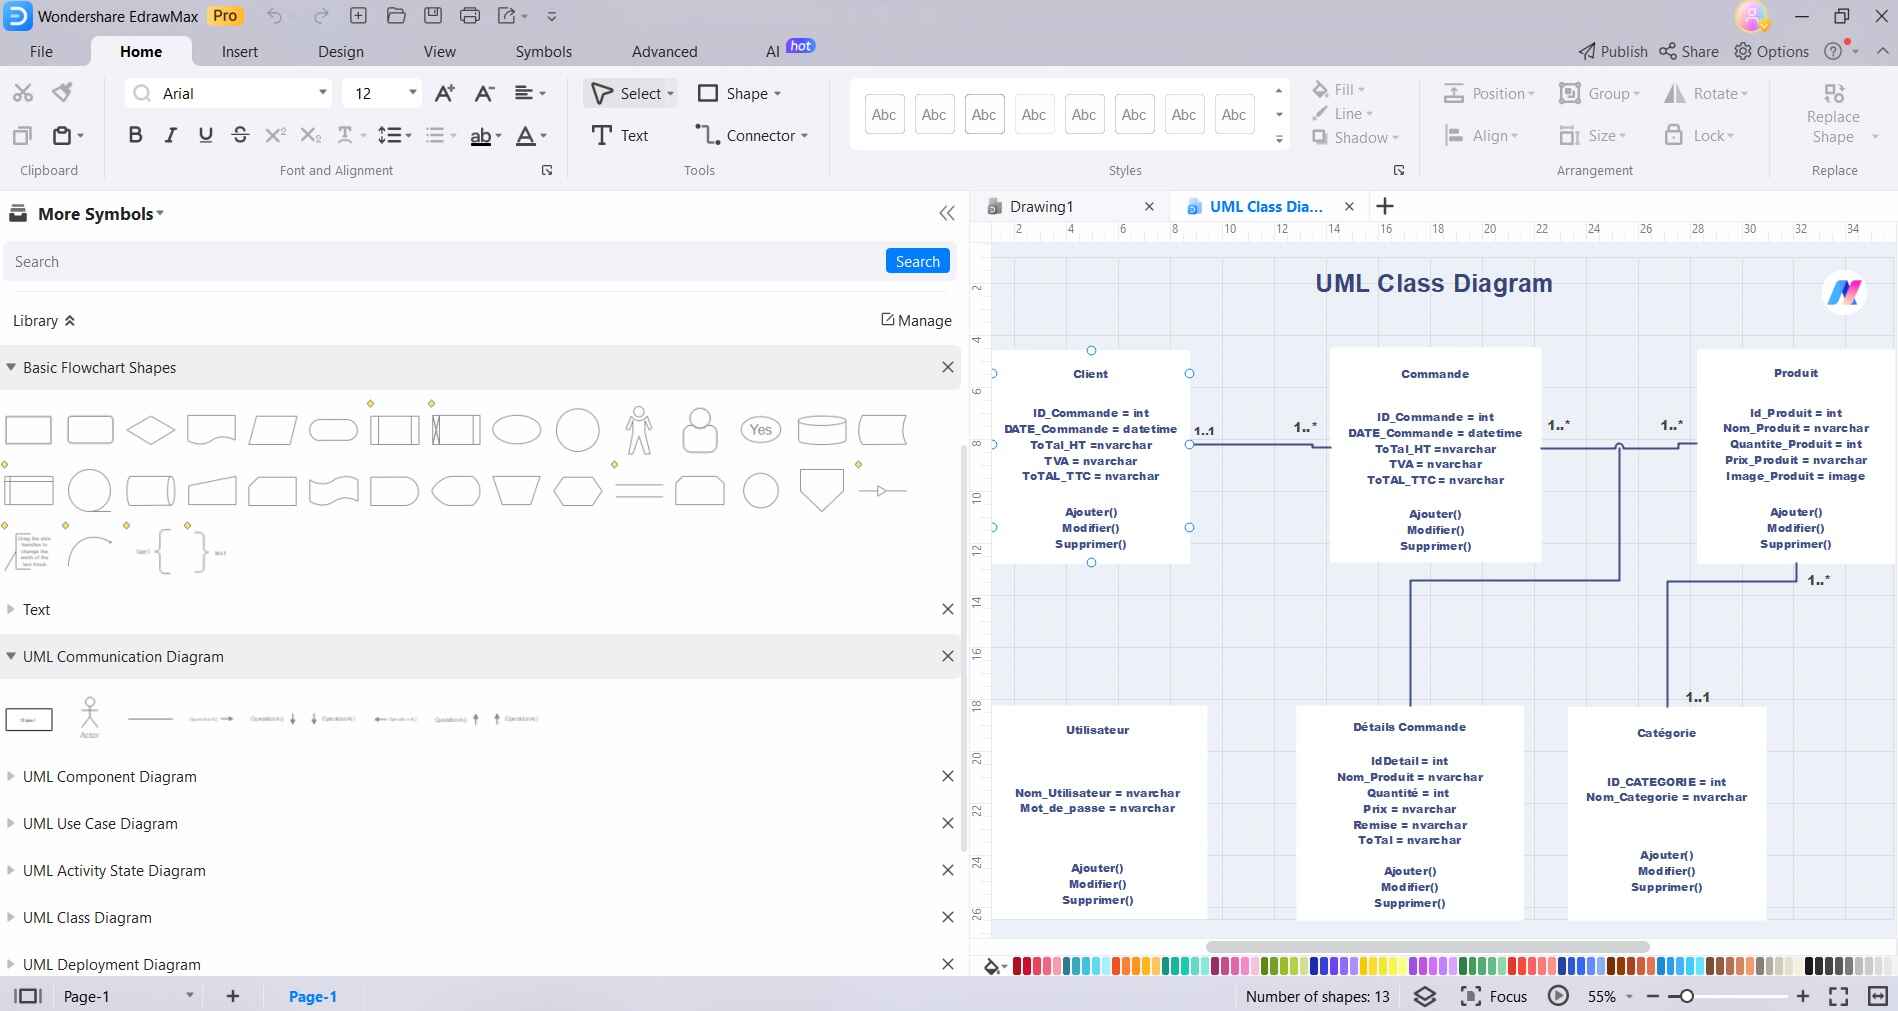
Step 4: Annotate each symbol, and entity and connect it with meaningful labels. This provides context and aids in comprehension, guaranteeing that the diagram conveys precise information.
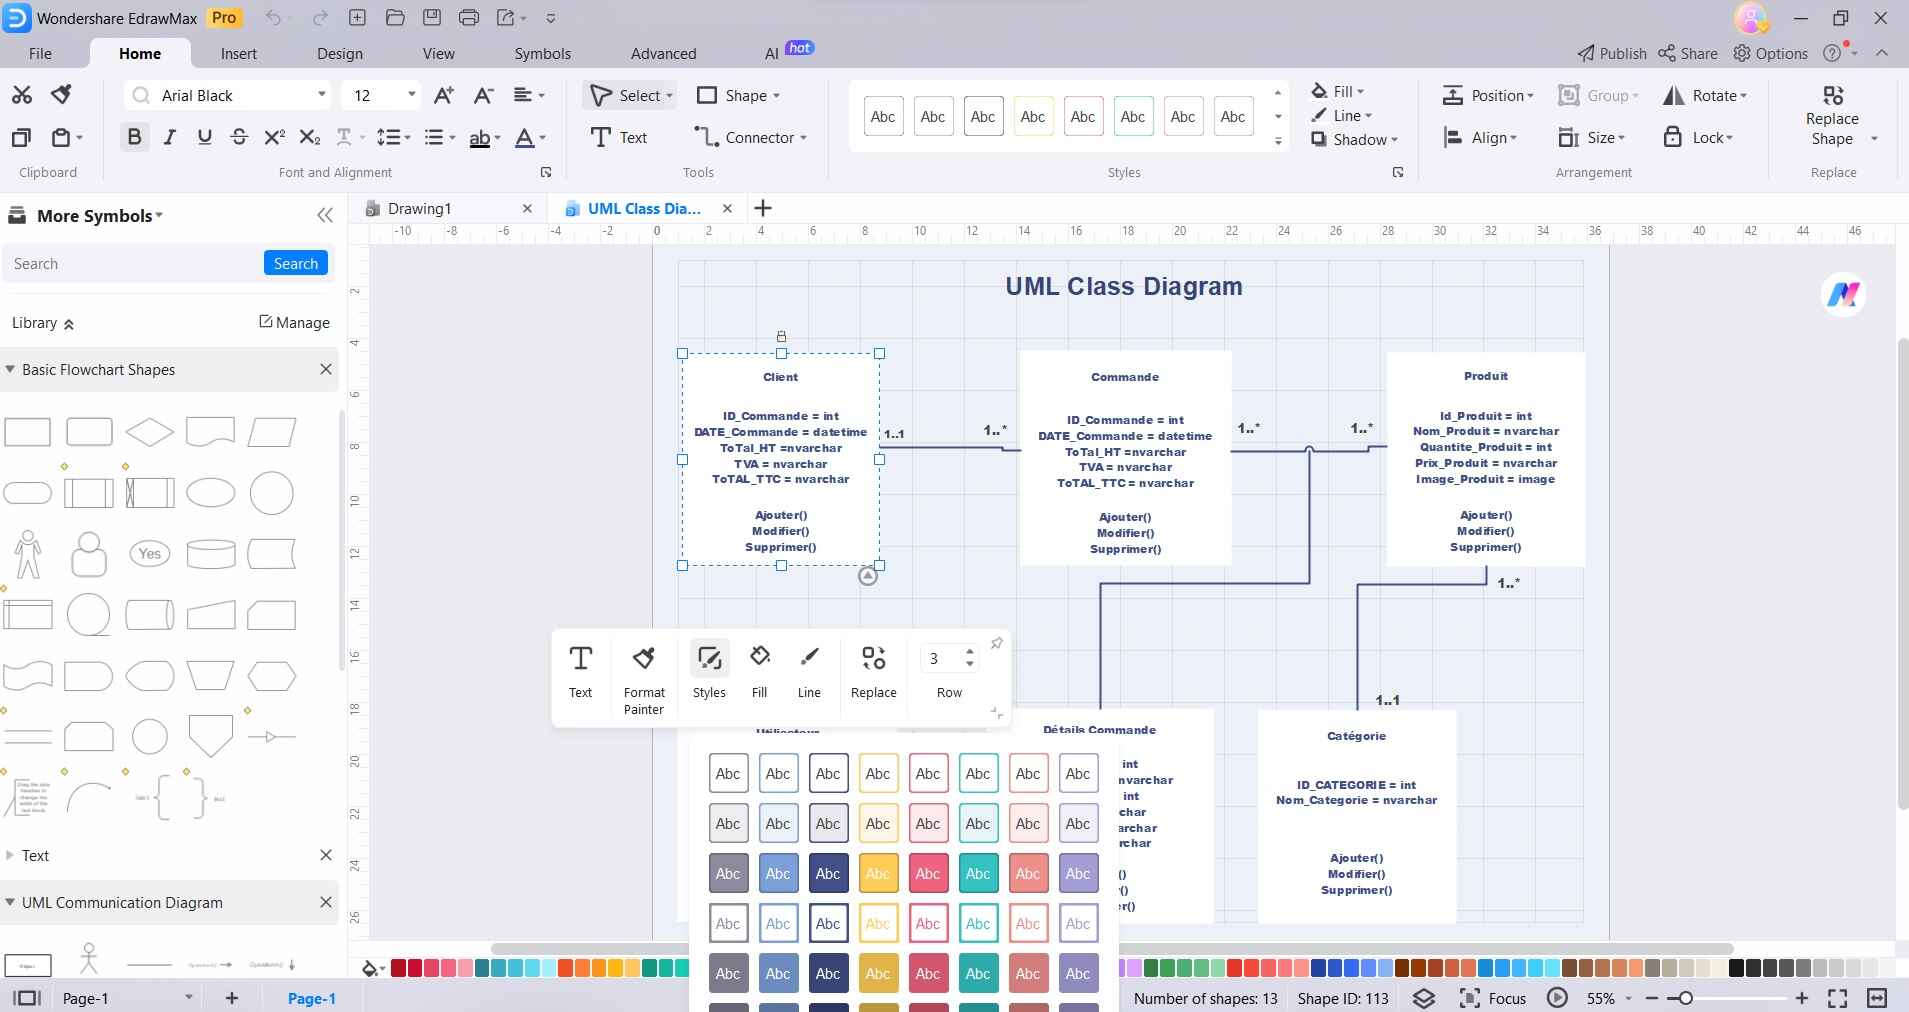
Step 5: Customize your UML context Diagram with a palette of colors, diverse styles, and font options. Tailor the visual aesthetics to enhance clarity and captivate your audience. To do so, simply click on an entirety and click on “Styles”.
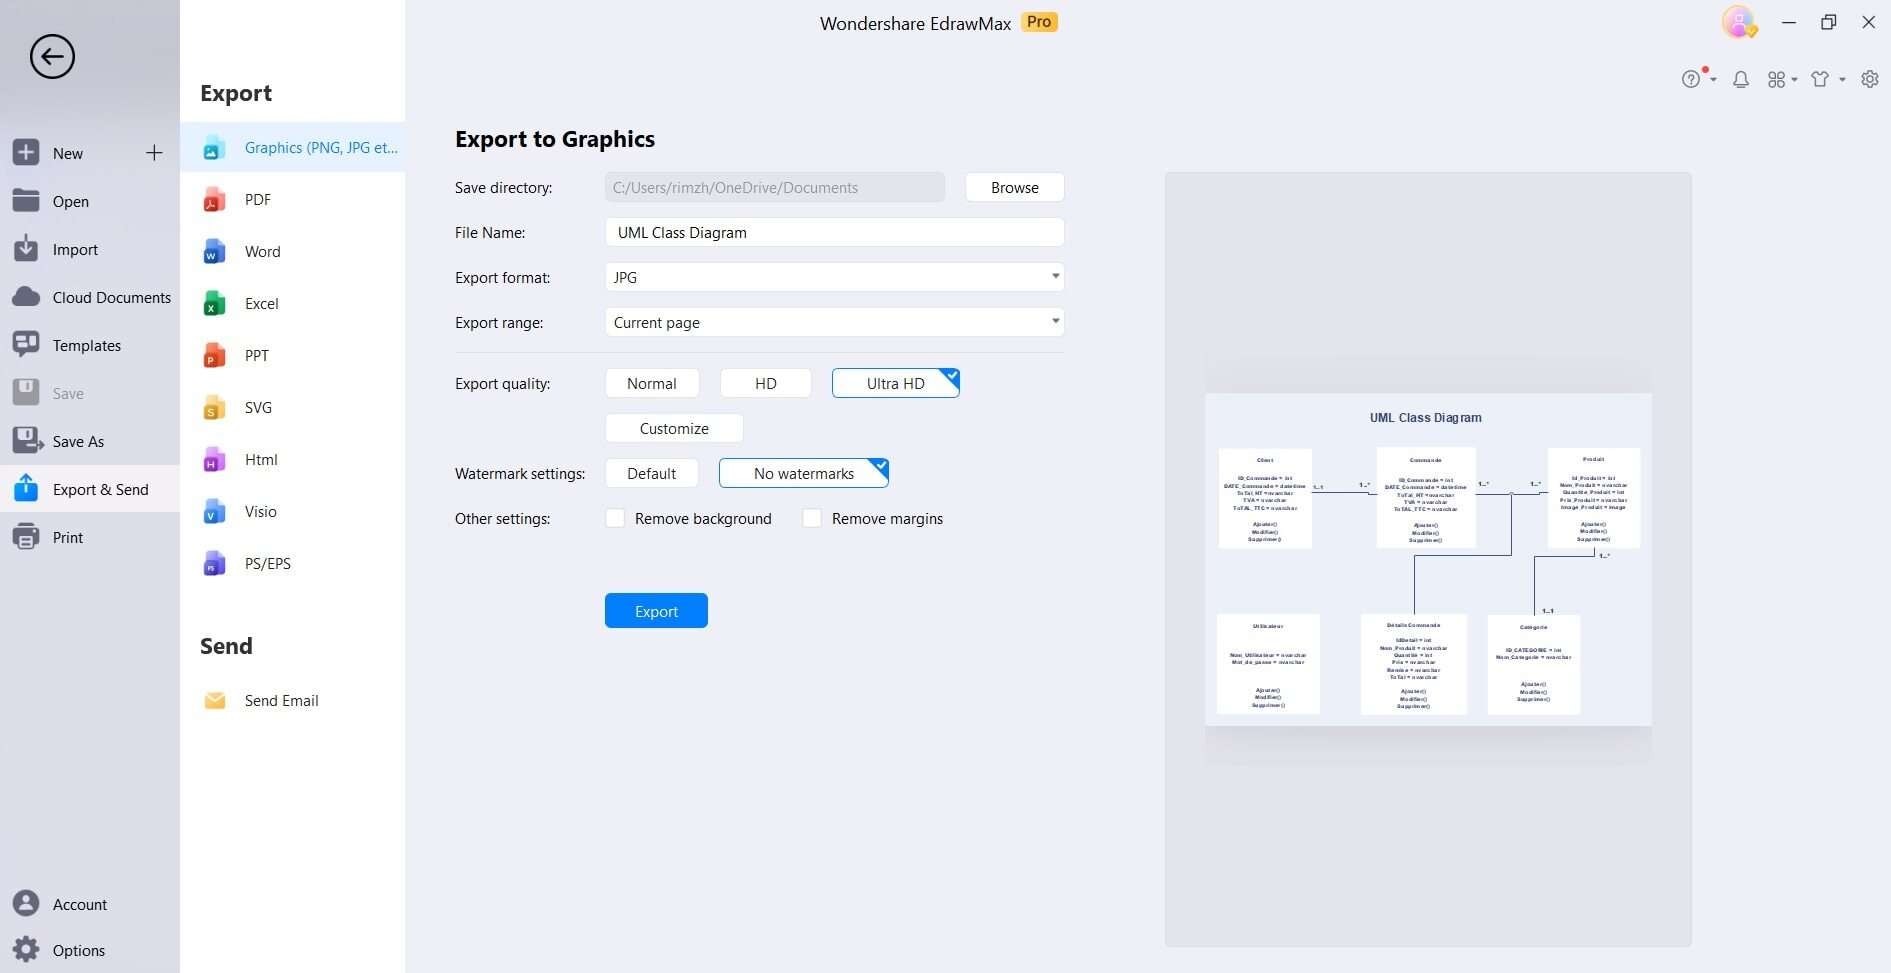
Step 6: Conduct a thorough review. Ensure accuracy, coherence, and adherence to UML standards. Save your work or choose from various export options for seamless sharing and documentation. Tap on File> Export and send. Your comprehensive DFD UML is ready!
Conclusion
This guide equips you with the essential knowledge and practical skills needed to proficiently create a UML Data Flow Diagram. By understanding its intricacies, you gain a powerful tool for visualizing and analyzing data processes within a system. The step-by-step instructions, coupled with real-world examples, facilitate a comprehensive grasp of the diagramming process.
Remember, a well-constructed UML Data Flow Diagram not only enhances communication but also serves as a blueprint for effective system development and maintenance. With this newfound expertise, you're poised to tackle complex projects with confidence, ensuring their success and efficiency in the world of software engineering.


