In this article
What is an Activity Diagram?
An activity diagram outlines the steps of a process from beginning to end. It represents actions, decisions, and outcomes in an easy-to-follow format. People often use it to analyze user actions, business procedures, or system operations.
To learn how to create activity diagram in PlantUML, it is important to understand why they are useful. These diagrams are key in planning, designing systems, and illustrating team processes.
PlantUML activity diagram tools help you create flow-based diagrams by writing code. They work, adapt, and perform well with version control.
You might use them to:
- Map out how users log in or sign up
- Show the steps to handle
- Track tasks in a project
- Outline how software deals with errors
The basic parts include:
- Nodes to start or end
- Actions or activities
- Arrows showing control flow
- Nodes to decide or merge paths
- Forks and joins for parallel actions
- Swimlanes to divide sections
What is PlantUML? (Simple Explanation)
PlantUML, a free and open-source tool, helps people make UML diagrams by writing simple text instructions. It allows users to make various types of diagrams. This includes activity, class, and sequence diagrams. Since it uses plain text, it becomes easy to integrate with code. You can manage updates through version control and change diagrams without redrawing them.
Key Features
Wide Diagram Support
- Class, activity, and sequence diagrams
- Flowcharts and process maps
- Mind maps and wireframes
- Network architecture diagrams
- Project timelines (Gantt)
Code-Driven Diagrams
Use plain text lines to explain diagrams, like A -> B: Hello, and PlantUML makes visuals from them. You don't need to click, drag, or organize shapes yourself.
Beginner-Friendly Syntax
You don't have to be highly skilled. The syntax stays brief, clear, and simple to understand.
@startuml
User -> System: Login
System --> User: Success
@enduml
Basic PlantUML Syntax for Use Case Diagrams
To create a working PlantUML activity diagram, you must understand how to write each part. Every piece, from the start points to the decision blocks, uses a specific format. The following section explains these components with syntax and examples you can apply.
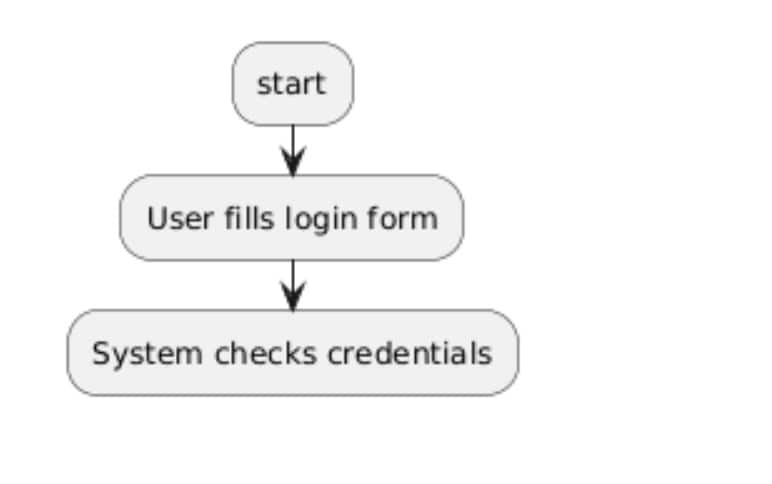
Actions/Activities
PlantUML uses actions to explain what takes place at every step. You define them like this:
Syntax:
:;
Example:
:start;
:User fills login form;
:System checks credentials;
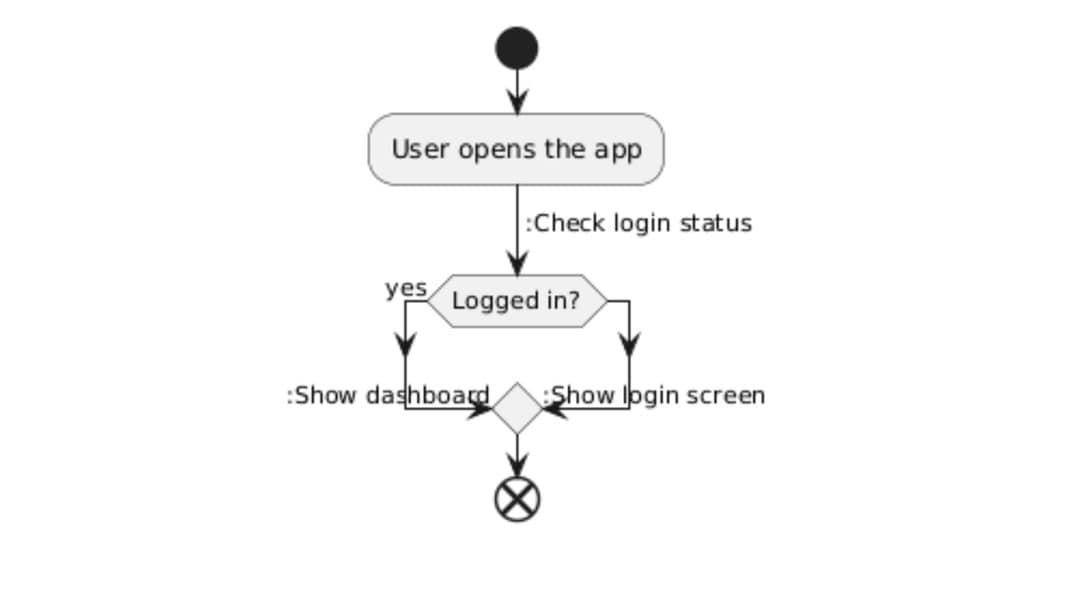
Initial Node
The first node marks the beginning of the activity. You define it in PlantUML with just one keyword.
Syntax:
start
Example:
@startuml
start
:User opens the app;
@enduml
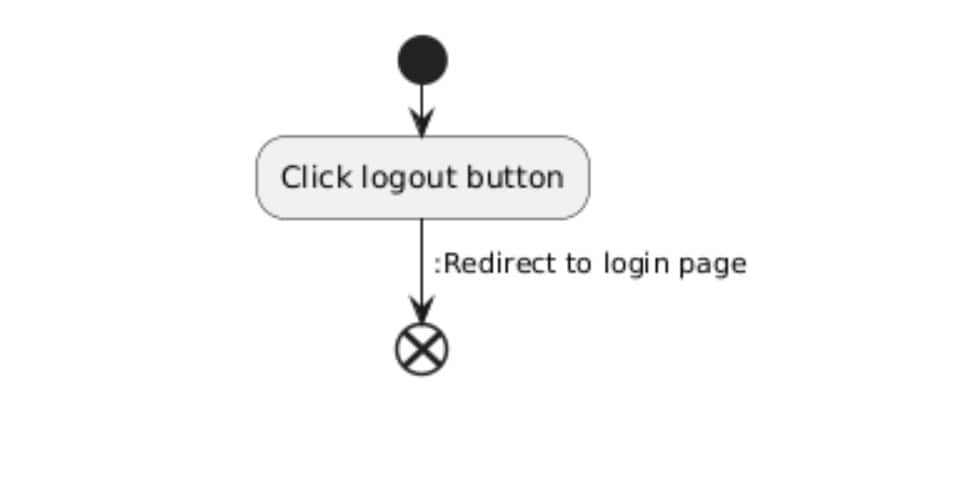
Final Node
The last node marks where everything stops. You type one word to finish the flow.
Syntax:
end
Example:
@startuml
start
:User logs out;
end
@enduml
Control Flow/Edges
Control flow shows the order of activities step by step. It links one task to another and explains how things progress. In PlantUML, arrows (->) make these transitions easy to understand and follow.
Syntax:
Activity1 -> Activity2
Example:
@startuml
start
:Enter email;
-> :Enter password;
-> :Click Login;
end
@enduml
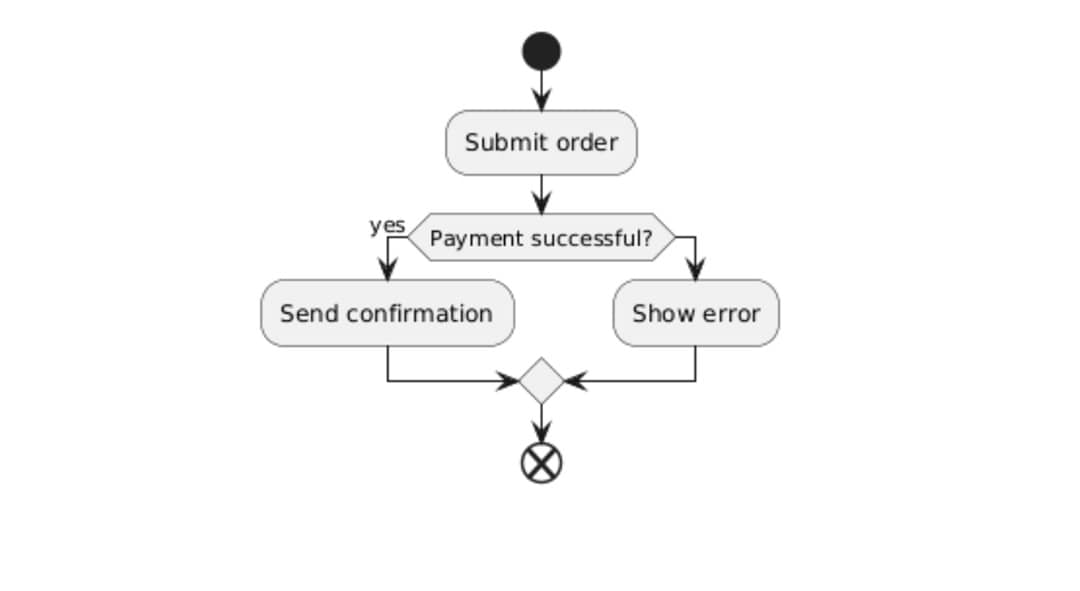
Decision/Merge
Decision nodes manage making choices. To show different results, you can use if-then-else blocks. PlantUML allows creating parallel paths by using fork and end fork.
Syntax:
if (...) then (...) else (...) endif
fork ... else ... end fork
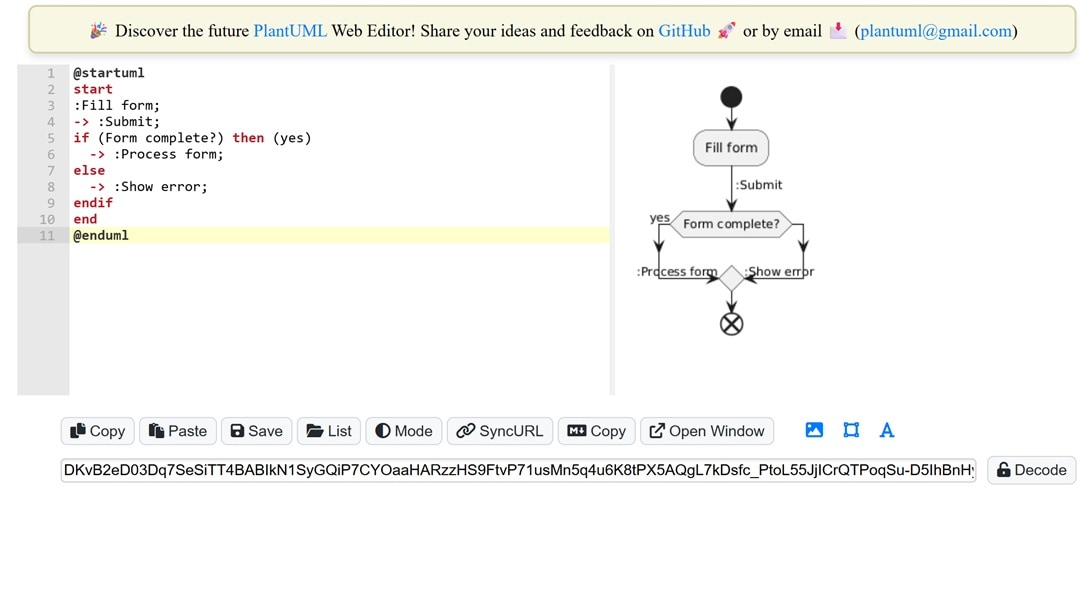
Example:
@startuml
start
:Submit order;
if (Payment successful?) then (yes)
  :Send confirmation;
else
  :Show error;
endif
end
@enduml
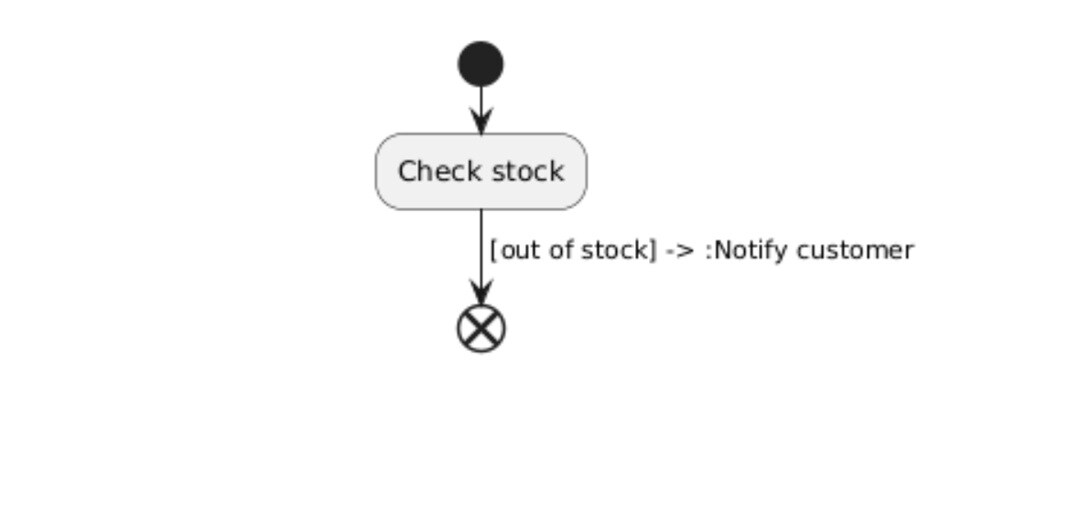
Guard Conditions
Guard conditions decide which route to take depending on a rule. Put the condition inside square brackets on the arrow linking activities.
Syntax:
-> [condition] ->
Example:
@startuml
start
:Check stock;
->[items available] -> :Confirm order;
->[out of stock] -> :Notify customer;
end
@enduml
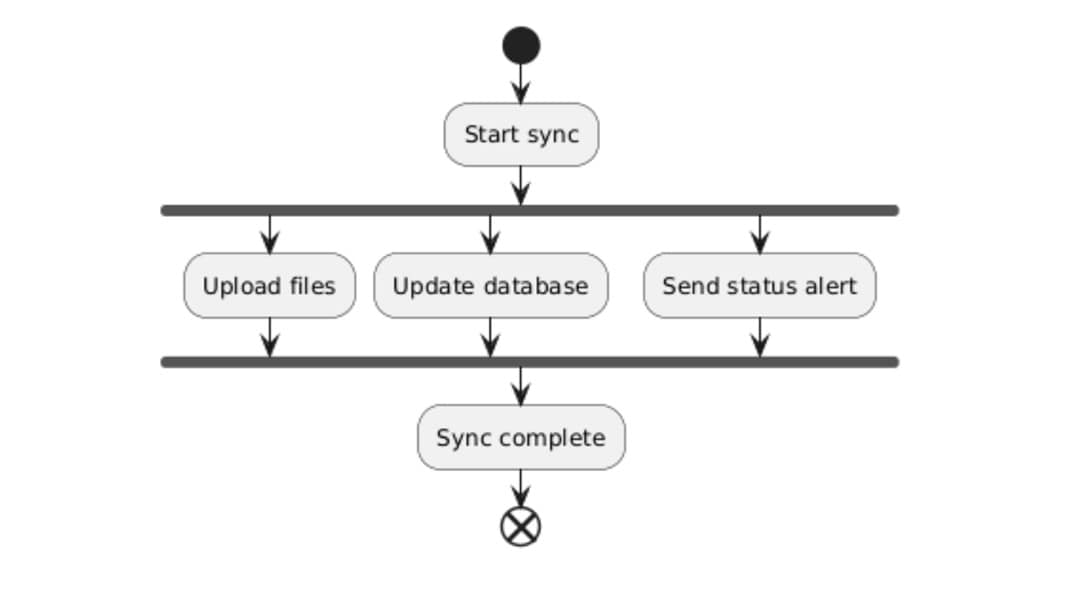
Fork/Join (Parallel Activities)
You use fork and join when several actions occur together. The fork keyword begins parallel processes, while the end fork combines them again. This works well when tasks can happen at the same time without relying on each other.
Syntax:
fork
  :Activity1;
fork again
  :Activity2;
end fork
Example:
@startuml
start
:Start sync;
fork
  :Upload files;
fork again
  :Update database;
fork again
  :Send status alert;
end fork
:Sync complete;
end
@enduml
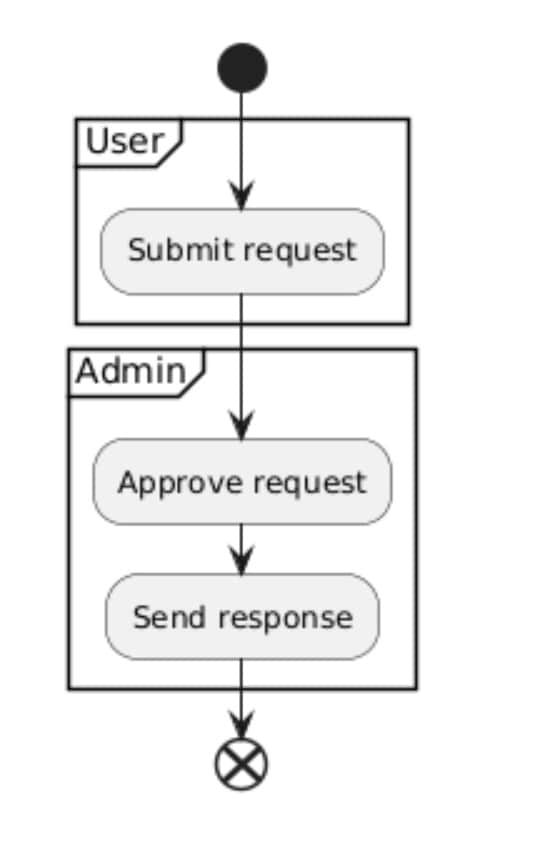
Partitions/Swimlanes
Swimlanes, also known as partitions, make it easier to see who or what handles specific actions. They place similar steps under a label such as "User" or "System." This helps people read and understand the diagram better.
Syntax:
partition "Label" {
  :Activity;
}
Example:
@startuml
start
partition "User" {
  :Submit request;
}
partition "Admin" {
  :Approve request;
  :Send response;
}
end
@enduml
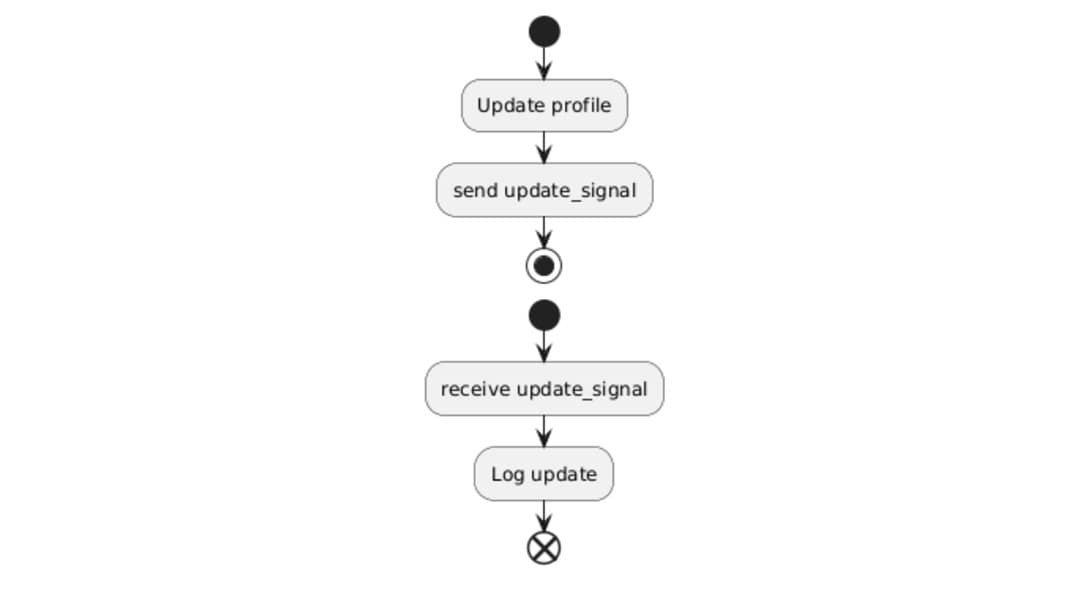
Signal Sending and Receiving
Use signals to notify a system part when another needs attention. The send command sends the signal, while receive deals with it somewhere else in the process.
Syntax:
send <signal name>
receive <signal name>
Example:
@startuml
start
:Update profile;
:send update_signal;
stop

start
:receive update_signal;
:Log update;
end
@enduml
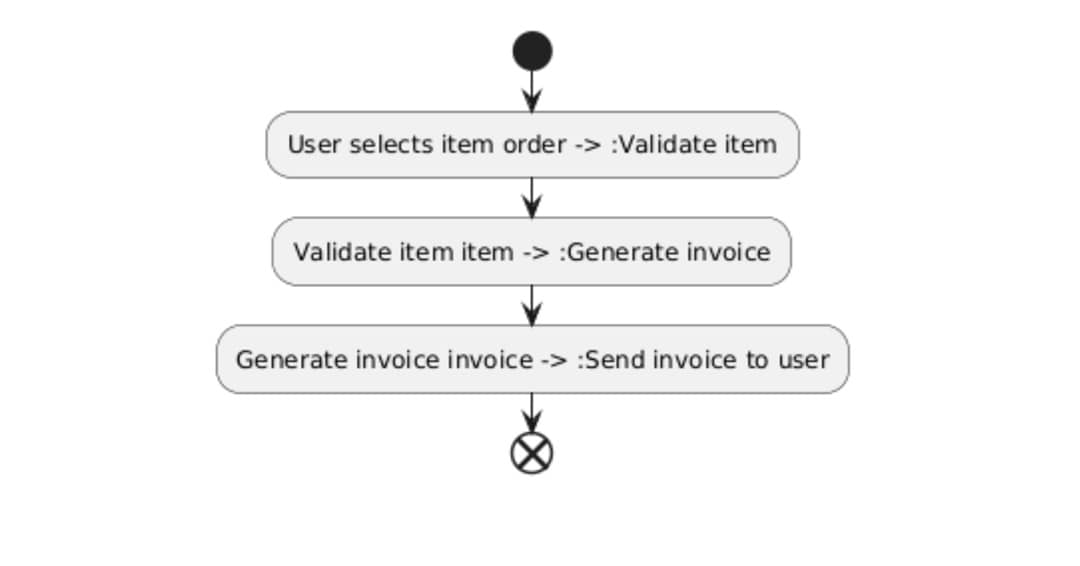
Object Flow
Object flow displays the movement of data or items through different activities. It lets you see what gets passed at every stage. Positioned between two actions, the object provides a clear connection between what goes in and what comes out.
Syntax:
:Activity1 object -> :Activity2;
Example:
@startuml
start
:User selects item order -> :Validate item;
:Validate item item -> :Generate invoice;
:Generate invoice invoice -> :Send invoice to user;
end
@enduml
Steps to Create an Activity Diagram with PlantUML
Step 1: Identify the Activities and Decision Points in the Process
- Start by writing down each action in the process, even the tiny ones.
- Next, identify where decisions or conditions change.
- These steps and choices build the base structure that your diagram will use later on.
Step 2: Describe These Elements and Their Flow
- Use colons to show activities, arrows to indicate flow, and conditions to represent decisions.
- Make sure everything stays clear and steady so the diagram matches the actual process.
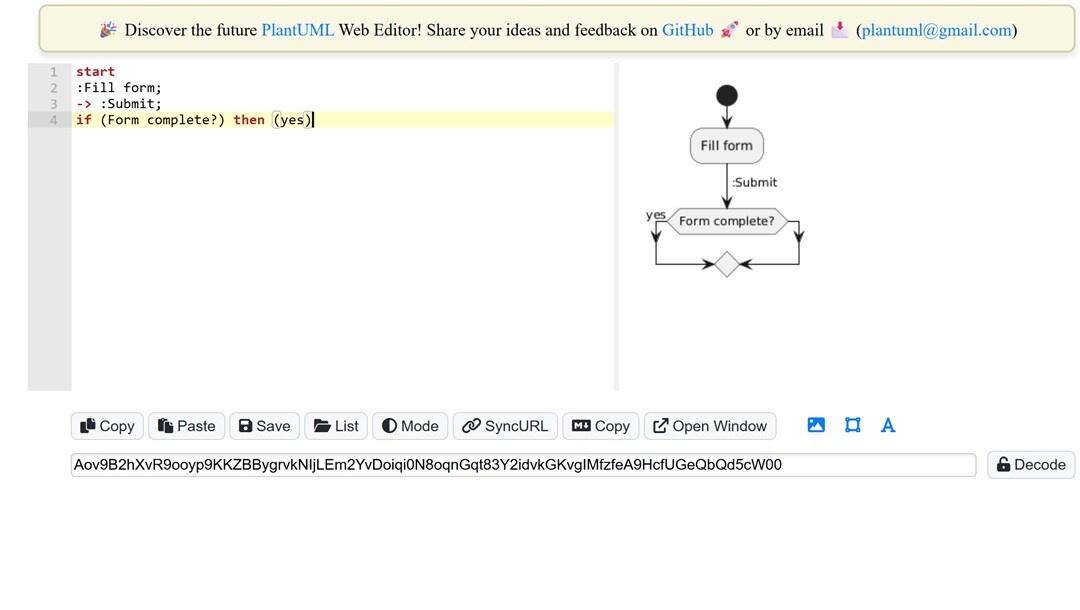
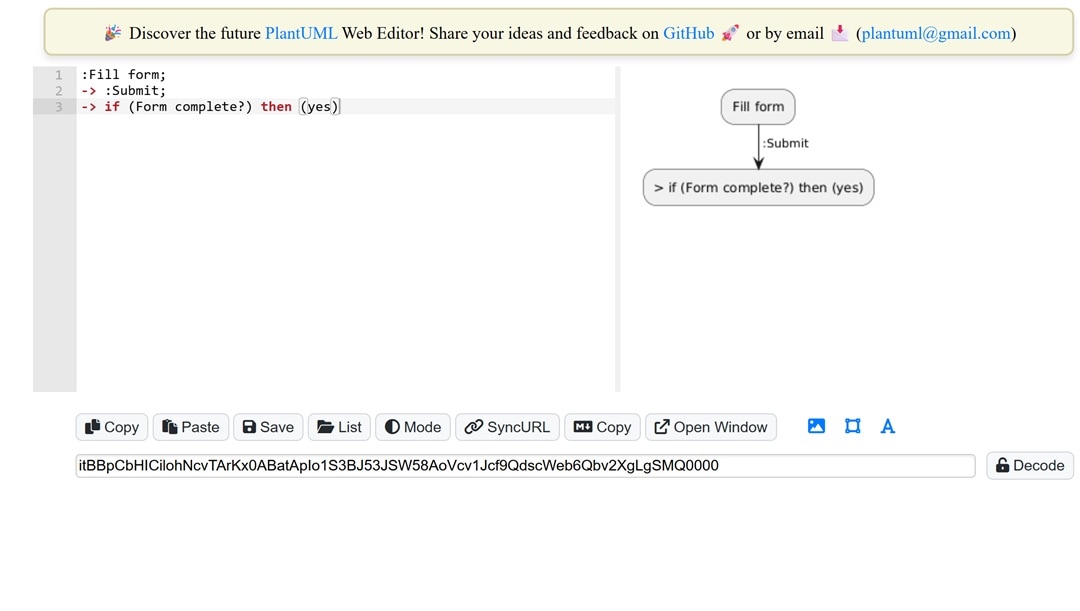
Step 3: Render and View the Diagram
- To view your diagram, copy the full code and put it into the PlantUML Online Editor.
- If you are working on your computer, you can install the PlantUML extension in tools like VS Code or IntelliJ.
- These tools allow instant previews, so you do not need to step out of your coding space.
Practical Examples
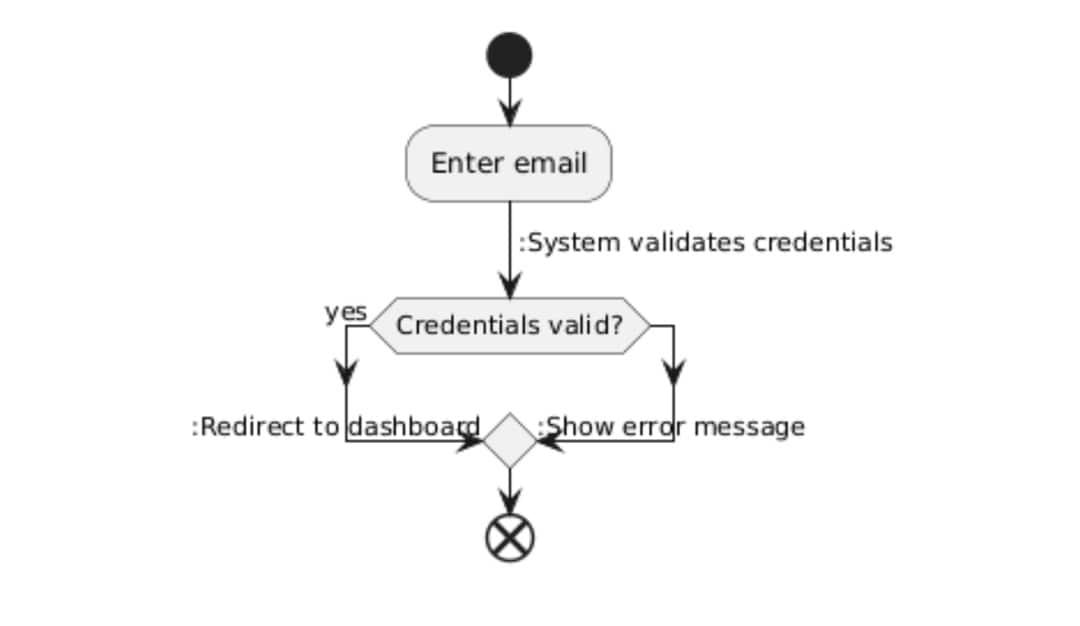
A Simple Activity Diagram Example
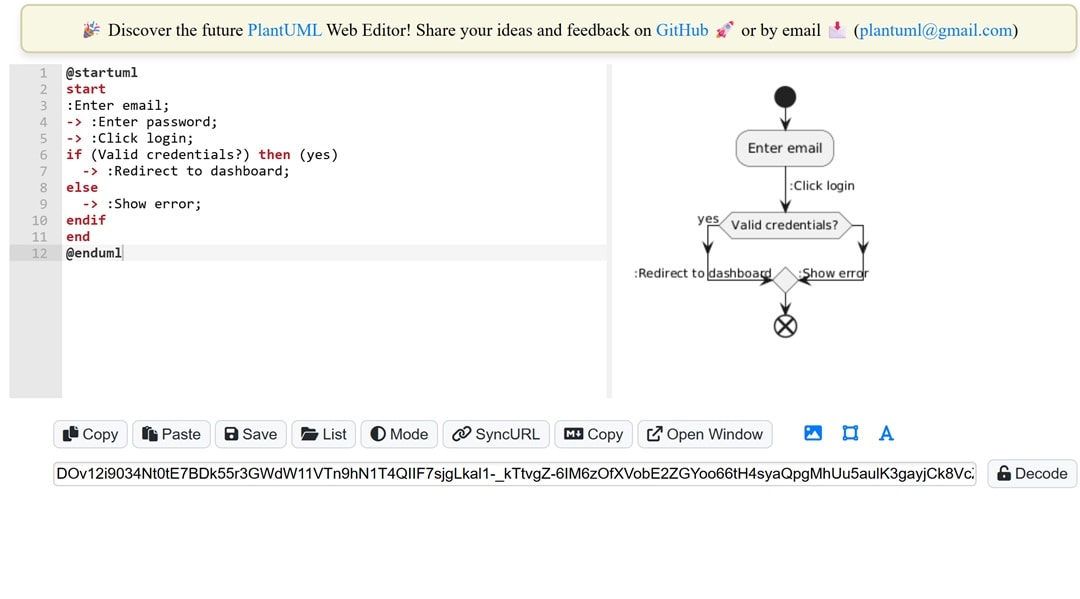
@startuml
start
:Enter email;
-> :Enter password;
-> :Click login;
if (Valid credentials?) then (yes)
  -> :Redirect to dashboard;
else
  -> :Show error;
endif
end
@enduml
This activity diagram outlines how a simple user login works. The process starts when the user types in their email and password, then clicks the login button. The system validates the credentials. If they are correct, the user gets sent to the dashboard. If they are wrong, an error message appears instead. The diagram lays out every step and decision.
An Activity Diagram with Decisions and Merges
@startuml
start
:Receive order;
-> :Check stock;
if (In stock?) then (yes)
  -> :Process payment;
  if (Payment approved?) then (yes)
    -> :Prepare shipment;
  else
    -> :Cancel order;
  endif
else
  -> :Notify out of stock;
endif
-> :Update records;
end
@enduml
Orders pass multiple checks before being completed. The process starts with checking stock, then moves to processing payments. Based on the results, the order gets prepared, canceled, or labeled as out of stock. Everything comes together to update records, which keeps the system organized and simple to track.
An Activity Diagram with Parallel Activities
@startuml
start
:Start backup;
fork
  :Backup files;
fork again
  :Export database;
fork again
  :Generate logs;
end fork
:Notify completion;
end
@enduml
This diagram describes a backup process with three tasks: file backup, database export, and log generation. Each task works on its own, and they combine afterward to send a final notification. People often use this setup to model systems with tasks happening at a time.
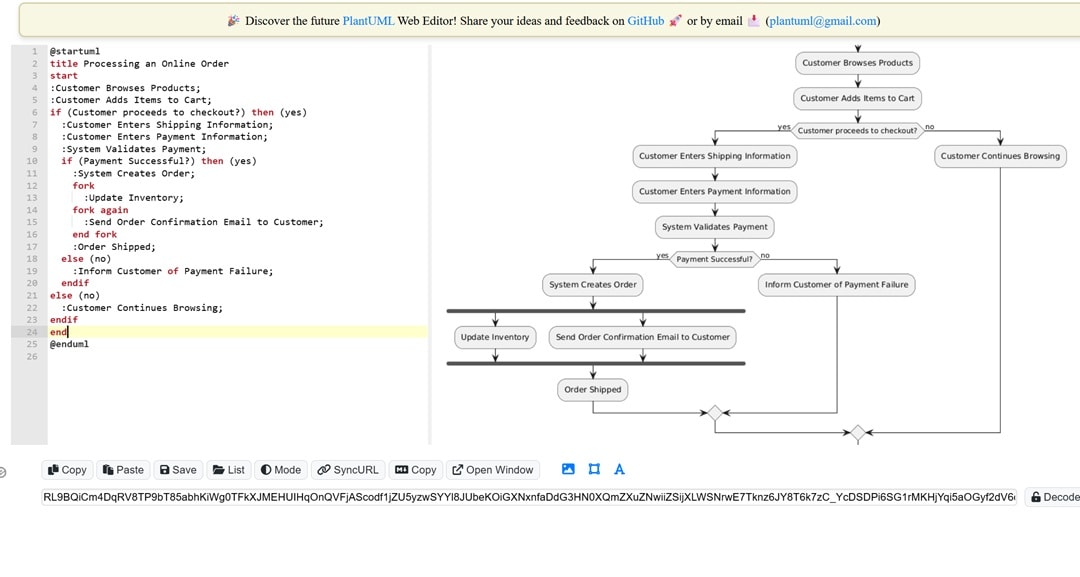
Activity Diagram for Processing Online Orders
@startuml
title Processing an Online Order
start
:Customer Browses Products;
:Customer Adds Items to Cart;
if (Customer proceeds to checkout?) then (yes)
  :Customer Enters Shipping Information;
  :Customer Enters Payment Information;
  :System Validates Payment;
  if (Payment Successful?) then (yes)
    :System Creates Order;
    fork
      :Update Inventory;
    fork again
      :Send Order Confirmation Email to Customer;
    end fork
    :Order Shipped;
  else (no)
    :Inform Customer of Payment Failure;
  endif
else (no)
  :Customer Continues Browsing;
endif
end
@enduml
This diagram shows how an online order moves through browsing and ends with shipping. It highlights choices such as completing checkout and confirming payment. Tasks like updating stock and sending a confirmation happen side by side. Businesses can use it to understand what customers do and how systems respond on e-commerce platforms.
When to Consider Alternatives
PlantUML suits most needs, but it does not work for every team or person. Sometimes, its text-based style can make processes slower or restrict certain tasks. Let's check out some of these drawbacks and then talk about a tool designed to address those weaknesses.
PlantUML Limitations
- Managing Big Diagrams Is Difficult: Your code becomes less readable and harder to maintain as your diagram expands.
- No Control Over Auto-Layout: You can't change where elements go.
- Few Styling Choices: You'll find it hard to customize fonts, spacing, or shapes.
An Easier Way to Create Activity Diagrams
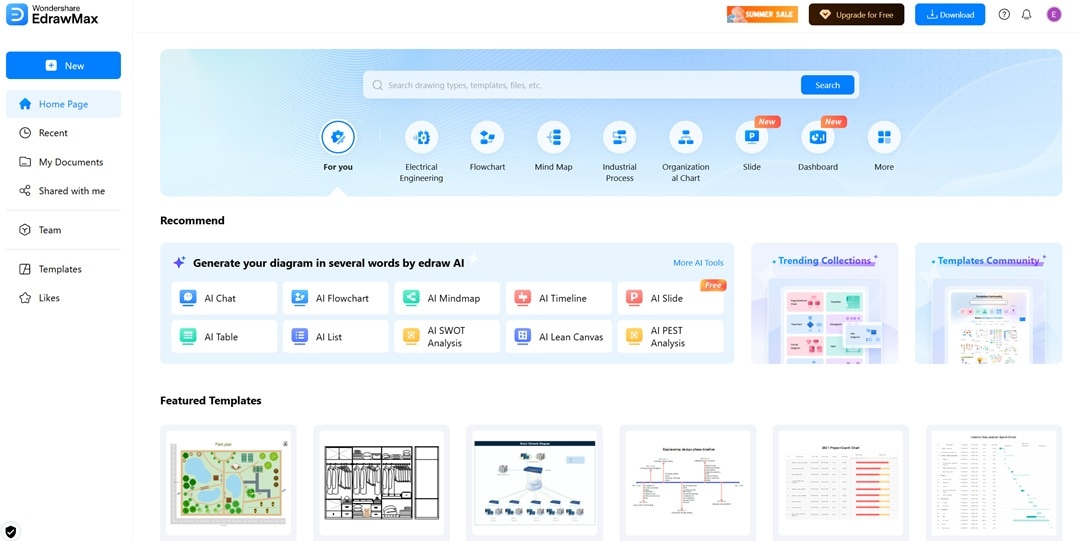
Some people prefer not to create diagrams by coding. When working on flowcharts with branches, choices, or swimlanes, typing every detail might take extra time. EdrawMax Online makes it simpler. You do not deal with syntax or formatting problems. Instead, you can make diagrams with a few clicks. It is faster to modify and share as the design becomes detailed.
EdrawMax lets users create diagrams by using the drag-and-drop feature. You can access editable templates alongside layout tools. Unlike PlantUML, it allows users to decide where to place elements and how to style or space them. It supports exporting in various formats. This makes it a good choice to draw activity diagrams.
Why You Will Love It
- Customizable Connectors: You can tweak line curves, change arrow designs, and pick connection spots without needing to code.
- Activity Diagram Templates: Edit pre-designed templates to map out login steps, orders, or tasks done at the same time.
- Export in Multiple Formats: Save diagrams as PDF, SVG, Word, PowerPoint, or Visio in just a single step.
Bringing Everything Together
Coding diagrams allow you to achieve accuracy, organization, and complete control. PlantUML offers technical users a strong tool to use in coding setups and projects under version control. This guide showed how to make an activity diagram in PlantUML by using proper syntax, clear steps, and real-world examples.
A good PlantUML activity diagram lets you break down processes, find important tasks, and design systems. Writing out lines takes a lot of time and is not always helpful. EdrawMax comes in here. You can adjust your diagram while brainstorming. Edit without needing to touch any code. It is quick to use, looks good, and even feels enjoyable.
Start with the tool that matches how you think. Code when you need control, click when you need speed. Try them out now!