In this article
Basic Syntax (100% Valid and Tested)
Each deployment diagram has some major components. Nodes are used to illustrate physical machines or locations. Artifacts signify the things that are being deployed. Groups are used to interconnect the related parts to get a clearer picture. Let's see how PlantUML deployment diagram syntax and connections utilize these elements.
Nodes & Artifacts
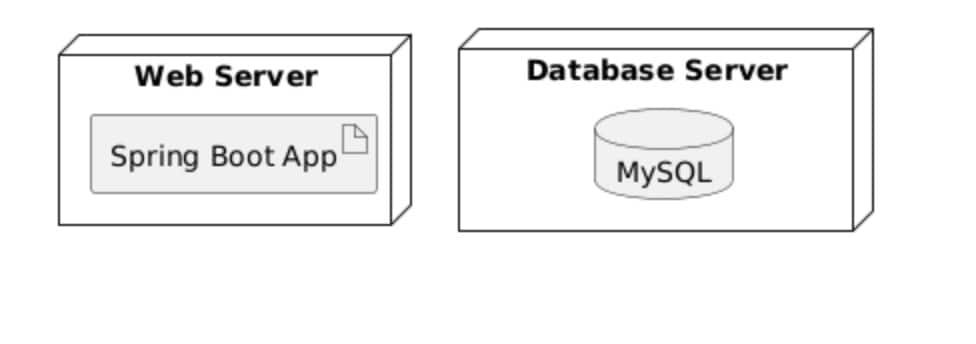
node "Web Server" as web {
  artifact "Spring Boot App" as app
}
node "Database Server" as db {
  database "MySQL"
}
Nodes depict the locations where the components operate. Artifacts specify the contents that are installed in those nodes. The web server, in this case, is the host for a Spring Boot app, whereas the database server is the place for MySQL. Nodes and artifacts assist in the clear and concise mapping of the structure.
Connections (Communication Paths)
web -- db : JDBC
Connections describe the nature of the relationship between two components. In the web -- db: JDBC example, the web server communicates with the database using JDBC. A line like this not only indicates the location but also the nature of the interaction in the diagram. A clear depiction of data movement makes it easier for people to visualize the system.
Groups (Logical Groupings)
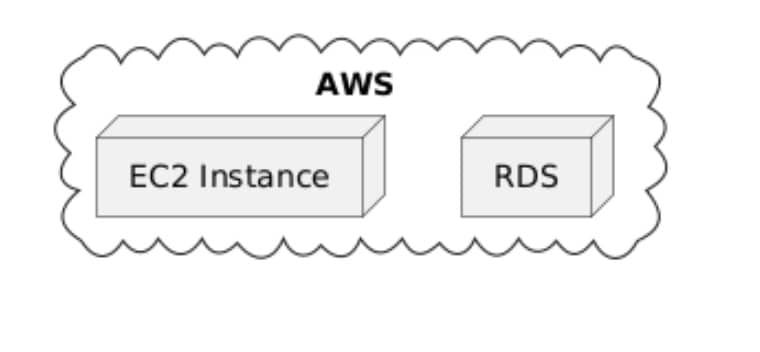
cloud "AWS" {
  node "EC2 Instance" as ec2
  node "RDS" as rds
}
Groups are very useful for categorizing related nodes under a single label. With a cloud "AWS" {}, you can also group components that are of the same nature, for example, EC2 and RDS. This not only saves a lot of space, but it also makes it easy to understand. Logical groupings help with cloud services or a bigger system setup.
Advanced Techniques
Basic elements are helpful, but some systems require more detail. And these advanced features are exactly the things you need. Using layout control and interface mapping, you can illustrate the behavior of your system. These tools are useful when developing a more comprehensive UML deployment diagram with PlantUML. Let's discuss these techniques now!
Stereotypes & Icons
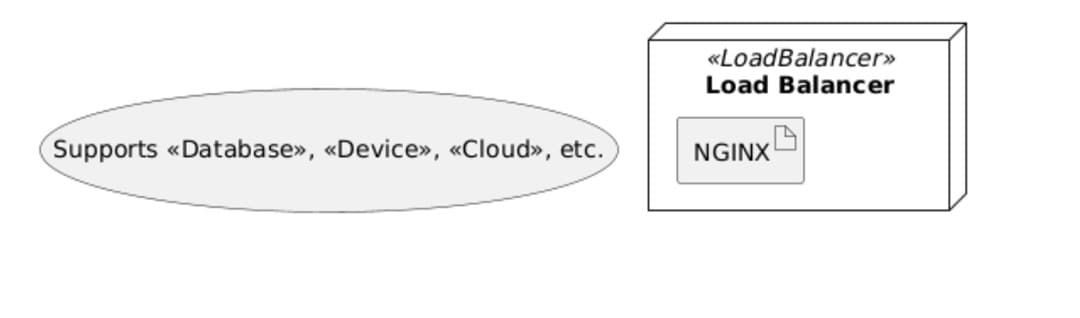
node "Load Balancer" <> {
  artifact "NGINX"
}
Stereotypes make your diagram easier to grasp by showing what each node stands for. For instance, using <
Ports & Interfaces
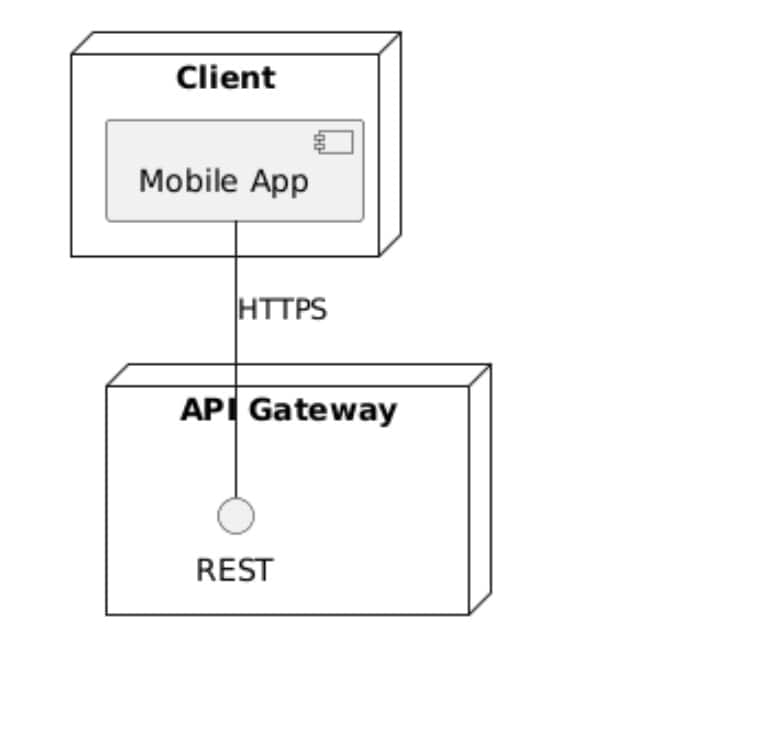
node "Client" as client {
  [Mobile App] as mobile
}

node "API Gateway" as api {
  interface "REST" as rest
}

mobile -- rest : HTTPS
Ports and interfaces allow you to set specific entry and exit points in your system. Here, the mobile app connects to a REST interface through HTTPS. This arrangement shows how data gets to the API Gateway. Rather than using arrows without context, ports offer a method to display actual technical boundaries.
Dynamic Layouts
left to right direction
web --> db
Diagrams become tough to understand when parts overlap or point the wrong way. By using a left-to-right direction, you manage how elements show up without moving anything around. The line web --> db keeps the flow easy to follow. These kinds of layout rules help you create neater diagrams when you're working with many nodes or more intricate systems.
Styling & Themes
After setting up the structure, you can add style to make your diagram simpler to understand. Adjusting colors, shapes, or adding custom icons can focus attention on important sections. This PlantUML deployment diagram tutorial will explain how to apply basic visual enhancements. Clear styling helps people grasp your diagram without altering its design.
Colors & Shapes
skinparam nodeBackgroundColor #E3F2FD
skinparam nodeBorderColor #2196F3
!theme carbon-gray
You can tweak visuals to make your diagram appealing. Use skinparam to adjust background and border shades. For instance, set the background as #E3F2FD and borders as #2196F3. Applying themes such as carbon-gray can also shift the overall design.
Custom Icons
node "K8s Cluster" <> #FFECB3
Custom icons help people identify sections of your system with meaning. Adding something like <
Real-World Examples
Figuring out the structure is one thing. Watching it work is another. Let's check out a real PlantUML deployment diagram to understand how all these parts fit together.
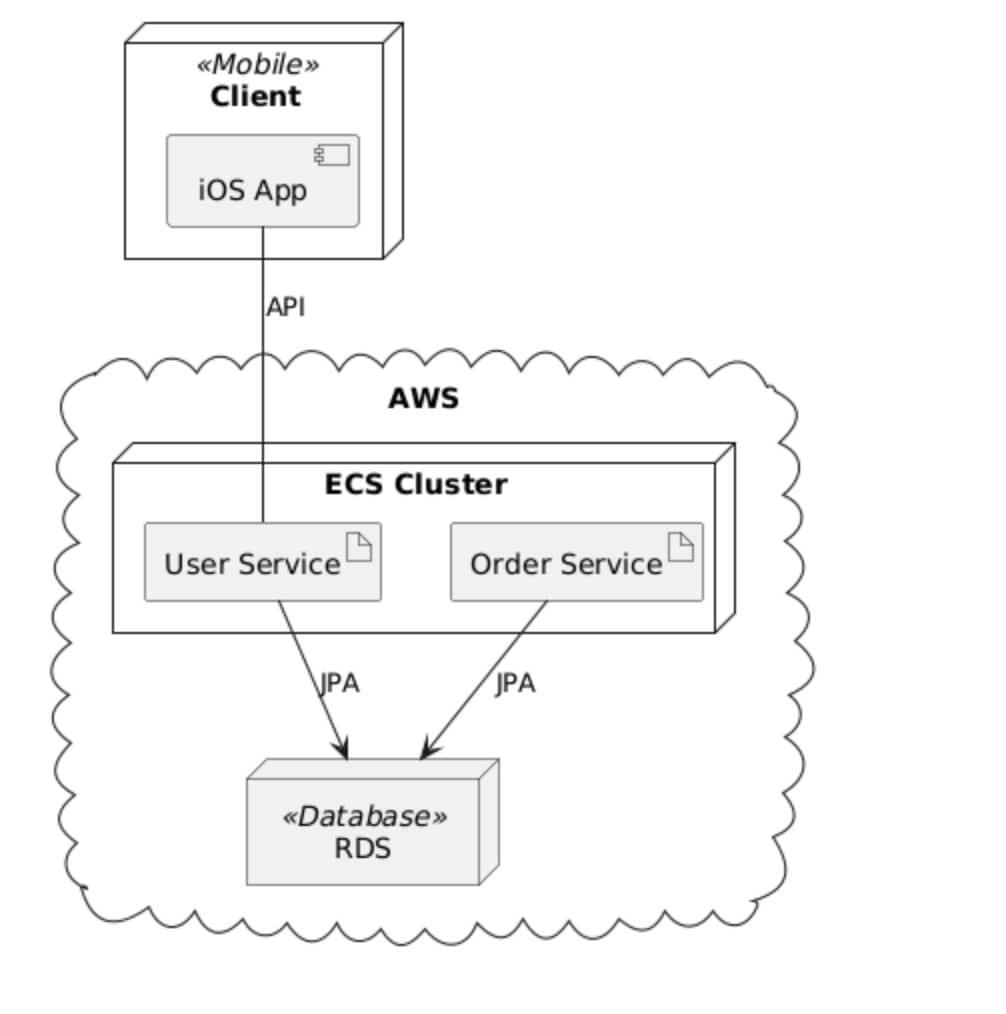
Microservices on AWS
@startuml
cloud "AWS" {
  node "ECS Cluster" as ecs {
    artifact "User Service" as user
    artifact "Order Service" as order
  }
  node "RDS" as rds <>
}
node "Client" <> {
  [iOS App] as ios
}
ios -- user : API
user --> rds : JPA
order --> rds : JPA
@enduml
An application sends API calls to the User Service running in an ECS cluster. The cluster also handles the Order Service. Both services rely on JPA to work with an RDS database. Placing these components within the cloud "AWS" illustrates their hosting environment. This structure represents a typical microservices setup often seen on cloud providers such as AWS.
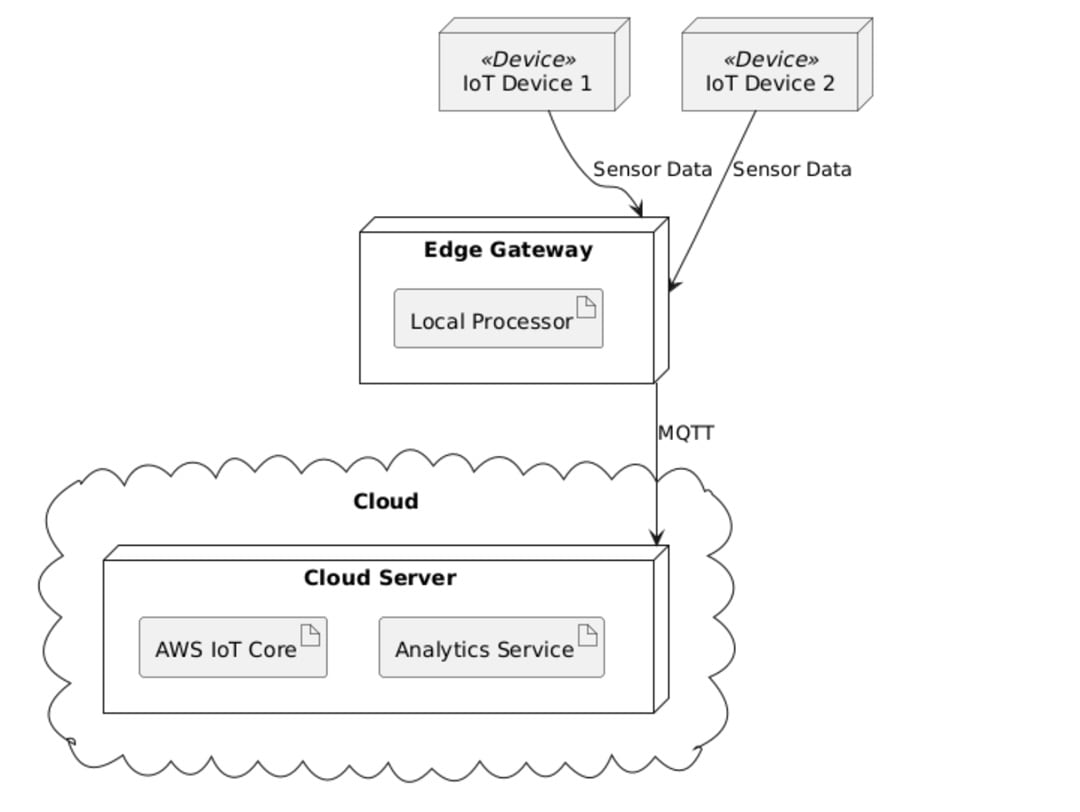
IoT Device Network with Edge and Cloud Processing
@startuml
cloud "Cloud" {
  node "Cloud Server" as cloud_server {
    artifact "AWS IoT Core"
    artifact "Analytics Service"
  }
}
node "Edge Gateway" as edge {
  artifact "Local Processor"
}
node "IoT Device 1" <> as device1
node "IoT Device 2" <> as device2
device1 --> edge : Sensor Data
device2 --> edge : Sensor Data
edge --> cloud_server : MQTT
@enduml
Two IoT devices transmit sensor data to an edge gateway to process it. The gateway then relays the data to a cloud server through MQTT. In the cloud, AWS IoT Core operates alongside analytics tools. It helps teams plan, review the architecture, and see where each component is and what it does.
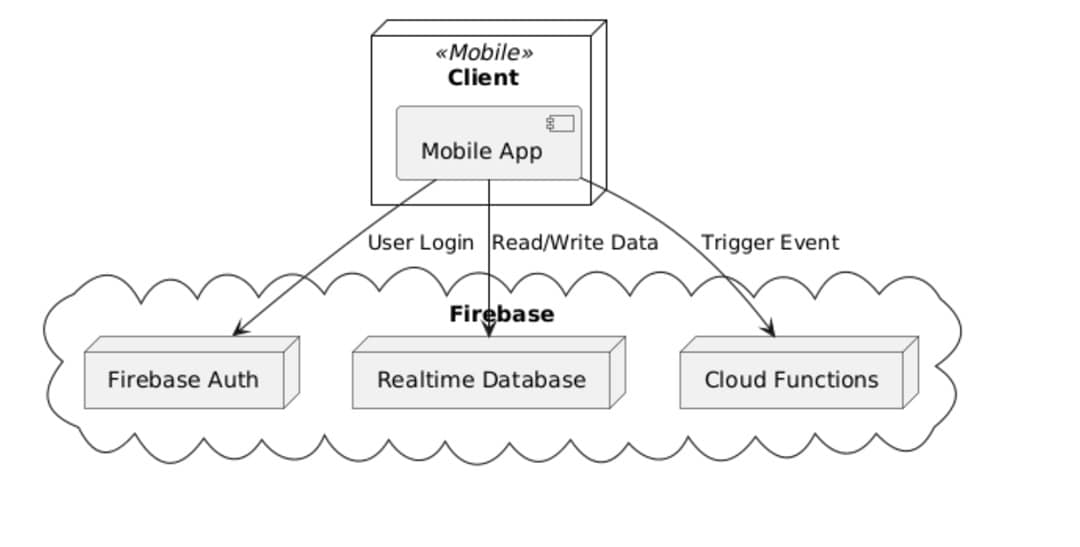
Mobile App Connected to Firebase
@startuml
node "Client" <> {
  [Mobile App] as app
}
cloud "Firebase" {
  node "Firebase Auth" as auth
  node "Realtime Database" as db
  node "Cloud Functions" as functions
}
app --> auth : User Login
app --> db : Read/Write Data
app --> functions : Trigger Event
@enduml
This mobile app uses three main Firebase services: Auth, Realtime Database, and Cloud Functions. It sends login details to Firebase Auth. It accesses and updates data in the database and activates events with Cloud Functions. This deployment diagram shows how the app works with mobile and cloud services. This helps others understand the app's design.
Common Mistakes & Fixes
Errors can still occur when crafting diagrams, even with straightforward syntax. A tiny mistake in the PlantUML deployment diagram syntax might mess up the design. Let's explore typical problems and ways to solve them.
- Error: Undefined nodes → Always declare with node or artifact.
- Fix: Use as for aliases (e.g., node "Server" as srv).
- Error: Overlapping connections → Use left-to-right direction.
- Fix: Add -[hidden]-> for complex paths.
- Error: Missing stereotypes → Use <
> for clarity. - Fix: Refer to the PlantUML stereotypes section.
When to Consider Alternatives
You've learned how to create a deployment diagram in PlantUML, but relying on code doesn't suit every scenario. Some processes demand quicker edits and less effort in coding. EdrawMax can help in those situations. When PlantUML feels restrictive, switching to something more visual and adaptable might be worth it.
PlantUML Limitations
Here are some PlantUML drawbacks:
- Tough to Learn Without Coding Knowledge: People who don't know coding might struggle to understand or fix the syntax.
- Layout Needs Fixing by Hand: The auto-layout option doesn't always arrange things, so users often adjust it themselves.
- Styling Options are Limited: Users can adjust fonts, shapes, or icons, but there isn't as much freedom compared to GUI tools.
- Editing Slows Down Work: Small edits mean updating code and re-rendering diagrams, making the process slower.
Example:
@startuml
node "Web Server" as web
node "Database Server" as db
node "Cache Server" as cache
web --> db : JDBC
web --> cache : Redis
@enduml
Manual Fix:
@startuml
left to right direction
node "Web Server" as web
node "Database Server" as db
node "Cache Server" as cache
web --> db : JDBC
web --> cache : Redis
@enduml
Tired of Manual Coding? Here's a Smarter Way to Diagram
Fixing alignment or syntax errors can waste a lot of time and make creating a diagram harder than it should be. PlantUML gives you some control, but even minor mistakes can ruin the whole structure. If the final look of the diagram matters to you, using a visual builder could save you effort. This is where EdrawMax stands out.
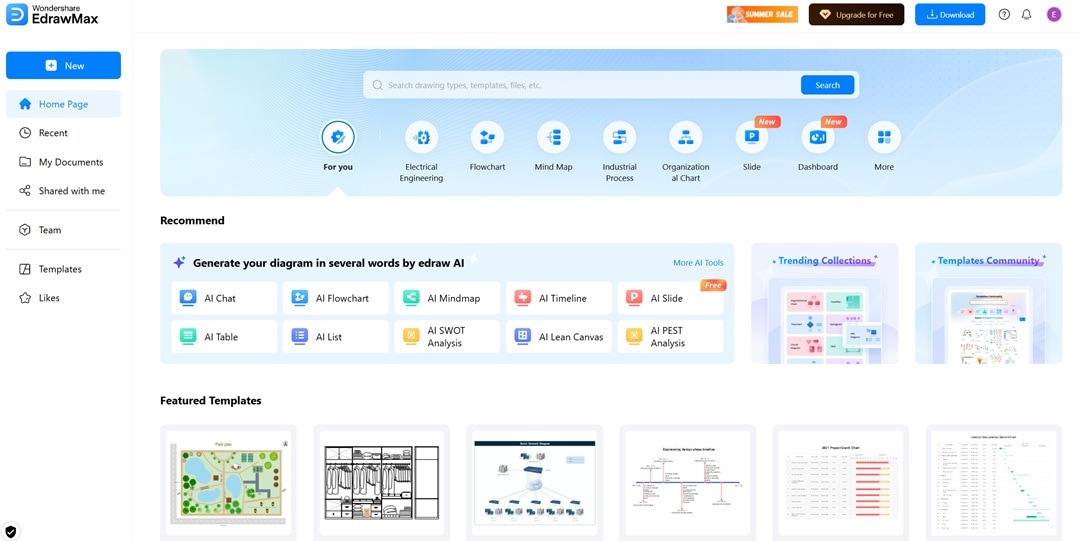
EdrawMax Online allows you to design deployment diagrams by dragging shapes onto the canvas. You don't have to type anything or learn any special syntax. It offers ready-made templates, lets you change node colors, and makes it easy to move objects around. Compared to PlantUML, you don't have to deal with code or fixing alignment issues.
Why You Will Love It
- Drag-and-Drop Option: Use drag-and-drop tools to create deployment diagrams by placing nodes and connectors on the canvas. No need to write code.
- Library of Deployment Templates: Start with ready-made UML deployment diagram templates. These include options like cloud architectures, microservices, or layered systems.
- Options to Customize Design: Tweak node shapes, change colors, adjust icons, or modify connectors with easy clicks. This helps to produce clearer visuals.
- Quick Export Across Formats: Save your diagram in formats like PNG, PDF, SVG, Word, or PPT with one click. No additional steps are necessary.
"The ease of use, with no learning curve, is what attracted me to EdrawMax. In EdrawMax, the icons and controls are where they are logically supposed to be on the screen. In competitor software, I used to struggle a lot even with basic alignment of objects in the screen, but with EdrawMax, this process is a built-in feature."
Wrapping Up Your Deployment Diagram Journey
Designing system architecture does not need to seem like something only developers handle. Using the proper approach allows anyone to map nodes and connections simply. Those who like working with code and keeping diagrams version-controlled with other project files can find PlantUML a reliable tool.
This guide explained how to create a deployment diagram in PlantUML with clear examples. Moreover, we talked about verified syntax and tips. We also covered ways to steer clear of typical mistakes and make the diagrams more accurate.
Anyone looking to skip writing syntax can turn to EdrawMax Online as a practical choice. You can drag, drop, style, and export with this tool. It requires no installation or coding knowledge. Choose the one that fits your way of working and figure out which lets you achieve results with less effort. Check them out today!