


Line charts are one of the best ways to visualize data trends over time. A well-designed line chart makes complex data easier to understand. It can track sales growth, analyze performance, or present research findings. PowerPoint provides built-in tools to create line charts with a few clicks.
In this guide, you’ll learn how to insert a line chart in PowerPoint. The page will also explain the different types of line charts available and introduce Wondershare EdrawMax for those looking to create more customized and professional diagrams.
In this article
Method 1: Make a Line Chart in a PowerPoint Presentation
PowerPoint allows you to create line charts using its built-in chart tools. Follow these steps to insert and customize a line chart in your presentation:
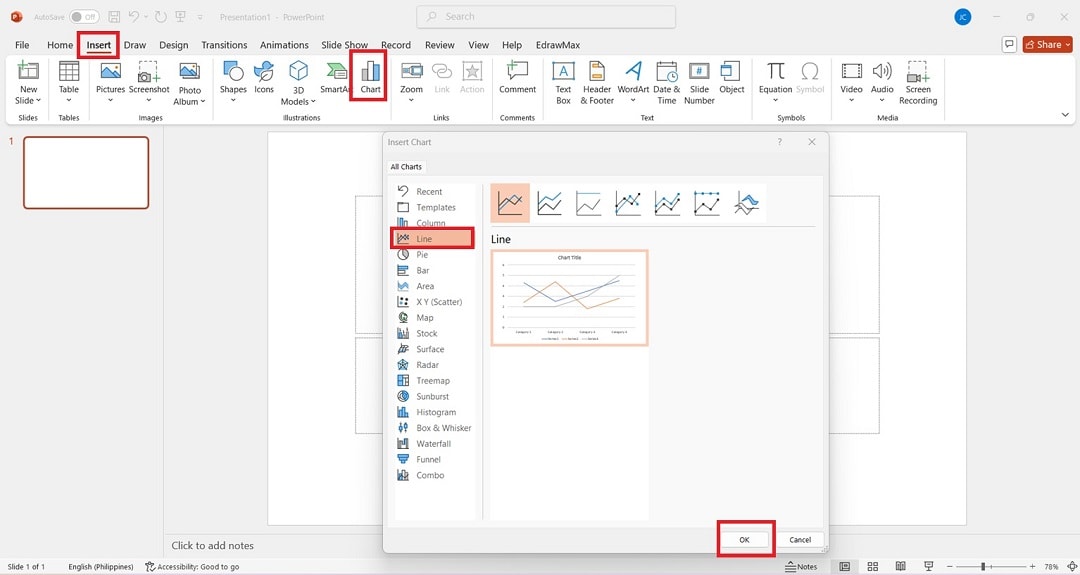
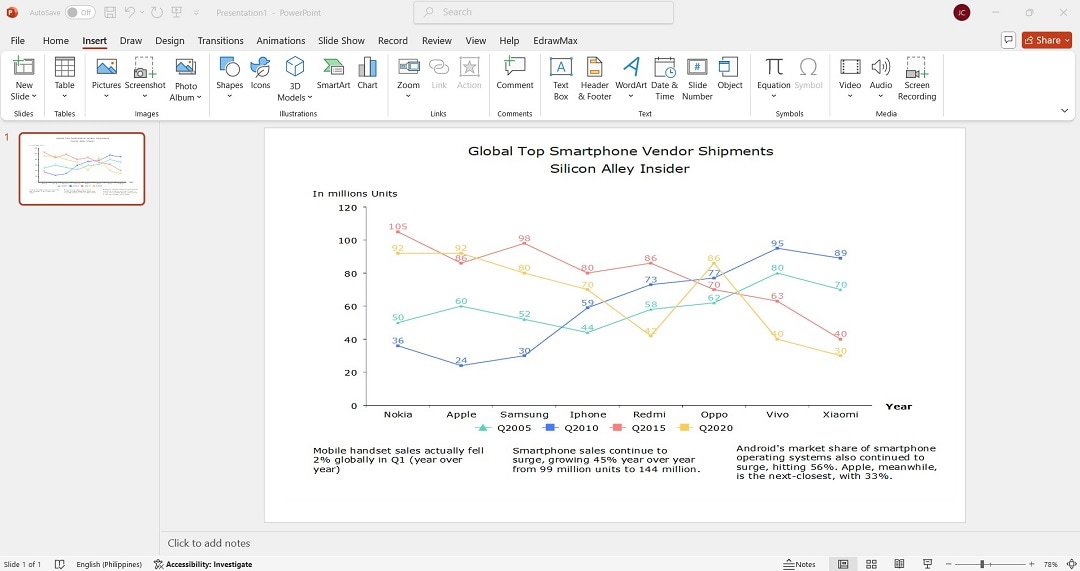
Step 1Insert a Line Chart
Open your PowerPoint presentation and go to the slide where you want to add the chart. Next, click the Insert tab in the ribbon. Select Chart, then choose Line from the list of chart types. Click OK, and a sample line chart with placeholder data will appear.
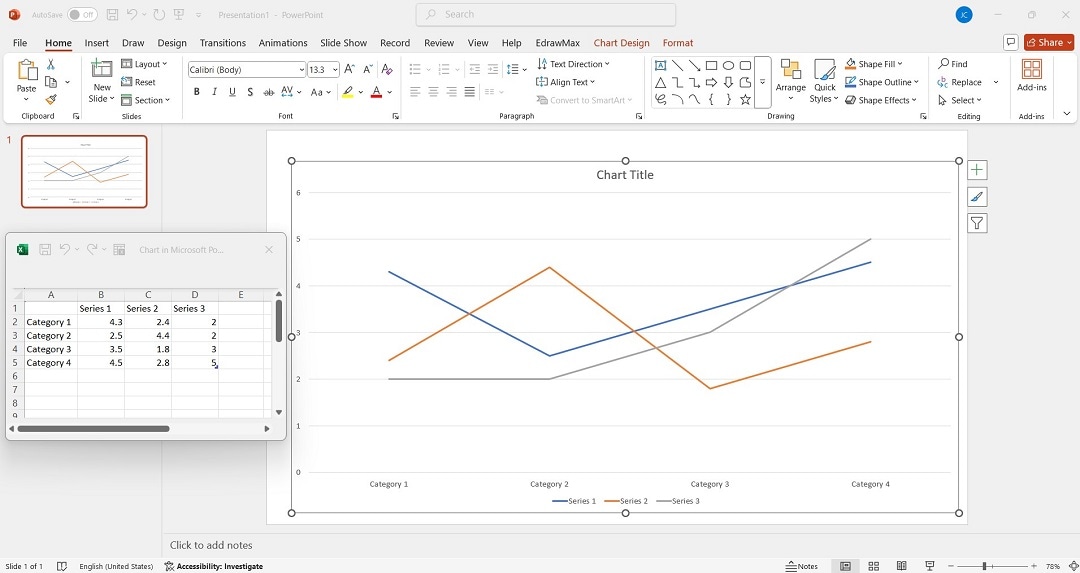
Step 2Enter Your Data
A small Excel spreadsheet will open alongside your chart. Replace the sample values with your own data. PowerPoint automatically updates the chart as you modify the data.
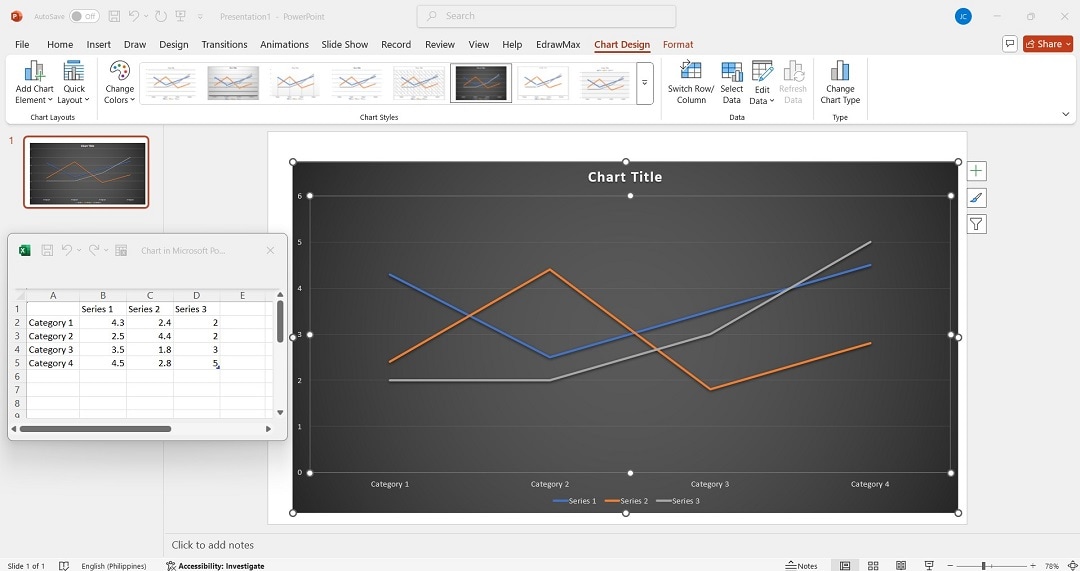
Step 3Customize the Line Chart
Click the chart to reveal the Chart Tools menu. Use the Chart Styles and Chart Elements options to adjust colors, gridlines, and labels. Click Design and choose a style that best suits your presentation.
Step 4Format the Axis and Labels
Right-click on the X-axis or Y-axis and select Format Axis to adjust the scale and appearance. Click the chart title to rename it according to your dataset.
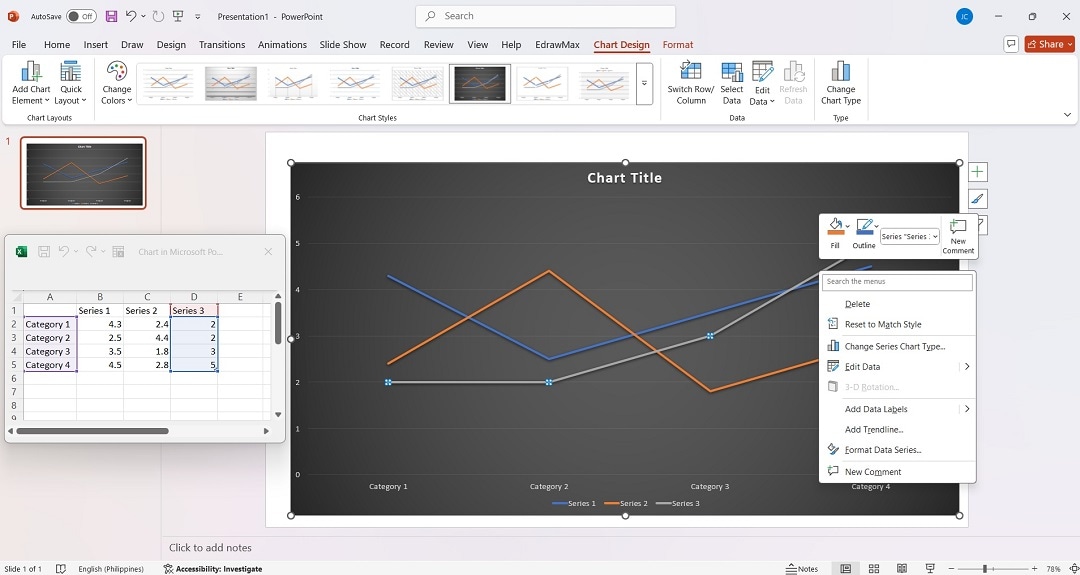
Now, your line chart is ready to be used in your presentation!
Types of Line Charts in PowerPoint
PowerPoint offers many types of line charts to fit different data visualization needs. Here’s a quick overview of the available options:
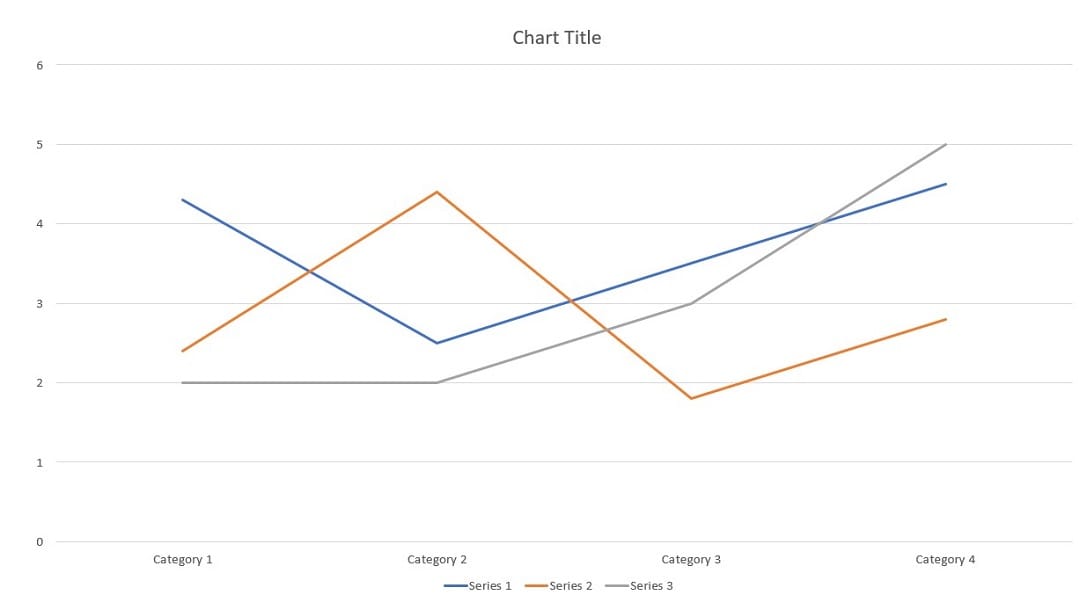
Line and Line With Markers
The standard line chart displays data trends over time. The “Line with Markers” version includes dots at each data point for better visibility.
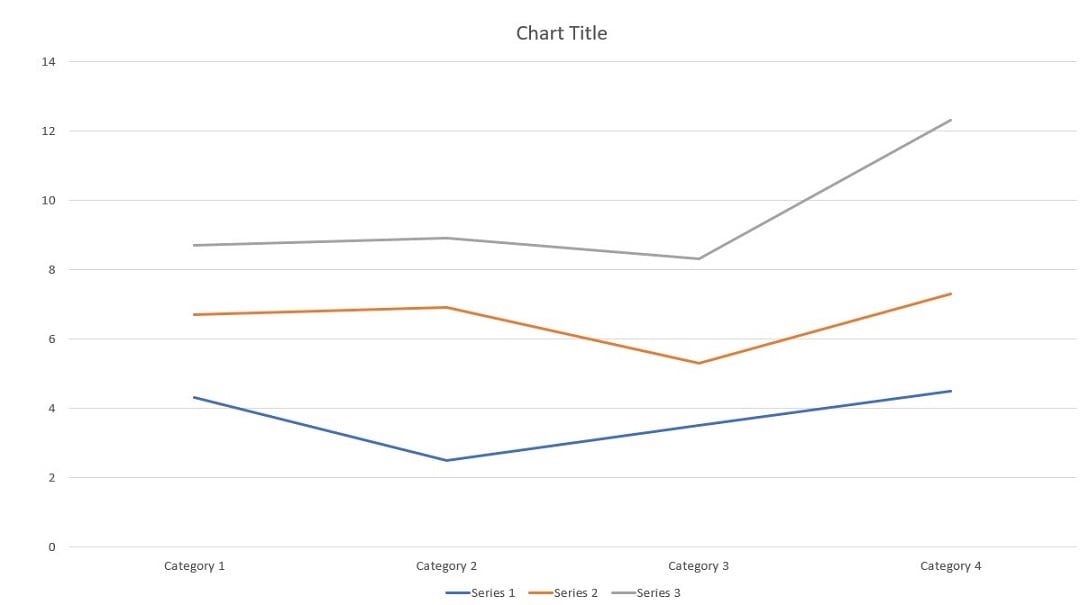
Stacked Line and Stacked Line With Markers
A stacked line chart shows cumulative trends for multiple data series. The “Stacked Line with Markers” variation adds markers for precise data points.
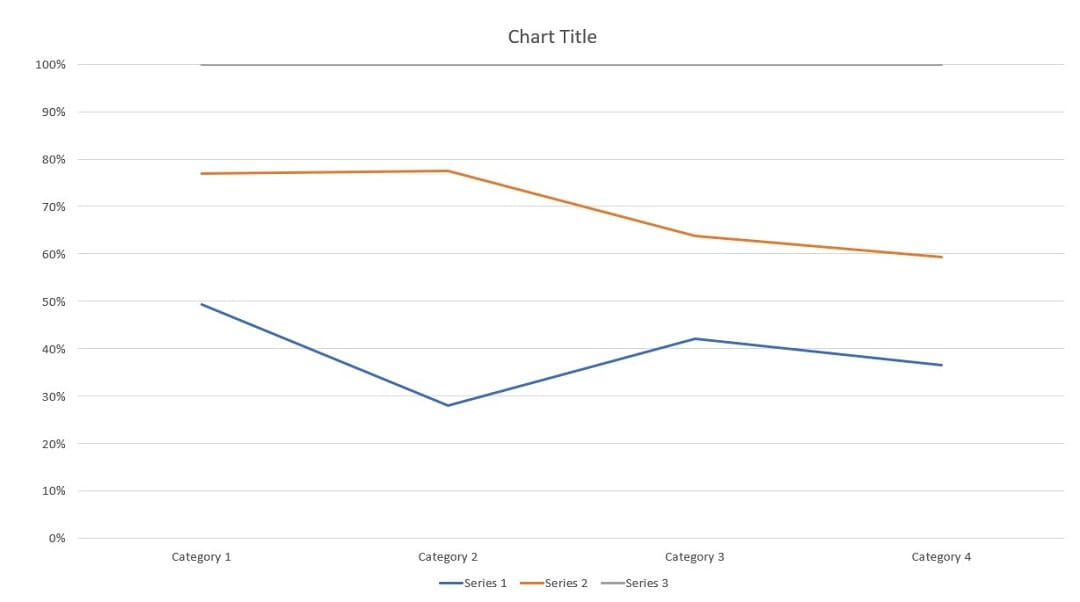
100% Stacked Line and 100% Stacked Line With Markers
This type adjusts values proportionally so that each line sums up to 100%. The markers version highlights individual data points within the 100% stacked trend.
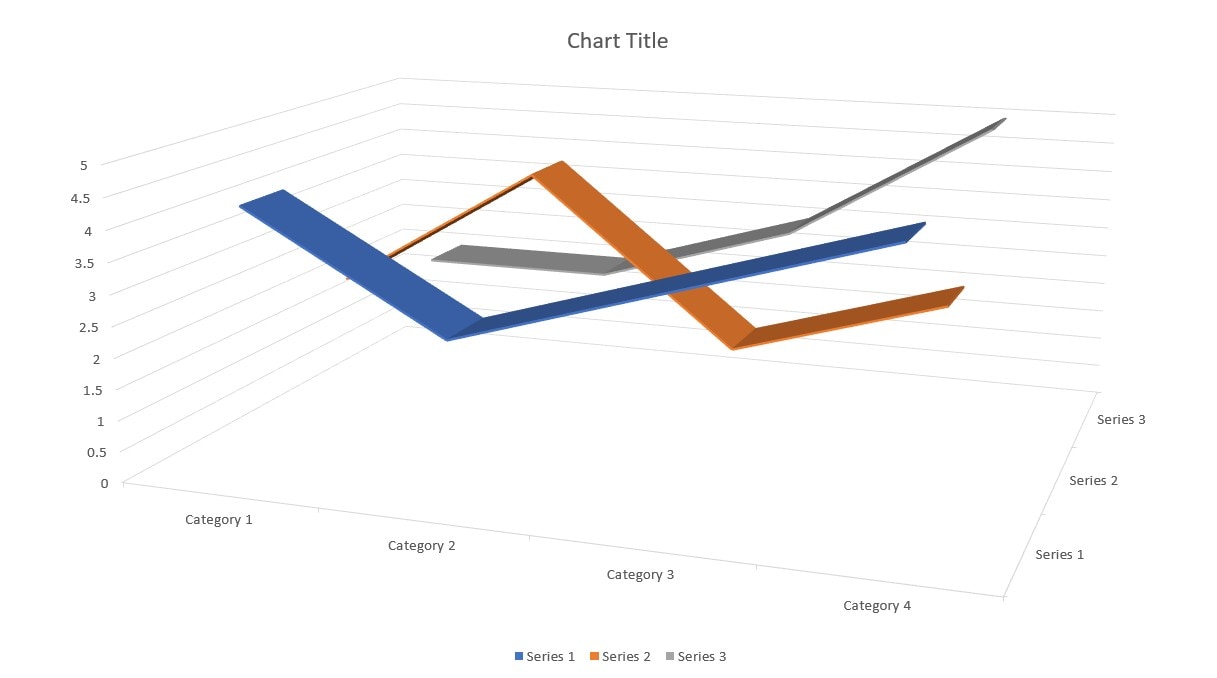
3D Line Chart
The 3D effect adds depth and makes the chart more visually engaging. Ideal for presentations that require a more dynamic appearance.
Why Consider Using Extra Visuals?
While line charts are excellent for displaying numerical trends, sometimes, more visuals like diagrams or mind maps can enhance comprehension. If you need a better way to organize and present complex information alongside your data, EdrawMax Line Chart Maker provides advanced diagramming tools to complement your PowerPoint presentations.
Make Professional Diagrams in PowerPoint With EdrawMax Add-In
If you want more customization and flexibility beyond PowerPoint’s built-in charts, the EdrawMax add-in is a great solution. It allows you to create detailed diagrams, mind maps, and flowcharts directly within PowerPoint. Here’s how you can use it:
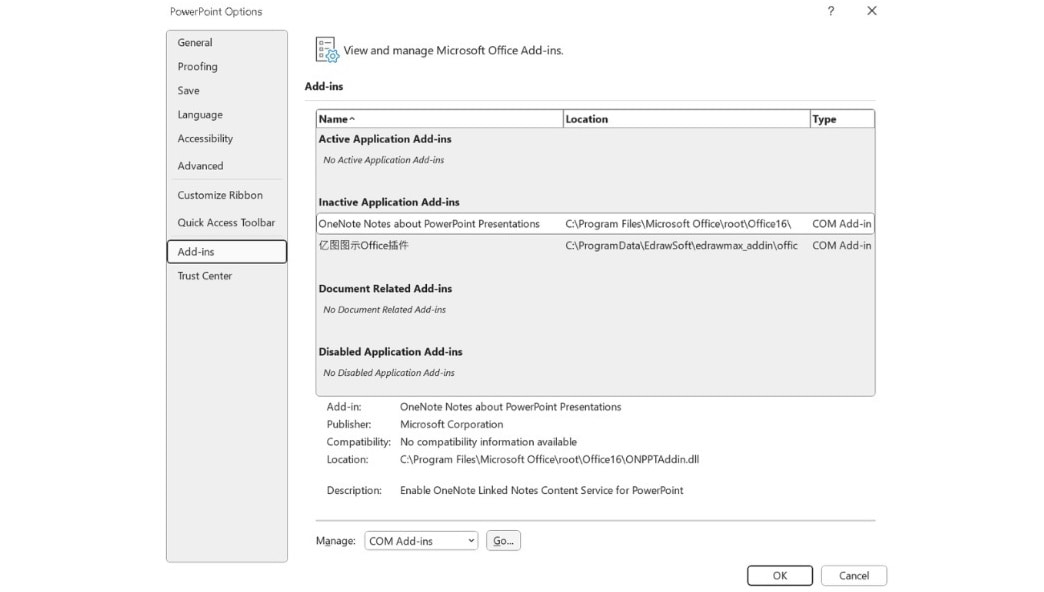
Step 1Install the EdrawMax Add-In
Download and install EdrawMax on your computer. The PowerPoint add-in comes with it. Launch PowerPoint. Next, go to File > Options > Add-ins > Manage > COM Add-ins > Go.
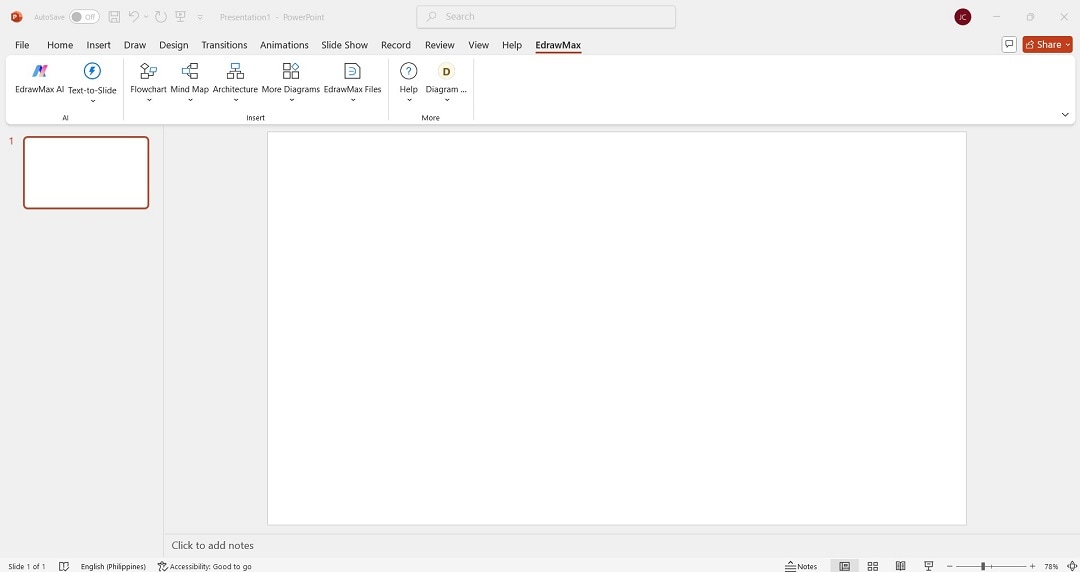
Step 2
Once installed, open your PowerPoint presentation or start from scratch. Click EdrawMax in the toolbar. Log in or register a Wondershare account to begin.
Step 3
Click More Diagrams to launch the Templates window. From a variety of templates, use the search bar to look for line charts. Take a pre-made line chart template as an example.

Step 4 Create and Customize a Diagram
Use the drag-and-drop feature to add shapes, icons, and connectors. Customize colors, fonts, and styles to match your presentation’s theme. Take advantage of PowerPoint and EdrawMax’s customization tools to personalize your line chart.
Step 5
Resize and position the diagram as needed. Make final revisions. When you’re done, save your work.
With EdrawMax, you can create professional and visually appealing diagrams in seconds. Take advantage of the add-in to complement your PowerPoint line charts and improve data presentation.
Conclusion
Creating a line chart in PowerPoint is simple. It’s an effective way to show trends and patterns in your data. PowerPoint provides many chart types to help tailor your charts to your needs. However, if you need more flexibility, EdrawMax offers powerful diagramming tools. Its features go beyond basic line charts.
If you need to create detailed flowcharts, mind maps, or custom diagrams, EdrawMax is the way to go. The tool makes it easy to structure and enhance your presentations. Try it today to take your PowerPoint visuals to the next level!
AI Diagram Generator
Enter your prompt. Upload files if needed. Generate diagrams, charts, or slides instantly.


